
Breaking the Pattern
Investigating Airline On-Time Performance Declines in 2022
Overview
This analysis investigates airline on-time performance trends from 2004 to 2025, with a focus on identifying when and where punctuality faltered most. The primary challenge addressed is operational inefficiency in 2022, as measured by falling departure and arrival on-time rates. This study aims to help Airline Operations Managers detect systemic issues, anticipate performance dips, and better manage scheduling and resource planning.
Key Results
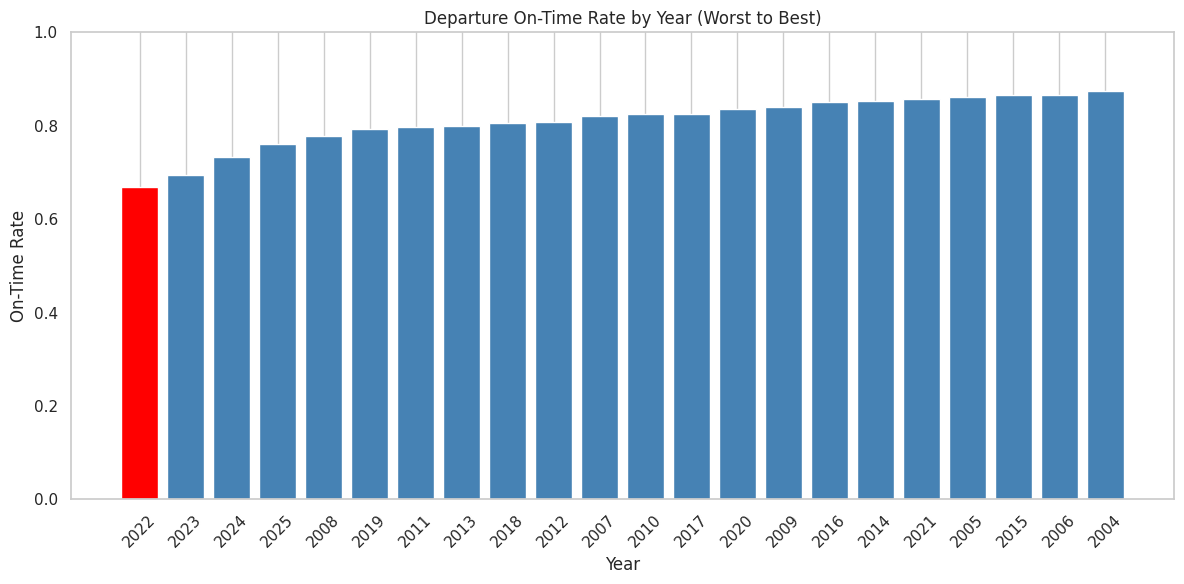
1. Which year recorded the lowest average on-time departure and arrival rates?
- 2022 had the lowest airline punctuality on record, with a departure on-time rate of 66.96% and an arrival on-time rate of 68.03%, marking a clear deviation from historical norms between 2004 and 2025.
- Visual analysis confirmed 2022 as the worst-performing year, with the year highlighted in red and positioned far left in bar charts, clearly below all other years in on-time performance.

2. What are the monthly trends in on-time departures and arrivals in 2022?
- On-time performance declined sharply in the first half of 2022, hitting a low in July with departure and arrival on-time rates of 51.46% and 53.04% respectively, reflecting peak operational strain.
- Performance began recovering from August, ending the year in December with rates of 69.77% for departures and 70.30% for arrivals—still below the typical 80% industry benchmark.
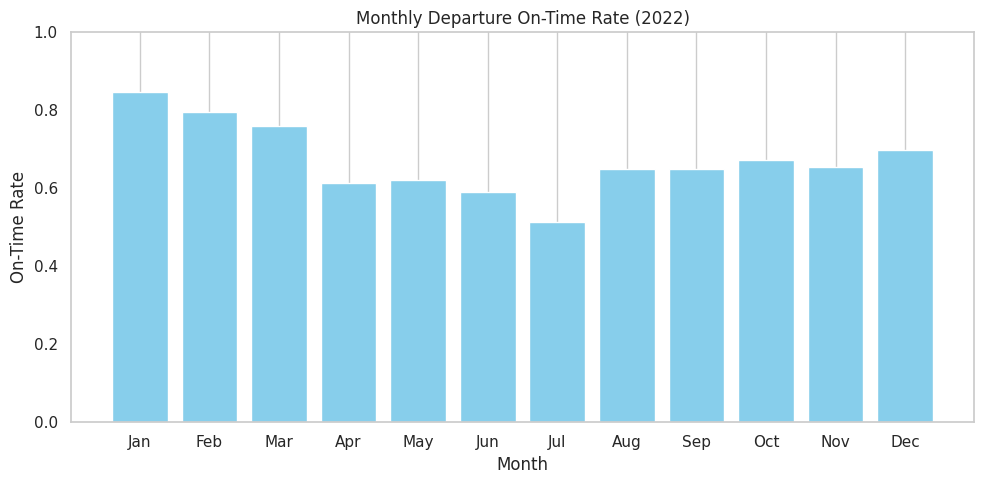

3. Are there specific months associated with high delay rates in 2022?
- July was the peak month for delays in 2022, with a departure delay rate of 48.54% and arrival delay rate of 46.96%, followed closely by June (41.49% and 39.76%) and August (37.24% and 35.06%).
- A sustained rise in delays from March to July indicates a clear mid-year operational stress period, reinforcing the need for targeted planning during these high-risk months.


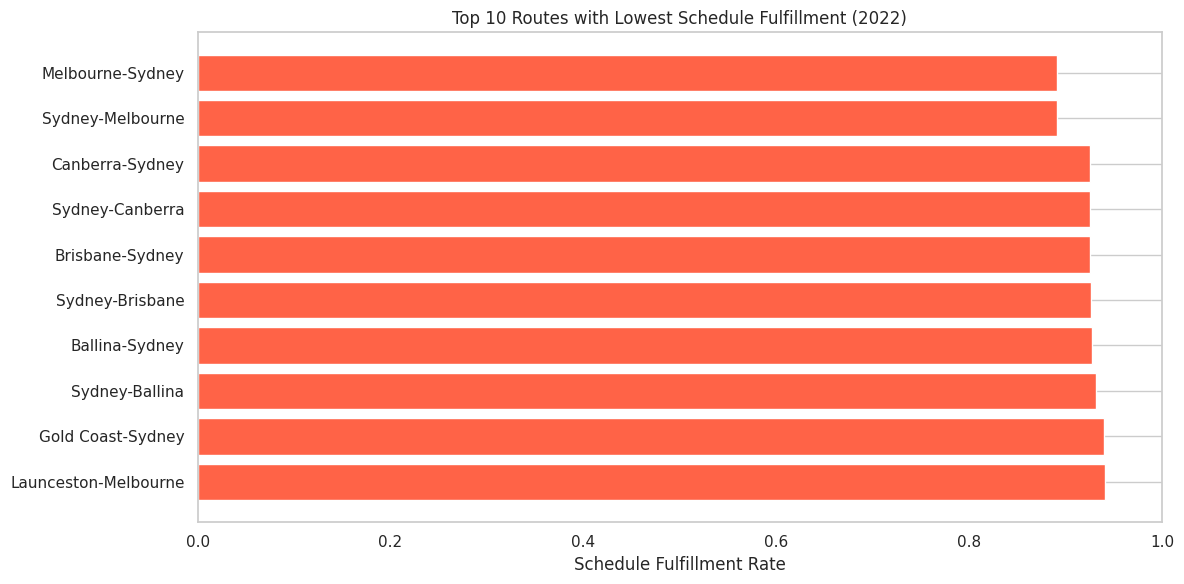
4. Which routes or airports consistently experience delays?
- The Melbourne–Sydney and Sydney–Melbourne routes had the lowest schedule fulfillment in 2022, both at 89.09%, while Canberra–Sydney and Sydney–Canberra followed at around 92.5%, indicating repeated delays on high-traffic corridors.
- Sydney Airport appeared in 7 of the 10 most delayed routes, and Melbourne in 4, highlighting persistent congestion and scheduling inefficiencies at these major hubs.
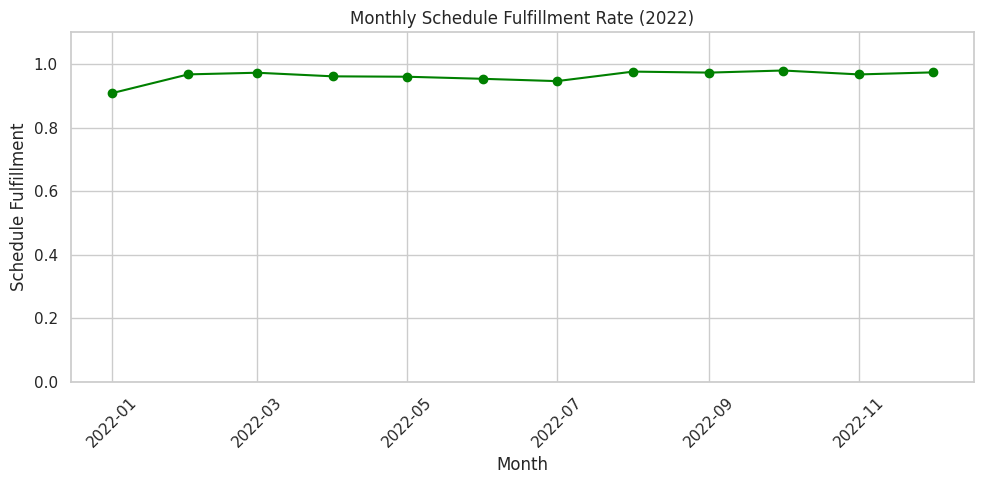
5. Is there a mismatch between scheduled vs. actual sectors flown in 2022?
- Schedule fulfillment remained consistently high in 2022, with most months exceeding 95% and the lowest at 90.86% in January—well above the common 90% alert threshold.
- Even during peak delay periods from April to July, fulfillment rates stayed above 94.6%, indicating that delays were due to timing inefficiencies, not cancellations or missed operations.
6. Are there early warning signals of operational stress in 2022?
- Between April and July 2022, departure delay rates surged from 38.53% to 48.54%, while on-time performance fell to a low of 51.46%, signaling a period of significant operational stress well below the 70% industry threshold.
- Despite elevated delays through November, schedule fulfillment stayed above 94%, confirming that flights continued as scheduled but faced severe punctuality issues, highlighting the need for early detection and mitigation planning.

Goals Alignment
The identified trends directly relate to the airline's goal of maximizing operational efficiency by maintaining high on-time performance. Discovering that 2022 saw such significant performance declines, especially on core high-traffic routes, underscores the need for strategic adjustments.
Impact
Understanding which months and routes are most susceptible to delays allows operations managers to proactively allocate resources, adjust staffing, and fine-tune fleet scheduling. The data also helps support compliance with industry benchmarks and enhances the passenger experience by minimizing disruptions.
Data Interpretation
The steep decline in performance from April to July 2022 suggests that internal operational stress coincided with external demand surges. Delay rates exceeded 48% in July, while on-time rates dipped below 60%, a signal of compounding inefficiencies. Despite these challenges, flights were still being flown as scheduled, confirming that core operations continued but with reduced efficiency.
Contextual Factors
This mid-year operational strain likely stems from a combination of seasonal peaks, staffing shortages, or airport congestion, particularly at major hubs like Sydney and Melbourne. Recovery trends from August to December suggest that mitigating actions may have been taken late in the year but were insufficient to fully restore historical performance levels.
Recommendation
The sharp dip and delayed recovery in punctuality highlight the importance of early detection and proactive mitigation. High-risk periods, particularly mid-year, require tighter scheduling control, more flexible staffing models, and better route-specific performance monitoring.
Operations teams should implement early warning systems that flag rising delay rates by route and month. Additional investment in crew management systems and AI-powered schedule optimizers may help preempt future performance dips. Focused efforts to decongest Sydney and Melbourne corridors—through schedule staggering or backup aircraft planning—could also alleviate peak-period stress.
Conclusion
The analysis confirms that 2022 represented a critical deviation from historical punctuality patterns, especially during the April–July window. While operational stress did not prevent flights from being fulfilled, it significantly affected timing reliability. Moving forward, the airline can make data-driven decisions to address route-specific bottlenecks, optimize peak-period performance, and restore service consistency across its network.