
Finding the Sweet Spot
Uncovering the Best Locations and Price Points for Mid-Sized Home Investments
Overview
This analysis explores the pricing landscape of residential properties sized between 2,000 and 2,500 square feet, a segment commonly sought by real estate investors seeking a balance between affordability and growth potential. Using historical sales data, the objective is to establish reliable pricing benchmarks, identify outliers, and determine how consistently properties in this size range perform across different cities and features.
By modeling price distributions and quantifying variability, the study provides investors with a data-driven foundation to assess whether a property is undervalued, overvalued, or fairly priced.
1. What is the typical price range for homes between 2,000–2,500 sqft in this market?
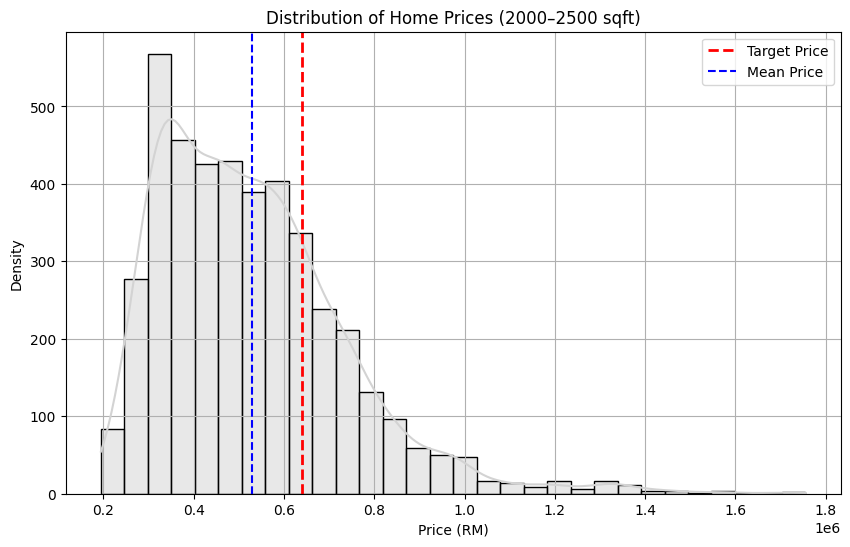
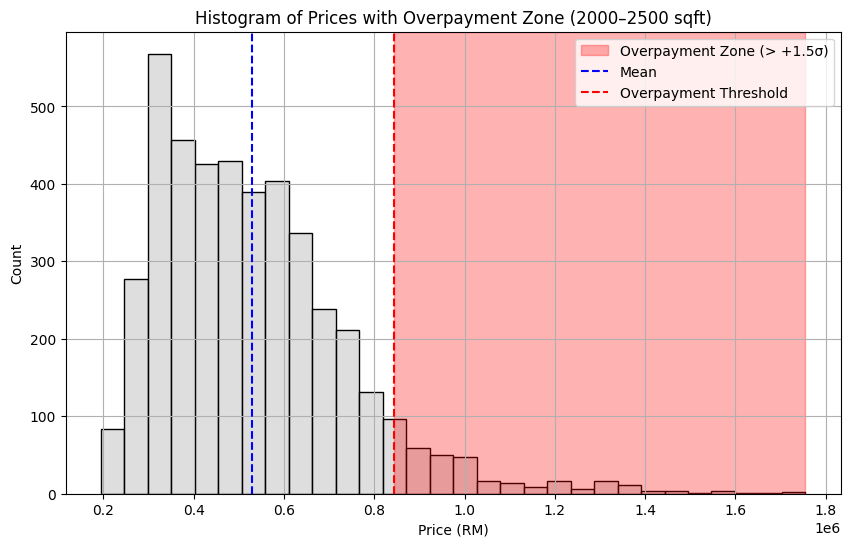
Based on historical sales data, the average price for homes in the 2,000–2,500 sqft range is RM 529,579, with a median price of RM 497,000. Prices span from a minimum of RM 194,250 to a maximum of RM 1,755,000. Most homes fall within the RM 320,000 to RM 740,000 range, which represents one standard deviation (±1σ) from the mean.
The distribution is right-skewed, meaning most homes are priced in the mid-range, while fewer higher-end properties pull the average upward. This pattern is confirmed by a histogram showing a dense cluster of prices between RM 400K and RM 600K, with outliers on the higher end.
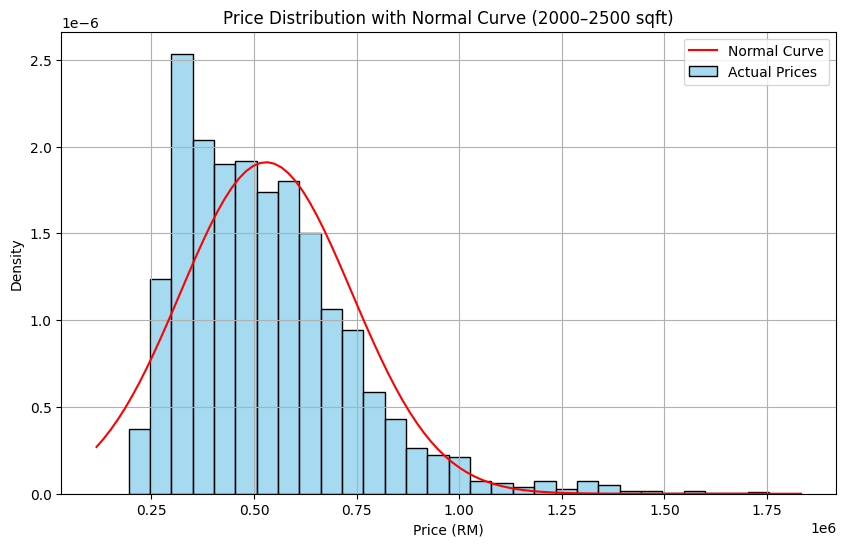
For investors, this range offers a practical benchmark. Homes priced below RM 320K may present undervalued opportunities, while those above RM 740K may require closer scrutiny to avoid overpaying.
2. How variable is the pricing for homes in the 2,000–2,500 sqft range?
Price variability in this segment is moderate. The standard deviation is RM 208,869, and the interquartile range (IQR) is RM 274,000. The coefficient of variation (CV) is 0.394, indicating that price fluctuations exist but are not extreme.
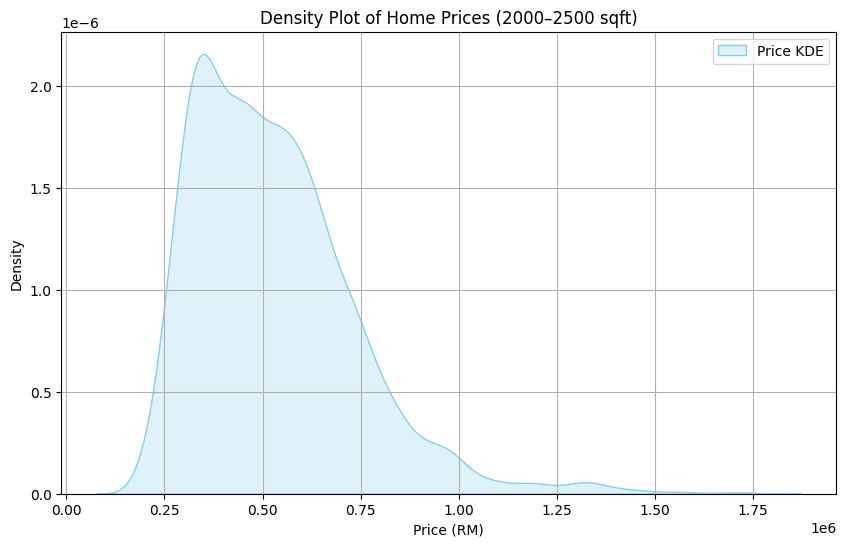
Boxplots by city show consistent median values between RM 450K and RM 550K, although some cities like Subang Jaya and Cheras show wider spreads. KDE plots reveal a sharp density between RM 400K and RM 600K, with a long right tail suggesting a few high-priced homes that contribute to overall variability.
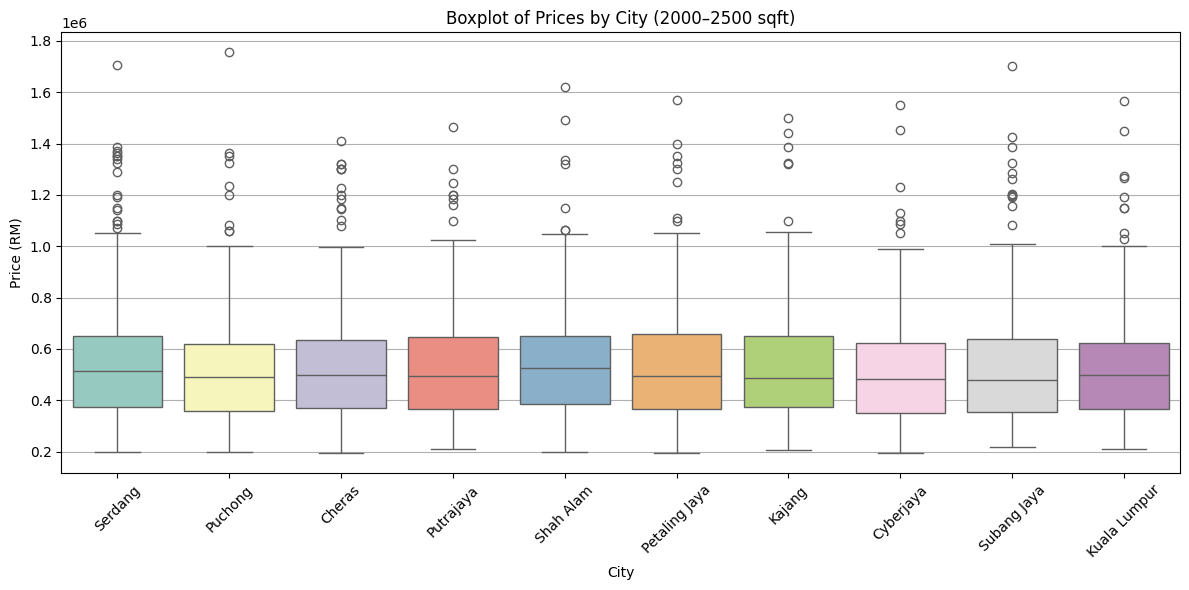
This means most homes are predictably priced, but the presence of high-end outliers increases the spread. Investors can expect a consistent pricing environment in most cities, but should account for price dispersion when targeting luxury or upgraded properties.
3. What percentage of 2,000–2,500 sqft homes fall within 1 or 2 standard deviations of the mean?
Approximately 72.6% of homes in this size range are priced within one standard deviation (±1σ) of the mean, between RM 320,710 and RM 738,448. Expanding the range to two standard deviations (±2σ), between RM 111,841 and RM 947,318, captures 95.84% of homes.
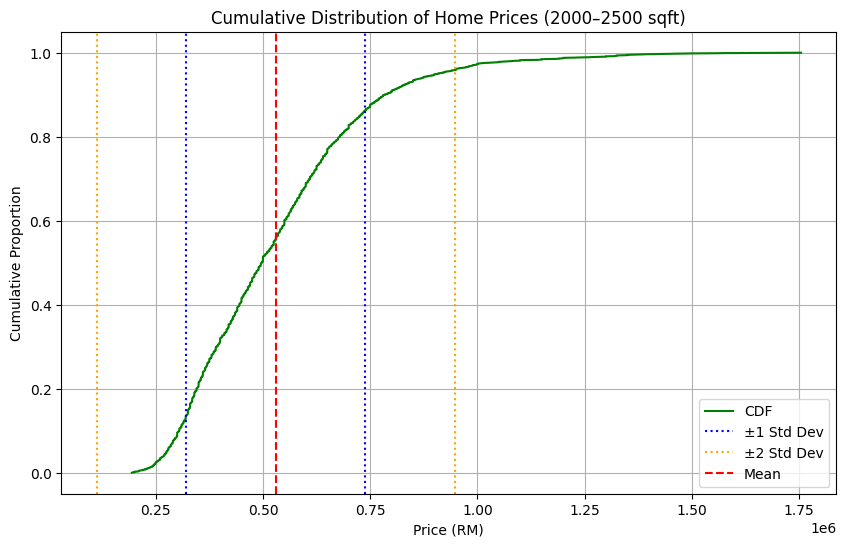
Visual analysis supports these findings. In the histogram, the majority of price occurrences fall within the ±1σ zone, while the cumulative distribution curve rises steeply in that same range. Homes priced beyond ±2σ are rare outliers.
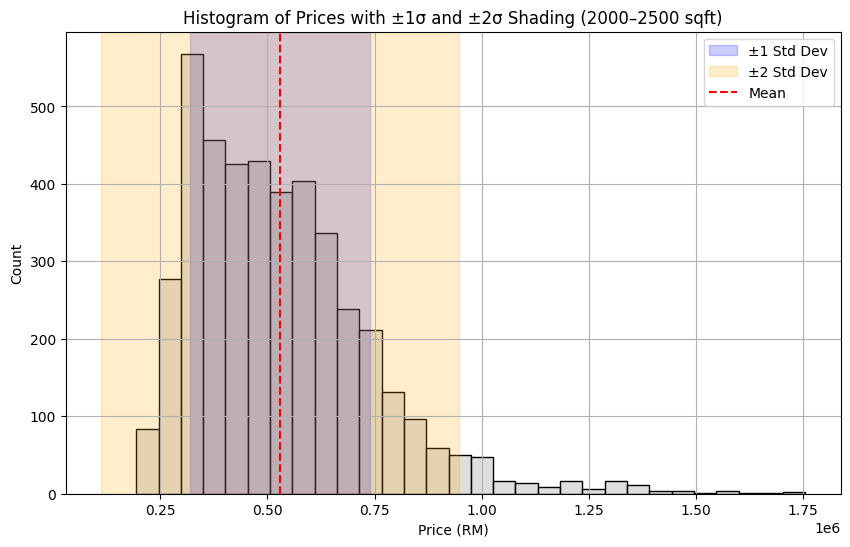
This clustering indicates that the price range is highly reliable, giving investors confidence when estimating value. Properties priced outside the ±2σ band should be treated as exceptional cases requiring further validation.
4. Where does a specific target property in this size range sit within that price distribution?
A target property priced at RM 640,000 sits slightly above the market average. With a z-score of 0.53, this price is just over half a standard deviation above the mean and falls at the 70th percentile—more expensive than 70% of similar properties.
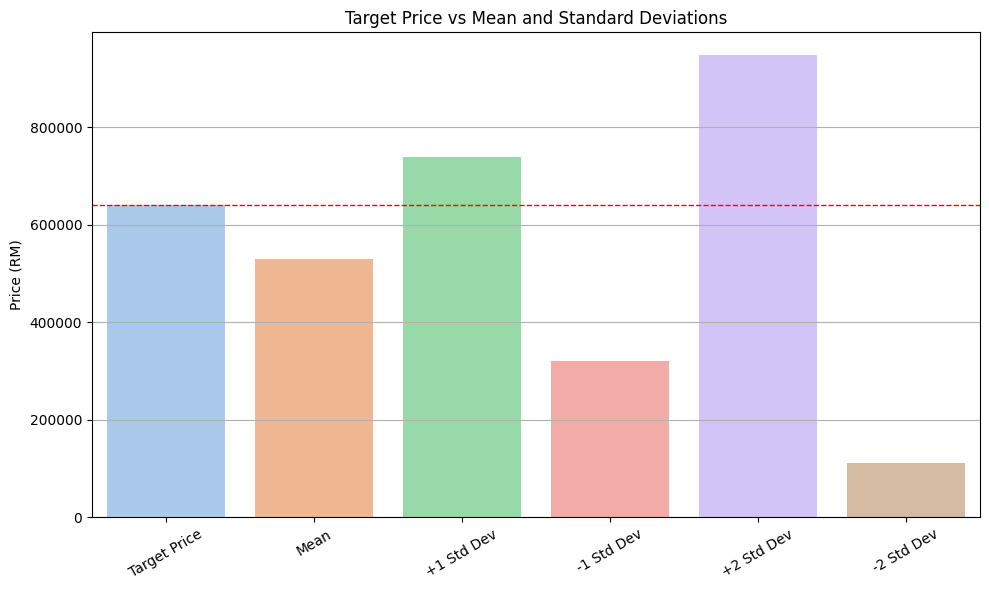
The target price remains within the expected price band (below RM 738,000) and aligns with the densest part of the distribution, as shown in both the histogram and bar chart. It does not fall into the overpayment zone but does carry a slight premium.
This pricing could be reasonable if the home offers added value through renovation, location, or premium features. If such attributes are missing, investors may consider negotiating a better price or exploring similar properties in the RM 500K–RM 600K range.
5. What is the risk of overpaying for a 2,000–2,500 sqft home based on historical pricing behavior?
The historical risk of overpaying is relatively low. Only 7.04% of homes in this segment were sold above RM 842,883, which marks the overpayment threshold (defined as 1.5 standard deviations above the mean).
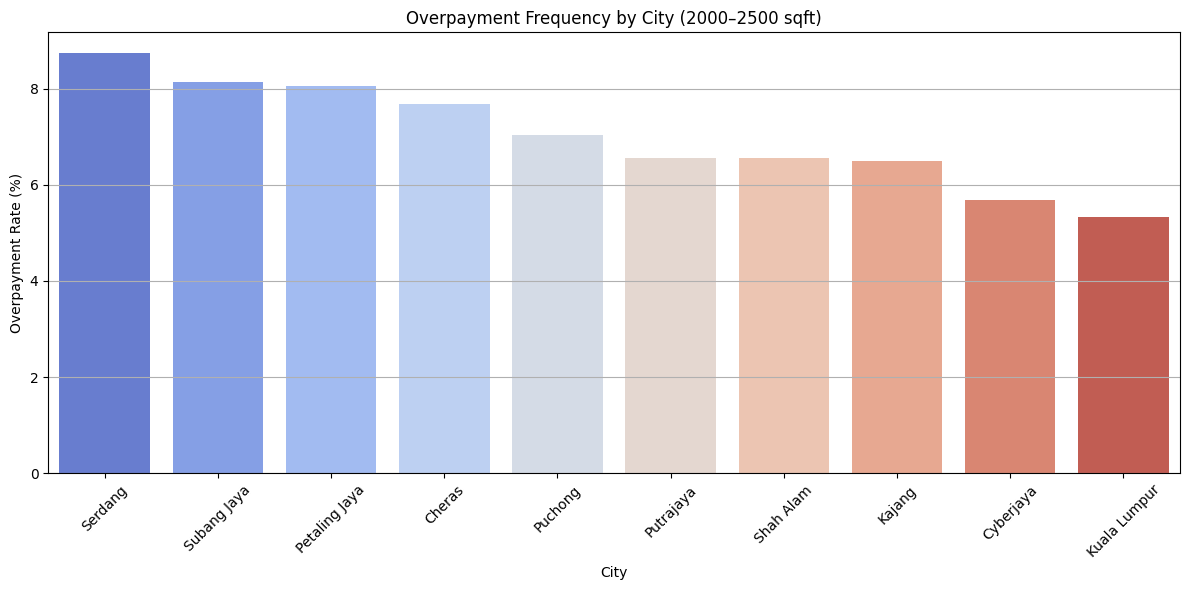
The histogram shows that most transactions fall below this threshold. City-level analysis reveals that Serdang, Subang Jaya, and Petaling Jaya have the highest overpayment rates, each exceeding 8%. In contrast, Kuala Lumpur and Cyberjaya show lower overpayment tendencies, both below 6%.
Overpayment risk also varies by grade. Grade 11 homes show a 100% overpayment rate, while homes graded 10 are at 40%. Properties graded 7 or lower show minimal risk.
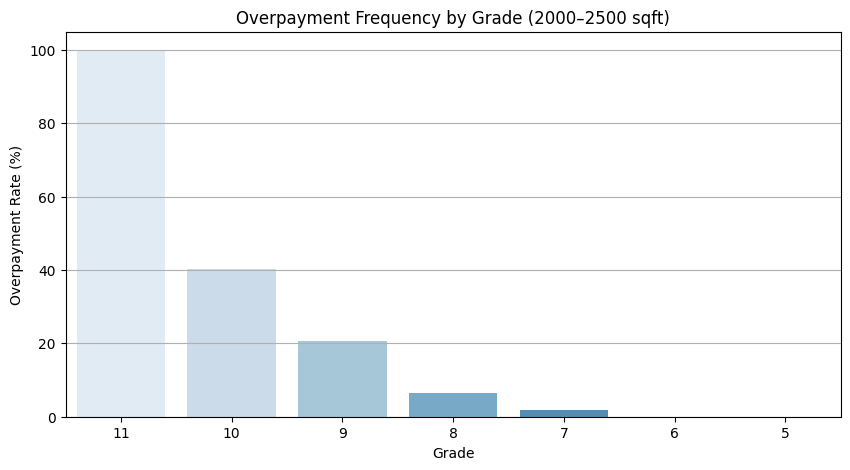
Investors should be especially cautious when buying high-grade homes or investing in high-demand areas. Using RM 842K as a ceiling for fair pricing can help avoid paying above market value unless there is clear justification.
6. Is targeting 2,000–2,500 sqft homes a repeatable investment strategy, or is this case-specific?
Targeting homes in the 2,000–2,500 sqft range appears to be a repeatable and scalable strategy, particularly in cities with predictable pricing. Cities such as Cyberjaya and Kuala Lumpur exhibit moderate average prices (around RM 510K–520K) and low standard deviations (below RM 200K), making them ideal for stable investments.
Cities like Serdang and Petaling Jaya offer higher average prices but also greater variability, which may appeal to investors willing to take on slightly more risk for higher potential returns. Shah Alam and Putrajaya offer a balance of price stability and market size.
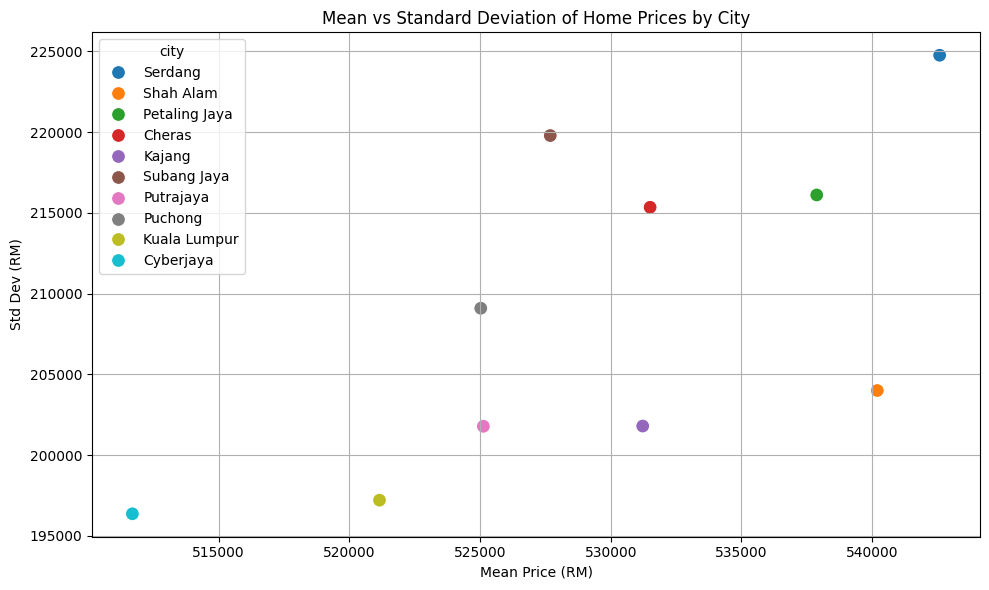
The scatter plot shows these patterns clearly, with cities in the lower-right quadrant representing ideal conditions for repeatable investment. In contrast, cities in the upper-left reflect less consistency and may require more deal-by-deal evaluation.
7. Do other features (e.g., location, grade, renovation status) significantly influence pricing within the 2,000–2,500 sqft range?
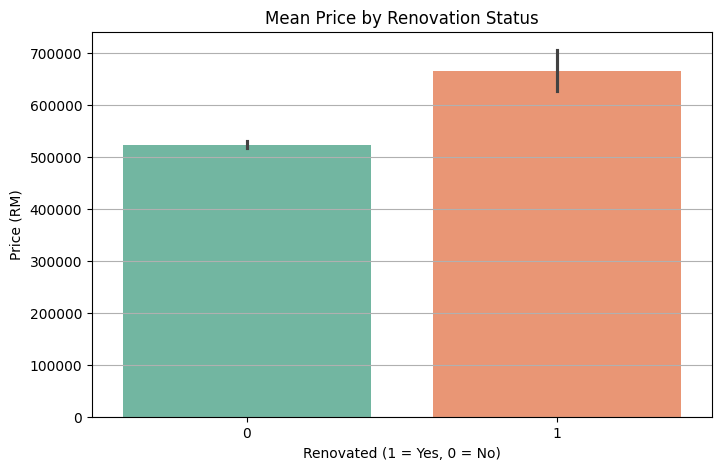
Yes, several features have a significant impact on pricing. Renovated homes are priced RM 140K higher on average compared to non-renovated ones, showing that renovations contribute clear value. Homes with basements show a smaller premium, around RM 30K, suggesting additional space is valued, though not substantially.
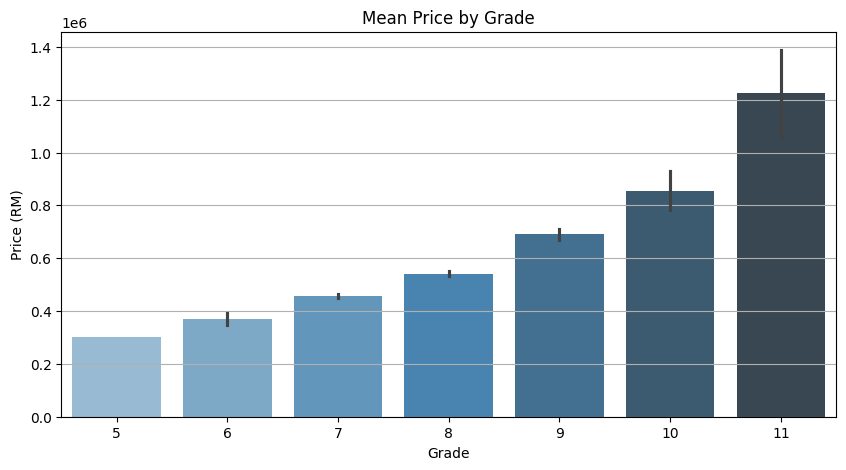
Build quality, as indicated by grade, is the strongest determinant of price. Grade 11 homes average RM 1.23 million, more than four times the price of Grade 5 homes (RM 300K). Price increases steadily with grade and becomes more variable at the higher end, as seen in the violin plot.
City differences are more subtle. Mean prices across Cyberjaya, Kuala Lumpur, Petaling Jaya, and Serdang fall within a close range (RM 511K–RM 543K), so city choice may depend more on volatility, feature mix, and overpayment trends.
For best returns, investors should look for Grade 8–10 homes with renovations in cities that show controlled overpayment and moderate price variability. Combining favorable features can help maximize return while reducing pricing risk.
Conclusion
Based on the historical analysis, the expected price range for homes sized between 2,000–2,500 sqft lies between RM 320,000 and RM 740,000, which corresponds to one standard deviation (±1σ) around the mean price of RM 529,579. This range captures roughly 73% of all transactions, indicating strong clustering and high reliability in pricing for this segment.
Recommended Price Range to Buy
For most investors, the ideal price range for purchasing 2,000–2,500 sqft homes is between RM 450,000 and RM 600,000. This range:
- Falls within the densest part of the distribution curve (as seen in the KDE and histogram),
- Offers the best balance between affordability and resale potential,
- Avoids the overpayment zone while still securing properties above entry-level stock.
Best Locations for Rental Yield and Resale Consistency
Based on the price stability, overpayment behavior, and repeatability analysis:
-
Cyberjaya and Kuala Lumpur offer the most consistent resale outcomes. These cities show:
- Moderate average prices (~RM 510K–RM 520K),
- Lowest price variability (standard deviation < RM 200K),
- Lowest overpayment rates (< 6%).
- For rental income, Cyberjaya stands out due to its large student and tech worker population, high rental demand, and stable pricing. Its moderate property values paired with strong rental markets often lead to above-average rental yields, particularly for renovated or upgraded homes.