
The Hidden Power of Affiliates
Should You Invest in Affiliate Marketing?
Overview
In a competitive environment where maximizing sales growth is critical, this analysis was undertaken to help the company optimize its marketing investments. The primary business challenge is identifying whether increasing spending on Affiliate Marketing—the channel showing the strongest preliminary impact—can meaningfully drive product sales. By quantifying the relationship between Affiliate Marketing spend and units sold, the company aims to predict future sales uplift and guide smarter budget allocation.
This case study provides clear, data-driven insights to inform marketing decisions. It evaluates how Affiliate Marketing spending influences sales, whether the relationship is statistically reliable, and how much additional sales can be expected with greater investment. By building a predictive model, the company can forecast returns under different spending scenarios and recommend strategies to maximize the effectiveness of marketing resources.
Key Question 1
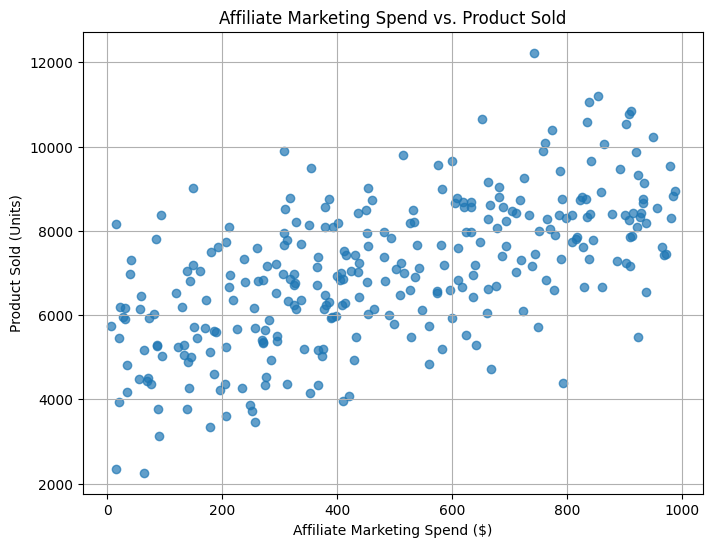
How strongly does Affiliate Marketing spending explain changes in Product Sold?
The R-squared (R²) value from the regression analysis is 0.374, indicating that Affiliate Marketing spending explains about one-third of the variation in Product Sold. This suggests a moderate relationship: while Affiliate Marketing spend contributes significantly to sales, other factors—such as product quality, seasonal demand, customer experience, and other marketing channels—also play substantial roles.
From a marketing management perspective, the results support increasing investment in Affiliate Marketing to drive additional sales. However, it is equally important to maintain a broader marketing strategy to address other sales drivers.
Key Question 2
Is the relationship between Affiliate Marketing spending and Product Sold statistically significant?
Yes, the relationship is statistically significant. The p-value for Affiliate Marketing spend is 0.000, well below the 0.05 threshold. This strong result confirms that changes in Affiliate Marketing spending are reliably associated with changes in Product Sold and not due to random chance.
This provides marketing managers with a high level of confidence to recommend budget increases for Affiliate Marketing, knowing that these investments are strongly linked to measurable sales outcomes.
Key Question 3
What is the estimated increase in Product Sold for each additional $1 spent on Affiliate Marketing?
According to the regression model, the slope coefficient for Affiliate Marketing spend is 3.7486. This means that for every additional $1 invested, the company can expect to sell approximately 3.75 more units.
For instance, a $1,000 increase in Affiliate Marketing spend is estimated to result in about 3,750 additional units sold. This predictable relationship enables precise budgeting and forecasting for future marketing initiatives.

Key Question 4
Can we create a simple formula to predict Product Sold based on Affiliate Marketing spend?
Yes, a simple predictive formula has been established based on the regression results:
Product Sold = (3.7486 × Affiliate Marketing Spend) + 5215.6016
Where:
- 3.7486 is the expected increase in units sold per $1 spent.
- 5215.6016 represents the baseline level of sales without additional Affiliate Marketing spending.
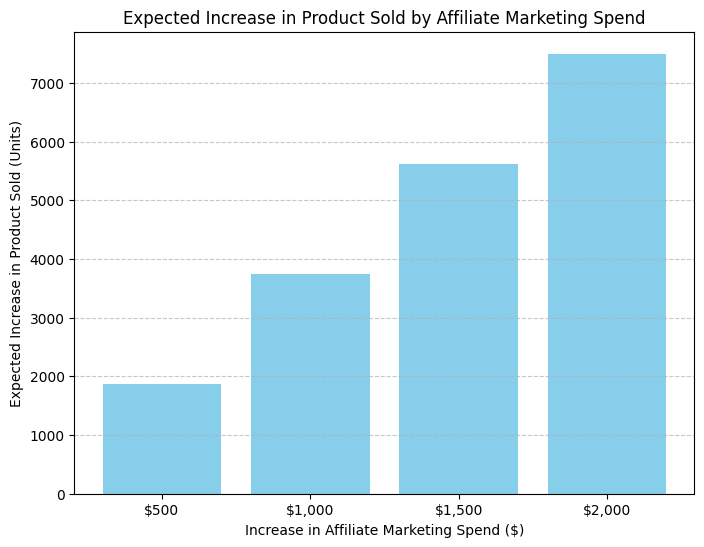
Using this formula, marketing managers can predict future sales outcomes across various spending scenarios:
| Increase in Affiliate Marketing Spend | Expected Increase in Product Sold |
|---|---|
| $500 | 1,874 units |
| $1,000 | 3,749 units |
| $1,500 | 5,623 units |
| $2,000 | 7,498 units |
Key Question 5
How well does the model predict new (unseen) spending scenarios?
The model provides a moderate level of prediction accuracy. While Affiliate Marketing spending is a significant driver of sales, as captured by the R² value of 0.374, more than half of sales variation is influenced by other factors like product competitiveness, seasonality, and market dynamics.
Strengths of the model include:
- High statistical significance (p-value < 0.001).
- A stable, measurable relationship for guiding marketing investment decisions.
Limitations to consider:
- Since over 60% of sales variation remains unexplained, predictions should be used as guides rather than guarantees.
- Regular model updates with new data are recommended to maintain forecasting accuracy.
Conclusion
Increasing ad spend on Affiliate Marketing is likely to contribute meaningfully to higher product sales but will not maximize sales on its own. Affiliate Marketing spending explains a significant portion of sales variation and is a reliable, statistically supported growth driver. However, a complete sales strategy must continue to address other influences through multi-channel marketing efforts.
Recommendations
- Increase Affiliate Marketing Budget with Confidence: Each additional $1 invested is estimated to generate approximately 3.75 more units sold, offering a strong return on investment.
- Allocate Incremental Budget Proportionally: A 10%–20% increase in Affiliate Marketing spend is recommended as a reasonable starting point, especially for historically underfunded campaigns.
- Monitor Performance Regularly: Track actual sales uplift monthly or quarterly to verify if outcomes align with model predictions and adjust spending accordingly.
- Diversify Investments Across Channels: Support other marketing efforts such as social media, content marketing, and SEO to capture the remaining sources of sales variation.
- Refresh the Model with Updated Data: Periodically re-run regression analyses to validate and refine the relationship between Affiliate Marketing spend and sales performance.