
High Performer, Under Target
Diagnosing New York’s Sales Shortfall
Overview
This analysis was conducted to evaluate whether New York’s average total sales per invoice are underperforming relative to the company’s internal benchmark of $500,000. The question emerged as part of the broader goal to identify regional performance gaps that may warrant strategic adjustments, such as resource reallocation, revised sales targets, or enhanced operational support.
The VP of Sales, who oversees multi-city store performance, needs a clear, data-driven view of how New York compares to national expectations. Specifically, the analysis seeks to determine whether the shortfall is statistically significant, how large the performance gap is, and whether the results justify intervention. To support this, the report also explores how New York ranks relative to other cities, whether specific segments or time periods are contributing to the underperformance, and what underlying factors may be influencing these trends.
The findings are intended to help the VP make informed decisions on whether New York’s performance reflects a localized issue or broader structural challenges—and ultimately, to guide action that strengthens regional and national sales outcomes.
Question 1: Is New York’s average total sales per invoice statistically lower than $500,000?
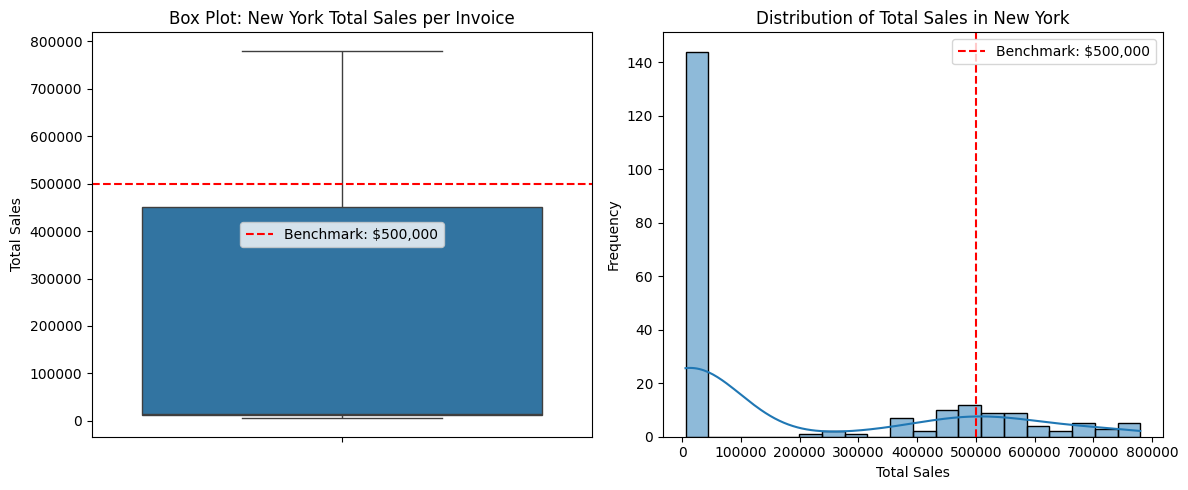
Yes, New York’s average total sales per invoice is statistically significantly lower than the benchmark of $500,000. Based on a sample of 216 invoices, the mean sales value for New York is $184,264.98—roughly $315,735 below the target. The statistical test confirms this result with a p-value of 0, which is well below the significance level of 0.05, meaning the difference is not due to random chance.
Visual analysis supports this finding. A box plot shows that New York’s median and interquartile range lie far below the benchmark line. The accompanying histogram reveals a heavily left-skewed distribution, with most invoice values falling far short of the target. Taken together, the statistical and visual evidence clearly show that New York’s performance is significantly under the expected threshold.
Question 2: What is the size and direction of the difference?
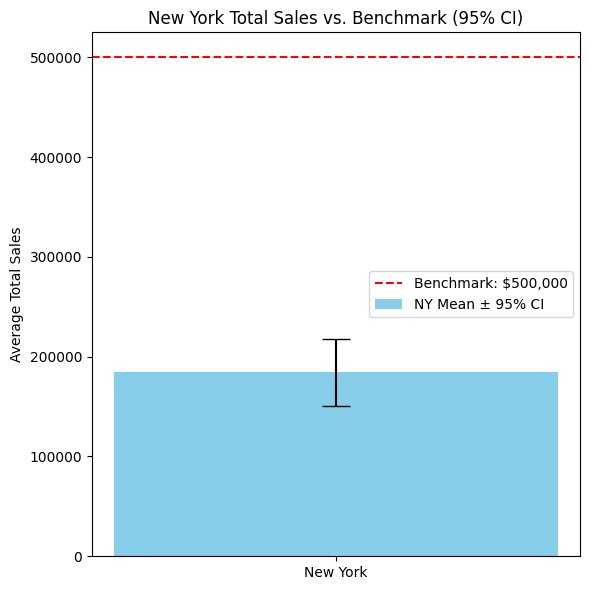
The difference is both negative and substantial. New York’s mean total sales per invoice is $184,264.98, which is $315,735.02 below the $500,000 benchmark. This negative gap is reinforced by a tight 95% confidence interval of $150,464.78 to $218,065.17, indicating the result is not due to sampling variability.
A bar chart with error bars further illustrates this, showing that the entire confidence interval lies well below the benchmark line. This confirms that New York’s underperformance is not only statistically significant but also practically meaningful.
Question 3: Is the performance gap significant enough to justify intervention?
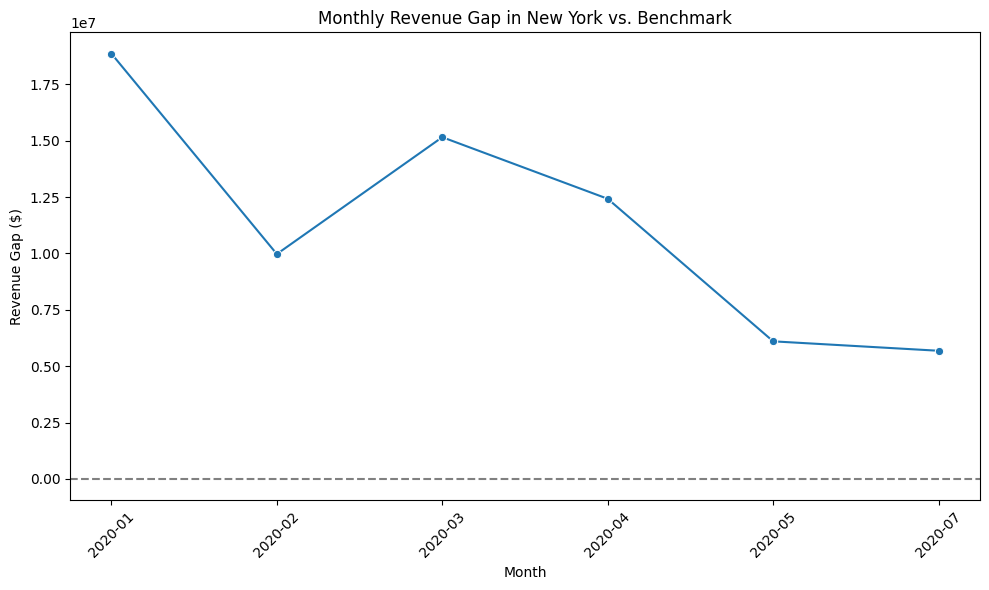
Yes, the performance gap is large enough to require action. Based on 216 invoices, the total expected sales for New York would have been $108 million if it had met the benchmark. However, actual sales amounted to only $39.8 million, leading to a revenue shortfall of $68.2 million.
This also affected profitability. With a 30% expected profit margin, New York should have generated $32.4 million in profit, but actual profits totaled only $13.9 million—a loss of nearly $18.5 million. A line chart of the monthly revenue gap further shows that this shortfall has been consistent over time, indicating a persistent problem rather than a temporary fluctuation.
The scale and persistence of this gap clearly justify revisiting strategy, resource allocation, and operational execution in New York.
Question 4: How does New York’s total sales performance compare to other key cities?
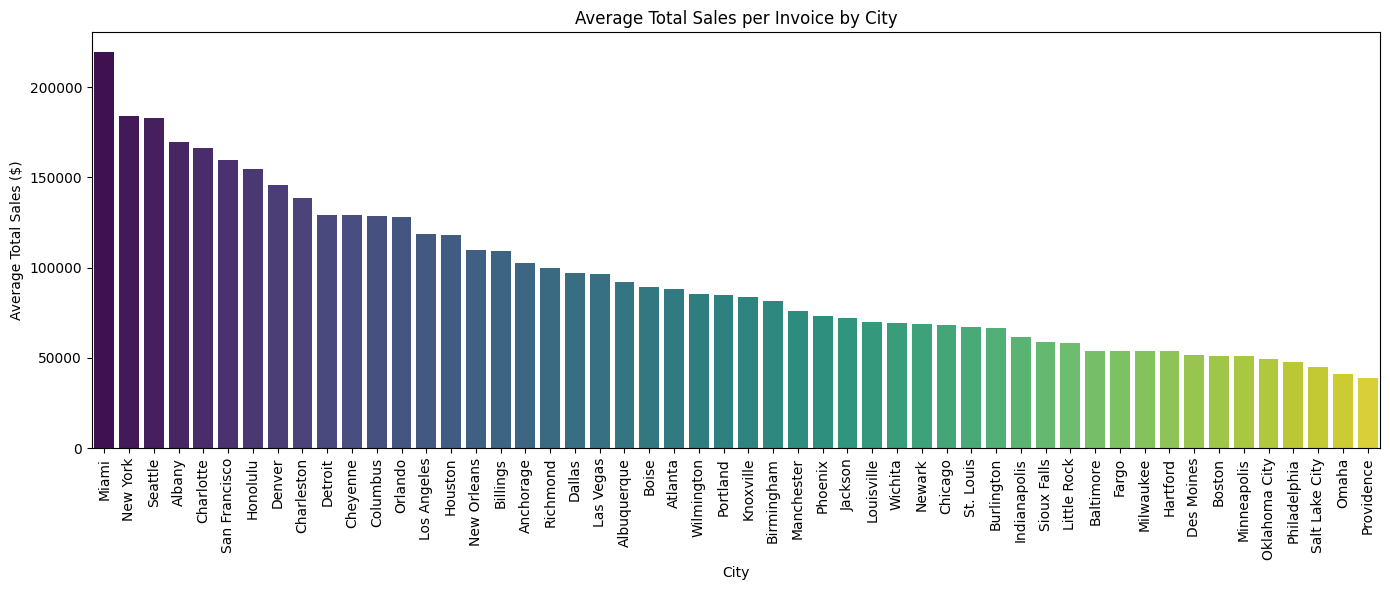
New York performs well when compared to other cities, ranking second in average total sales per invoice nationwide. With an average of $184,264.98 per invoice, it outpaces most peers, including Seattle and San Francisco. However, it still falls significantly below the $500,000 benchmark.
This means that while New York is not underperforming relative to other cities, it is underperforming relative to internal company goals. This discrepancy suggests the need to evaluate whether the $500,000 benchmark is realistic across all regions or should be adjusted based on localized expectations.
Question 5: Are there specific time periods, products, or sales methods driving this performance in New York?
Yes, several segments within New York’s operations contribute to performance differences.
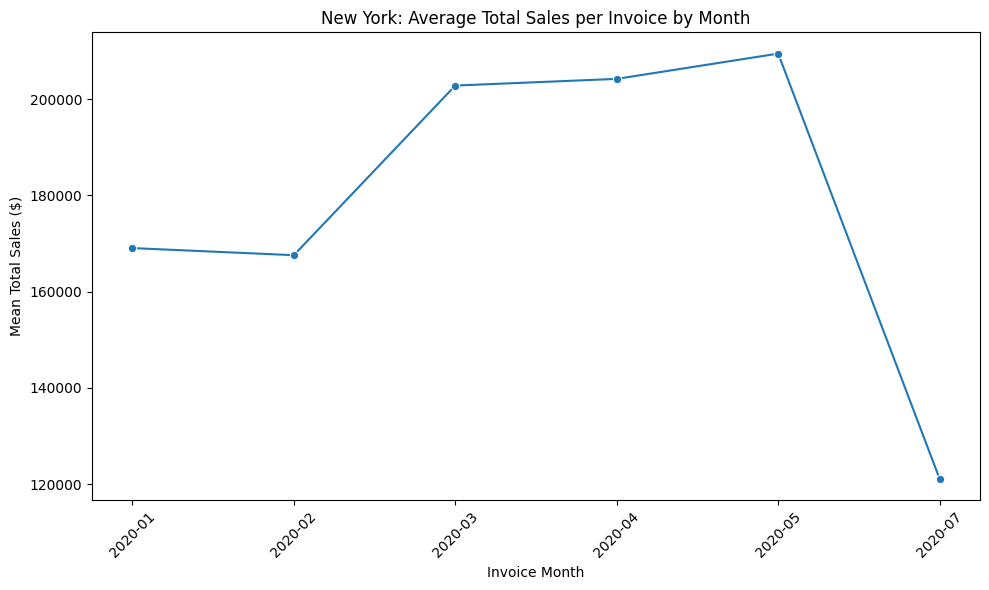
By time period, average total sales peaked between March and May 2020, with values above $200,000, but dropped sharply to $121,000 in July. This indicates stronger performance in Q2 and potential disruption or seasonality later in the year.
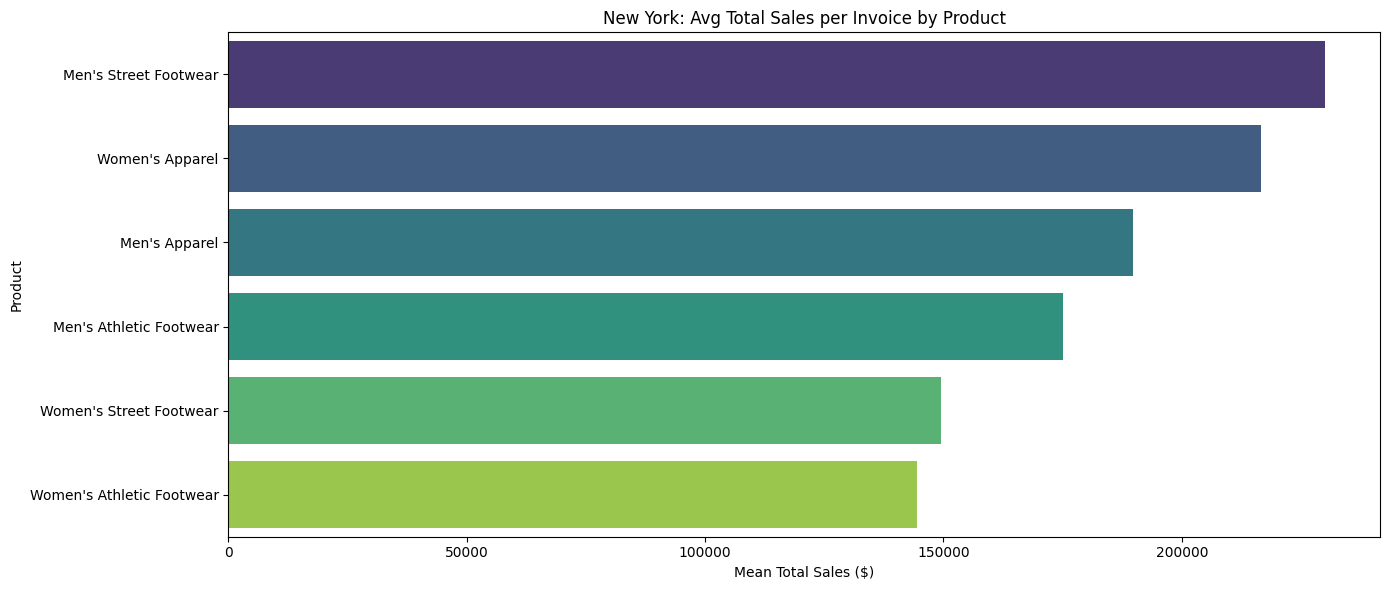
By product, Men’s Street Footwear and Women’s Apparel lead in average sales per invoice, while Women’s Athletic Footwear underperforms. These variations suggest that product mix optimization could help close the performance gap.
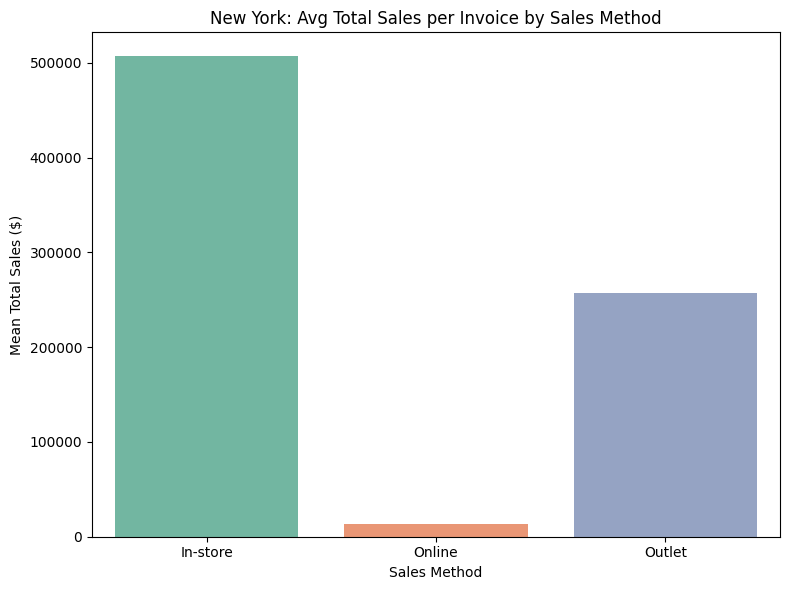
By sales method, In-store sales perform exceptionally well, averaging over $506,000 per invoice and surpassing the benchmark. In contrast, online sales average just $13,560—significantly lower—and likely drag down the overall performance. This points to an opportunity to rethink online channel strategy or shift resources toward more successful in-store models.
Question 6: What factors may be contributing to the performance gap?
An analysis of three key factors—product mix, price per unit, and operating margin—reveals the likely root causes.
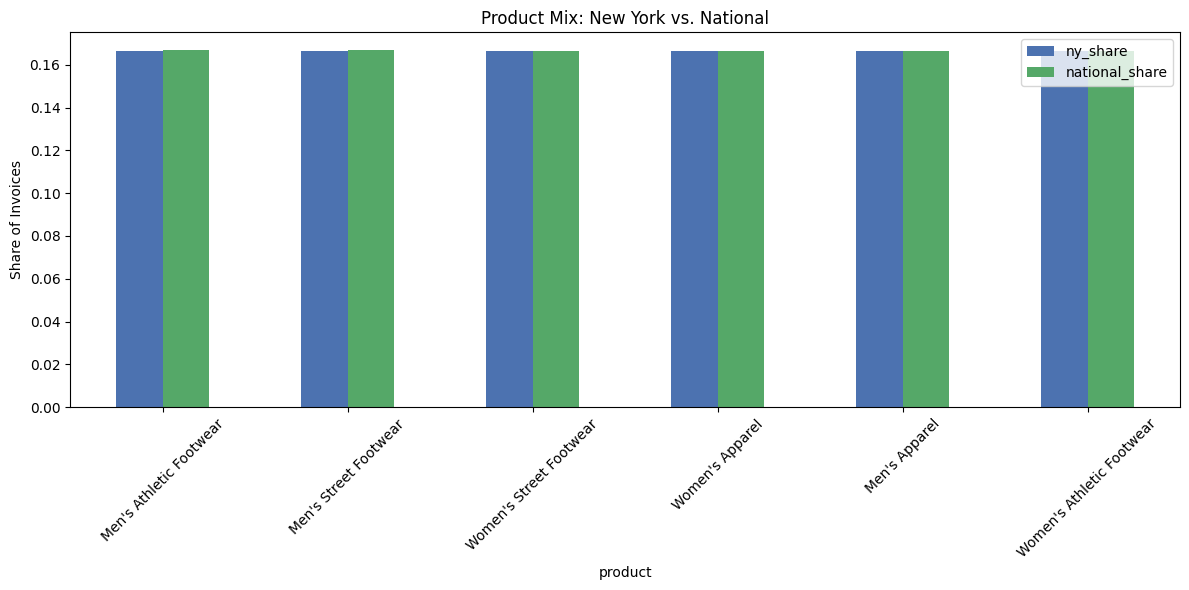
Product mix is consistent between New York and the national average, with no meaningful differences in invoice share across product categories. This rules out mix as a contributor to underperformance.
Price per unit is actually slightly higher in New York ($47.94 vs. $45.15 nationally), indicating that pricing is not a weakness.
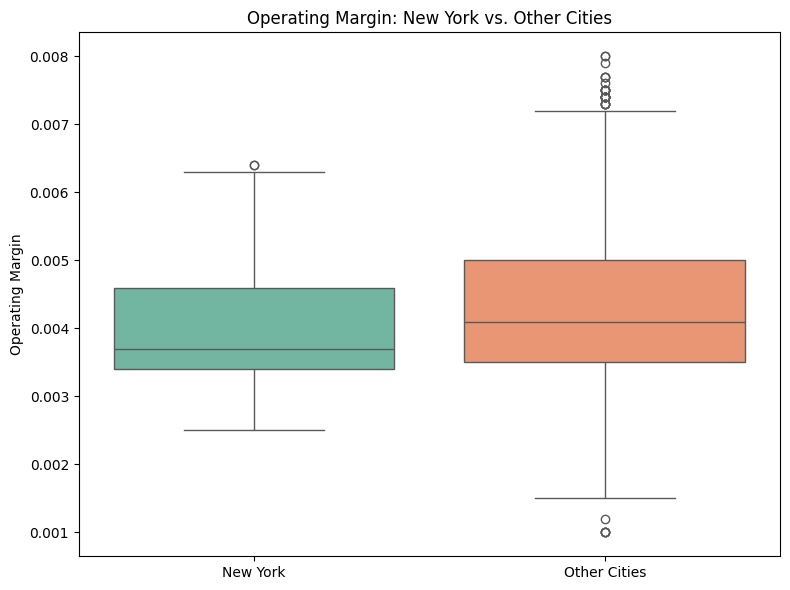
Operating margin, however, appears to be a contributing factor. New York’s average operating margin (0.00396) is lower than that of other cities (0.00424), and the distribution is narrower with fewer high-margin outliers. This suggests efficiency issues or cost-related pressures unique to New York that may be compressing margins.
Improving operating efficiency, examining cost structures, and addressing margin variability could be critical to closing the performance gap.
Conclusion
New York’s average total sales per invoice is significantly below the national benchmark of $500,000—both statistically and practically. With a mean of $184,264.98, the city falls short by over $315,000 per invoice. Statistical analysis confirms this result is not due to chance, with a p-value of 0 and a 95% confidence interval that does not come close to the benchmark.
While New York ranks among the top-performing cities nationwide, this strong relative standing does not translate to meeting internal performance expectations. The revenue and profit losses tied to this gap are substantial and consistent across time, pointing to a structural underperformance rather than a temporary dip.
In summary, New York is not underperforming when compared to peers—but it is significantly underdelivering against company goals. This underscores the need for targeted operational adjustments and strategic evaluation specific to the city’s context.