
Is the Price Right?
A Data-Backed Approach to Buying, Holding, or Waiting
Overview
This analysis offers retail investors a straightforward way to decide whether to buy, hold, or wait on a stock by estimating its fair value using a simple and reliable model. Many individual investors don't have access to professional tools, making it hard to know if a stock is priced too high, too low, or just right. This model fills that gap by using a few key indicators—price trends, trading activity, and market phases—to predict the adjusted closing price with a high level of accuracy.
By comparing the model’s fair value estimate to the current market price, investors can avoid emotional decisions and act with greater confidence. The goal is not to predict every price spike but to provide a realistic picture of how the stock typically behaves—so investors can make better decisions without needing a background in statistics.
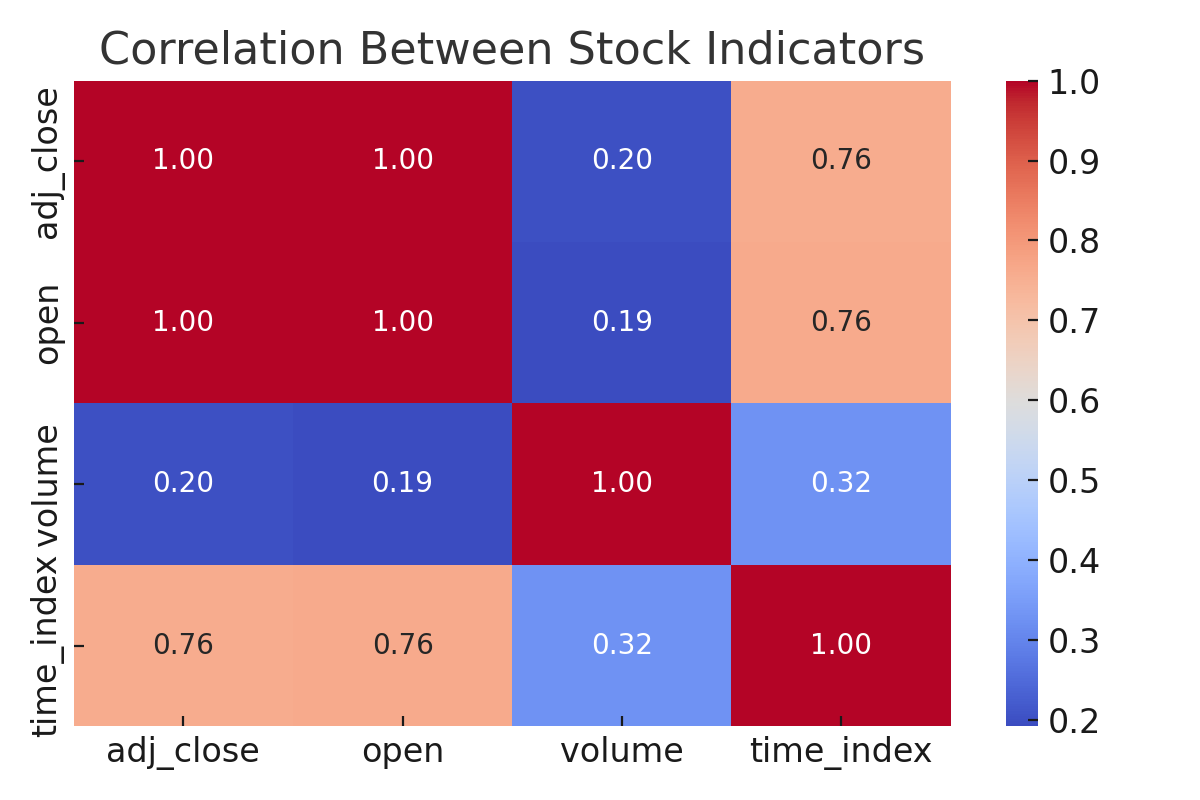
1. Which stock indicators are most closely tied to price?
The model finds that the opening price is the most reliable predictor of where the stock will close, moving almost in lockstep. The time trend also plays a major role, reflecting the stock’s steady upward movement over time. Trading volume, while not as tightly linked to price, still provides useful context—especially during periods of rising or falling investor activity.
Some indicators like open, high, low, and close are so similar that including all of them confuses the model. That’s why we only use open, volume, and time trend—a simple, effective set of inputs that reflect how the stock actually behaves.
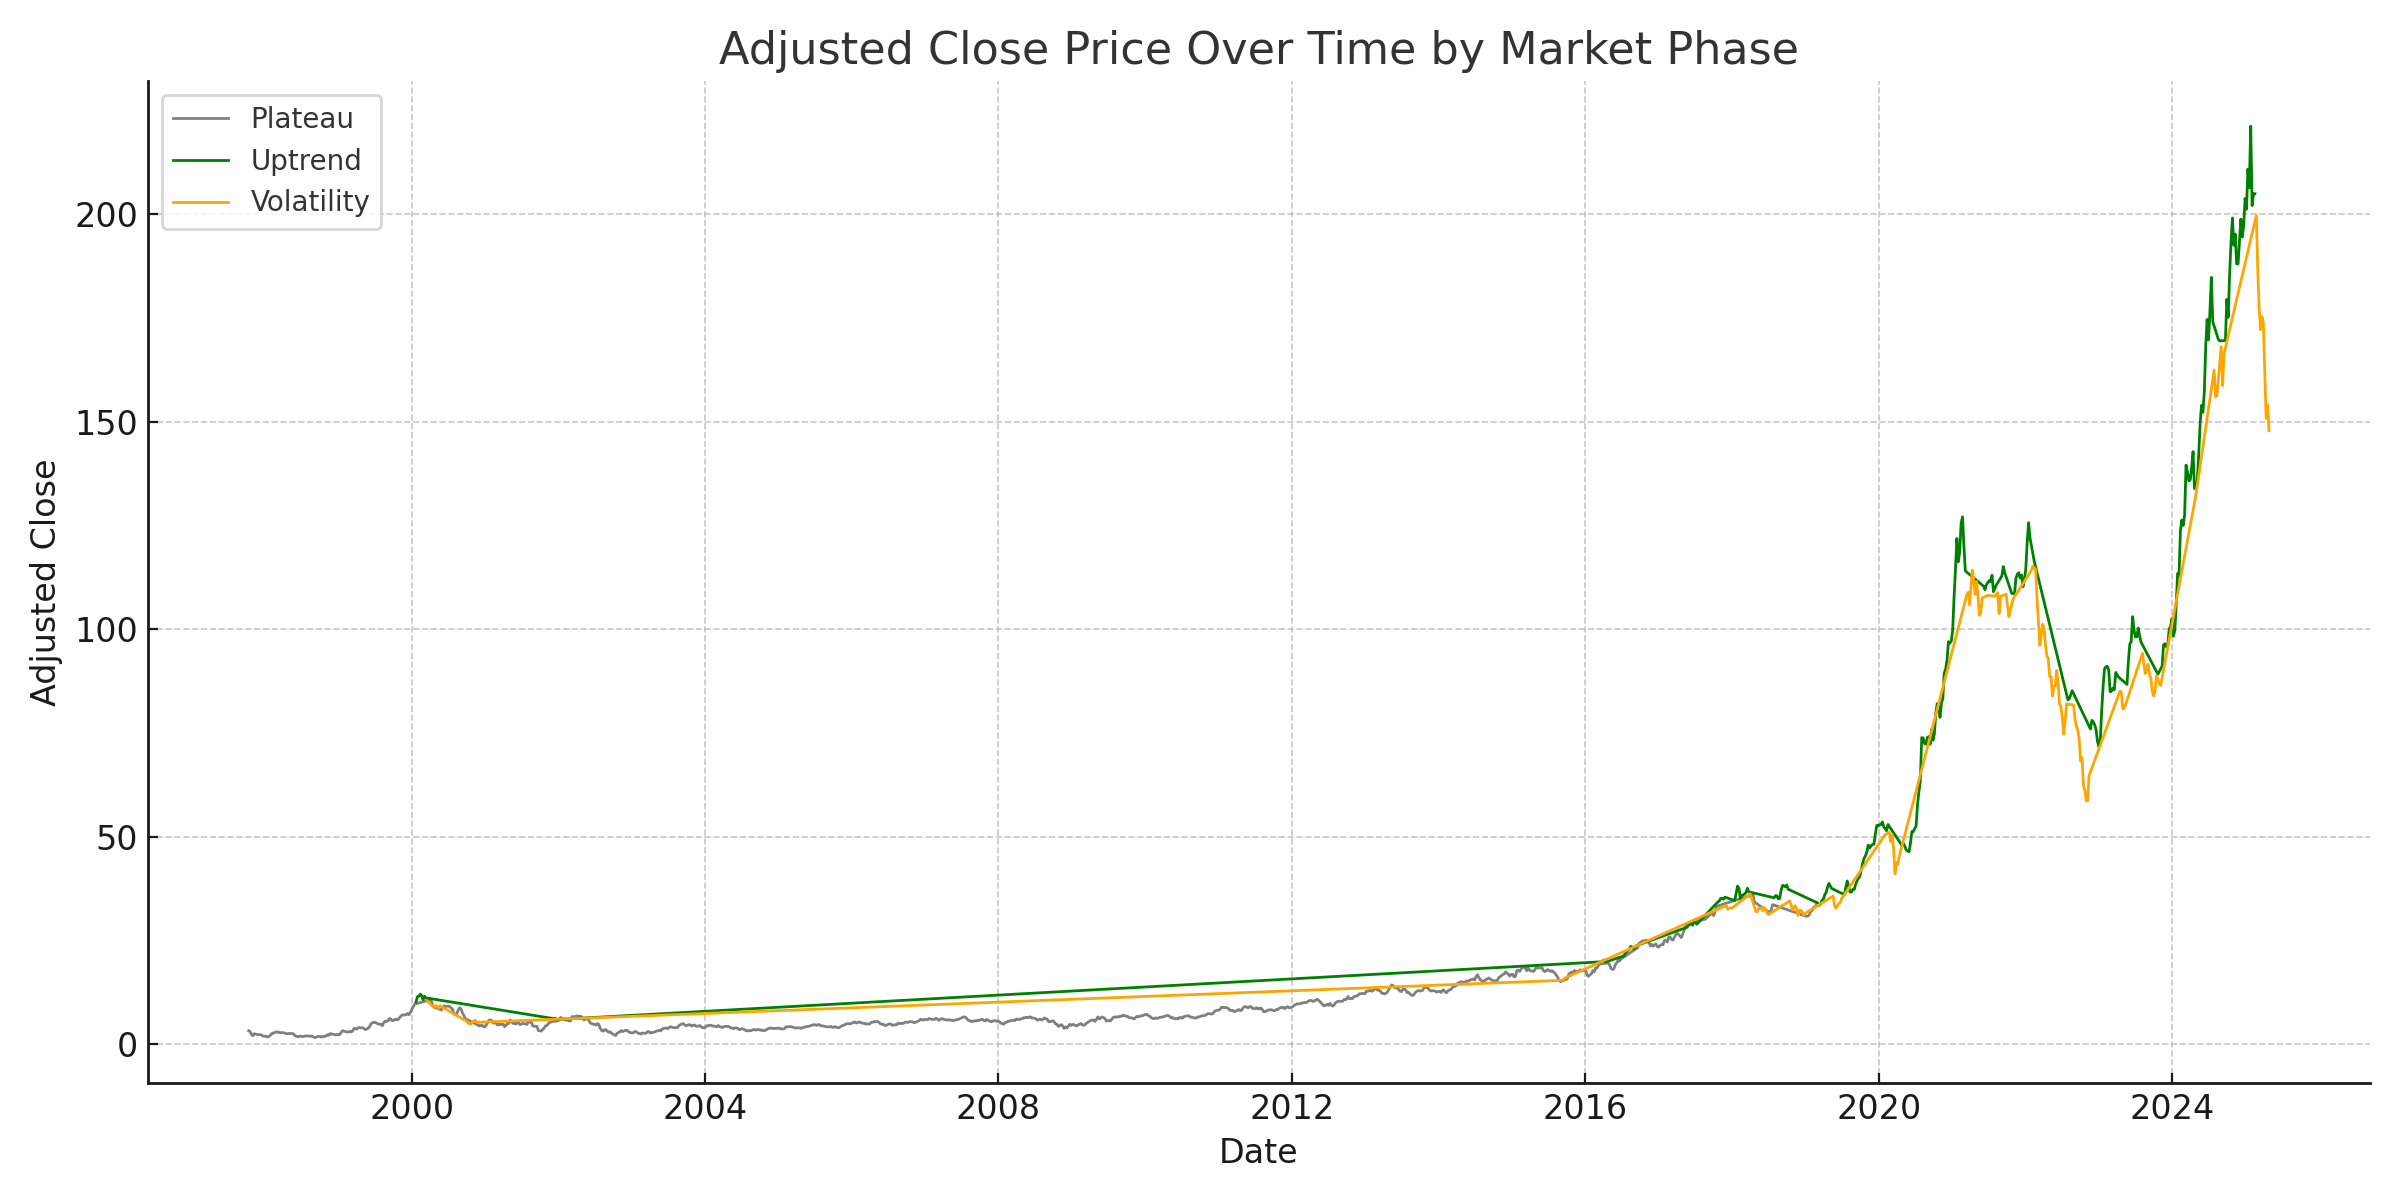
2. Are there predictable patterns in price over time?
Yes, prices tend to follow clear and familiar patterns. When the market is trending upward, stock prices are typically higher. During volatile times—like the 2008 financial crisis or the COVID-19 pandemic—prices often dip but eventually rebound. And in stagnant or uncertain markets, prices tend to move sideways.
We used a 12-week rolling view to identify and label each period as an Uptrend, Volatility Cycle, or Plateau. These patterns were then added to the model to help it understand not just the numbers, but also the mood of the market—making its predictions more realistic and useful.
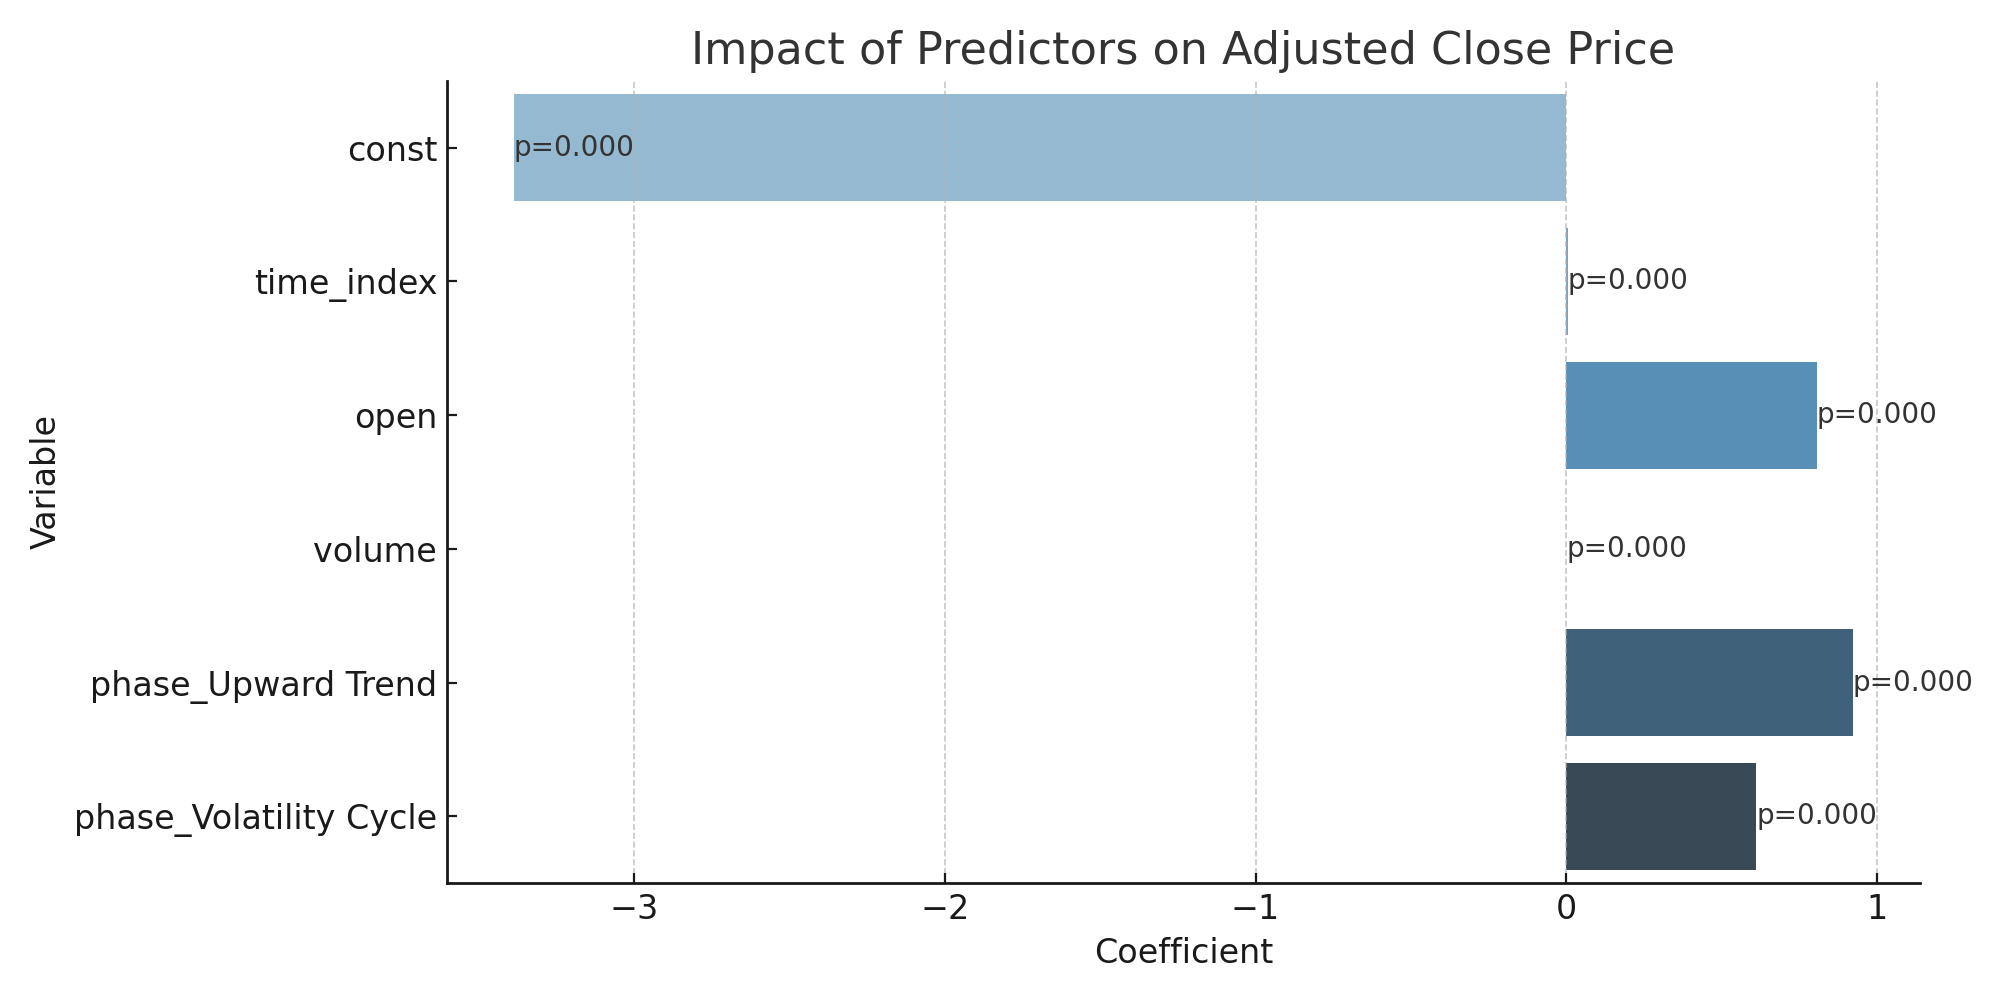
3. Which factors actually matter in predicting stock price?
All of the variables included in the model contribute meaningfully to its predictions. The opening price and time trend are the strongest signals. Volume plays a supportive role, helping reflect shifts in investor behavior. We also added market phase indicators like Uptrend and Volatility, which gave the model better context and improved its accuracy.
None of the inputs were just noise. Each one helped sharpen the model’s ability to estimate where the stock is heading.
4. How can we build and test a price prediction model?
We built the model using real stock price data, week by week. It relies on just a few key inputs: opening price, time trend, volume, and market phase. This simple approach keeps the model both accurate and easy to understand.
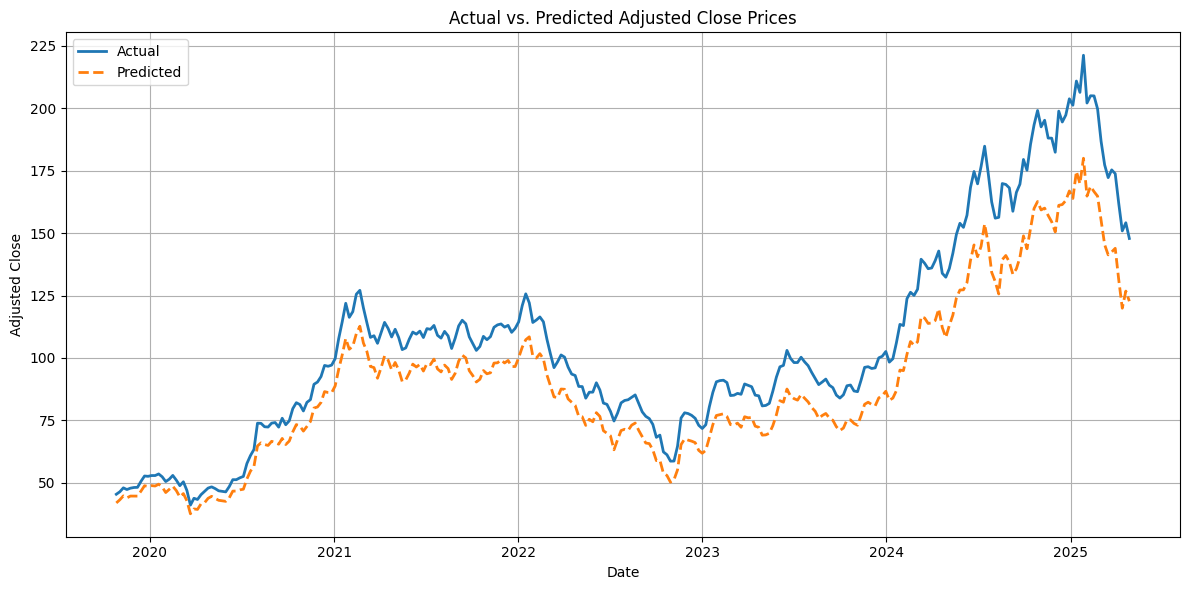
When tested, the model explained nearly 99% of the variation in stock price—a strong result that shows it closely tracks how the stock behaves. It won’t capture every sudden price spike, but it does a reliable job of following the broader trend.
5. What does the model tell us about price trends and events?
The model confirms that stock prices tend to rise steadily over time. Each week adds a small increase to the price, reflecting a long-term upward trend. It also shows that being in an uptrend boosts the price by about $0.92, while a volatile period adds roughly $0.61—likely due to rebound effects after short-term drops.
Interestingly, higher trading volume has a slight downward effect, which may reflect moments when more people are selling or reacting to short-term news. Together, these findings give a fuller picture of what’s driving price changes over time.
6. How can I use this analysis to decide whether to buy, hold, or wait?
The model makes it easy to compare the predicted fair value of a stock with its current market price. For example, the model estimated a fair value of around $123, while the stock was trading at $147—more than 15% higher. Based on that gap, the recommendation was to wait.
The model uses a simple rule of thumb:
- Buy if the stock is priced 5% or more below fair value.
- Hold if it’s within ±5% of fair value.
- Wait or review if the stock is priced more than 5% above fair value.
This gives investors a clear signal based on actual data—not guesswork.
Conclusion
The model predicts stock prices with strong accuracy by focusing on a small set of meaningful inputs. It explains nearly all price movement and closely follows real market behavior. It’s practical, tested, and built specifically to help retail investors make better decisions without needing to understand complex formulas.
By capturing both long-term trends and market events, the model provides a reliable tool for spotting when a stock is undervalued, fairly priced, or overpriced. It’s a practical guide for investors who want to make smart decisions with clarity and confidence.