
Margin or Volume
Which Drives Sales Growth More Effectively?
Overview
This analysis was conducted to help sales managers determine whether to focus on increasing product prices or driving higher sales volumes to boost total revenue. The central question is whether a margin-based strategy or a volume-based strategy has a greater impact on total revenue, enabling more informed decisions on where to allocate effort, promotions, and pricing adjustments. By examining the individual effects of price and quantity on sales outcomes, this report offers evidence-based insights into which lever contributes more effectively to revenue growth.
Using a regression model, the study compares the strength of the relationship between unit price and quantity sold against total revenue. It evaluates which variables are statistically significant, tests how well the model predicts actual revenue, and explores how changes in price or volume influence revenue performance. These insights provide the foundation for prioritizing sales strategies—either by setting targeted pricing for high-margin products or scaling volume-based promotions for more stable growth. The goal is to guide decision-making with practical, data-driven evidence.
Question 1
Which factor—price or quantity—shows a stronger relationship with total revenue, and are they too closely related to each other?
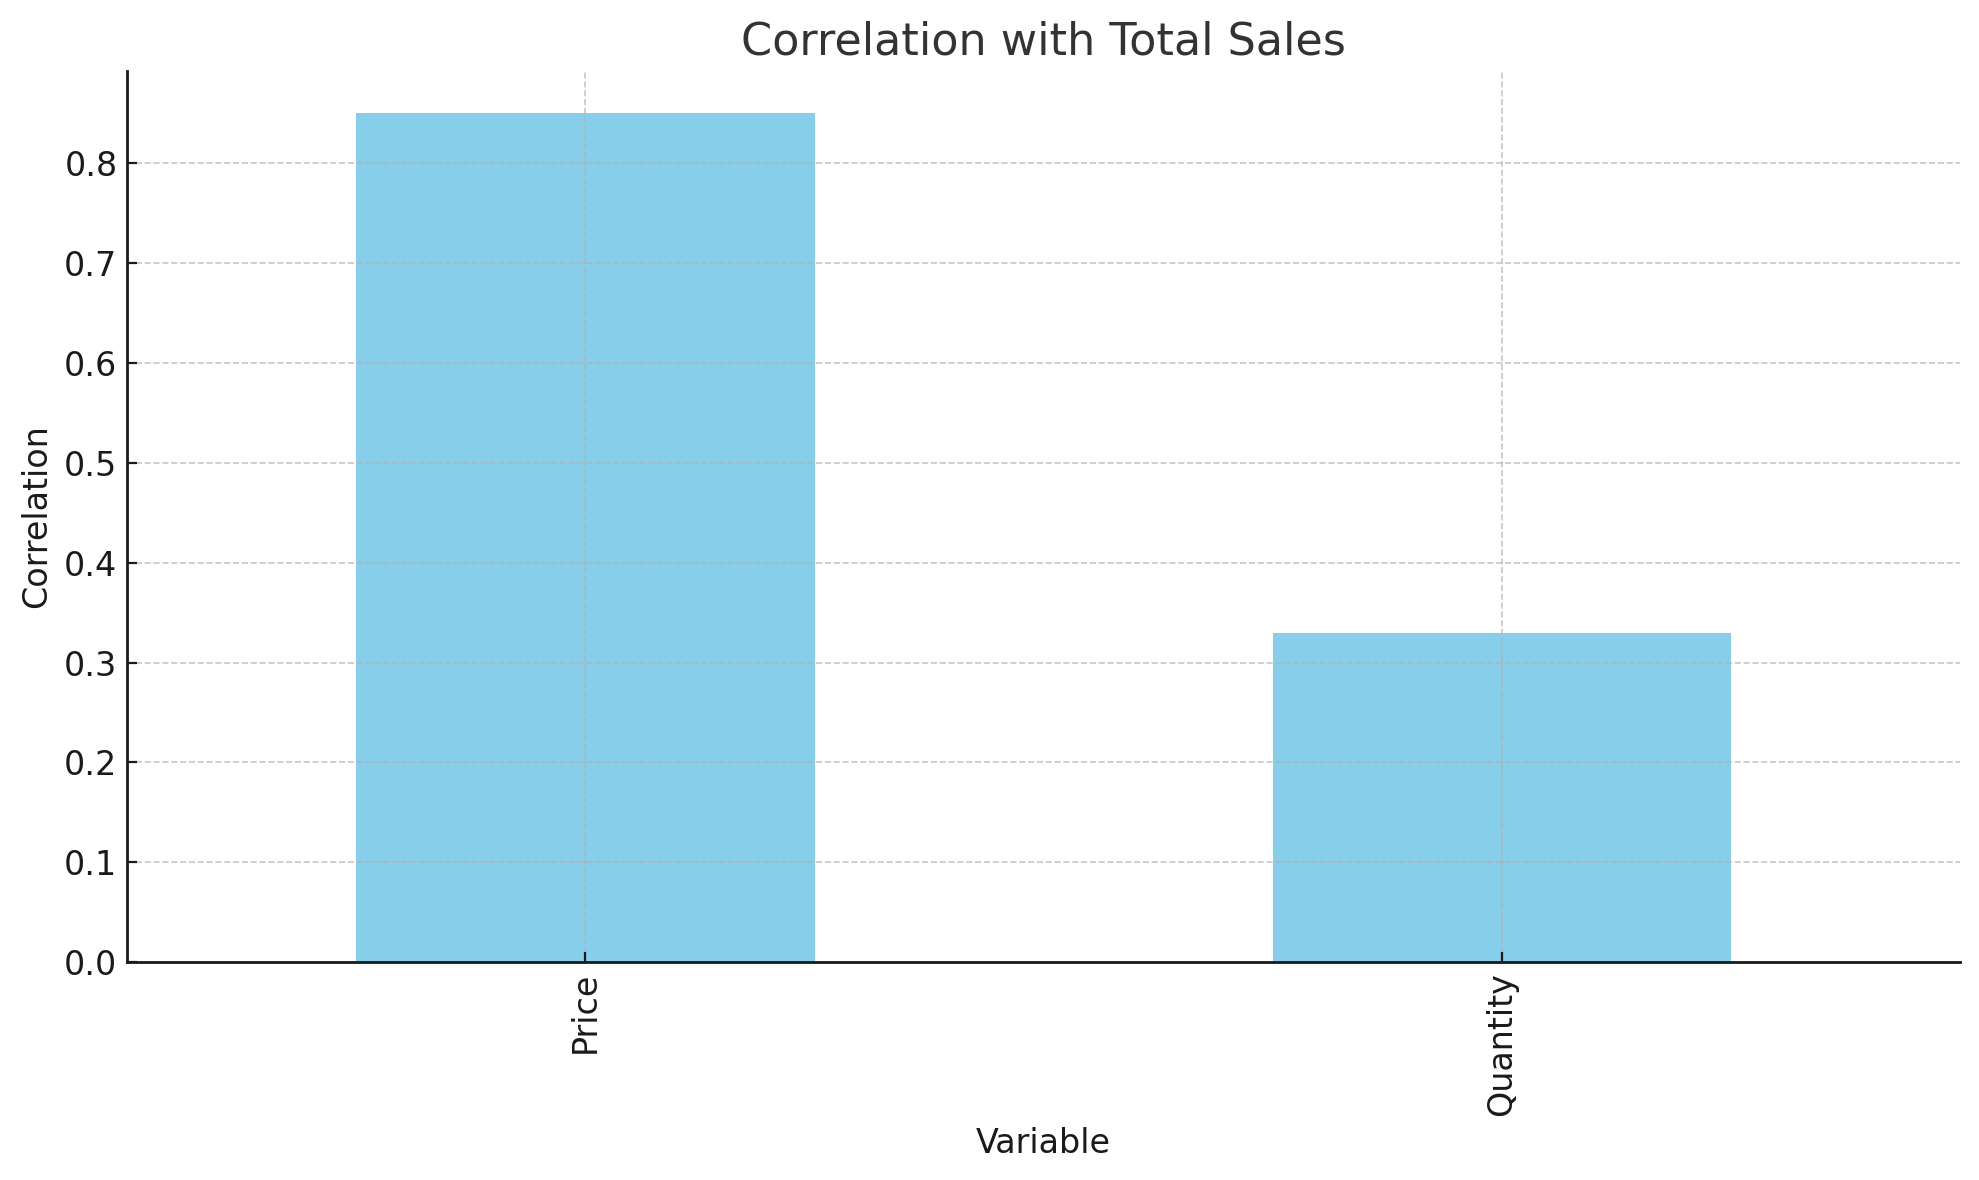
Price shows a stronger relationship with total revenue than quantity. The data reveals a high correlation between price and total revenue (0.85), while quantity shows a moderate correlation (0.33). This suggests that changes in price have a bigger impact on revenue than changes in quantity.
The regression model supports this finding. Although both price and quantity are statistically significant predictors, price contributes more to revenue prediction. Importantly, the two variables are not too closely related to each other, meaning both can be included in the model without introducing multicollinearity or distortion.
Question 2
Which variables are statistically significant for predicting revenue, and should I focus only on those?
The regression analysis shows that both price and quantity are statistically significant for predicting total revenue. Their p-values are well below 0.05, indicating strong and reliable effects.
For practical planning, it is best to focus on these two variables, as they directly influence revenue. Other variables such as payment method or customer location may be useful for segmentation, but they do not meaningfully improve prediction accuracy in this context.
Question 3
What is the formula that predicts total revenue based on price and quantity, and how confident can I be in using it?
The regression equation is:
Total Revenue = 299.28 × Quantity + 2.80 × Price − 840.48
This equation shows the expected increase in total revenue based on changes in quantity and price. Each additional unit sold is associated with an increase of about 299.28 in revenue, while each additional dollar in price adds about 2.80.
You can be confident using this regression model. It explains 83.4% of the variation in total revenue, a strong indicator of fit. Both coefficients are statistically significant, and the confidence intervals are narrow, suggesting reliable and stable estimates.
Question 4
What are the predicted total revenues for each order, and how do they compare to the actual revenues recorded?
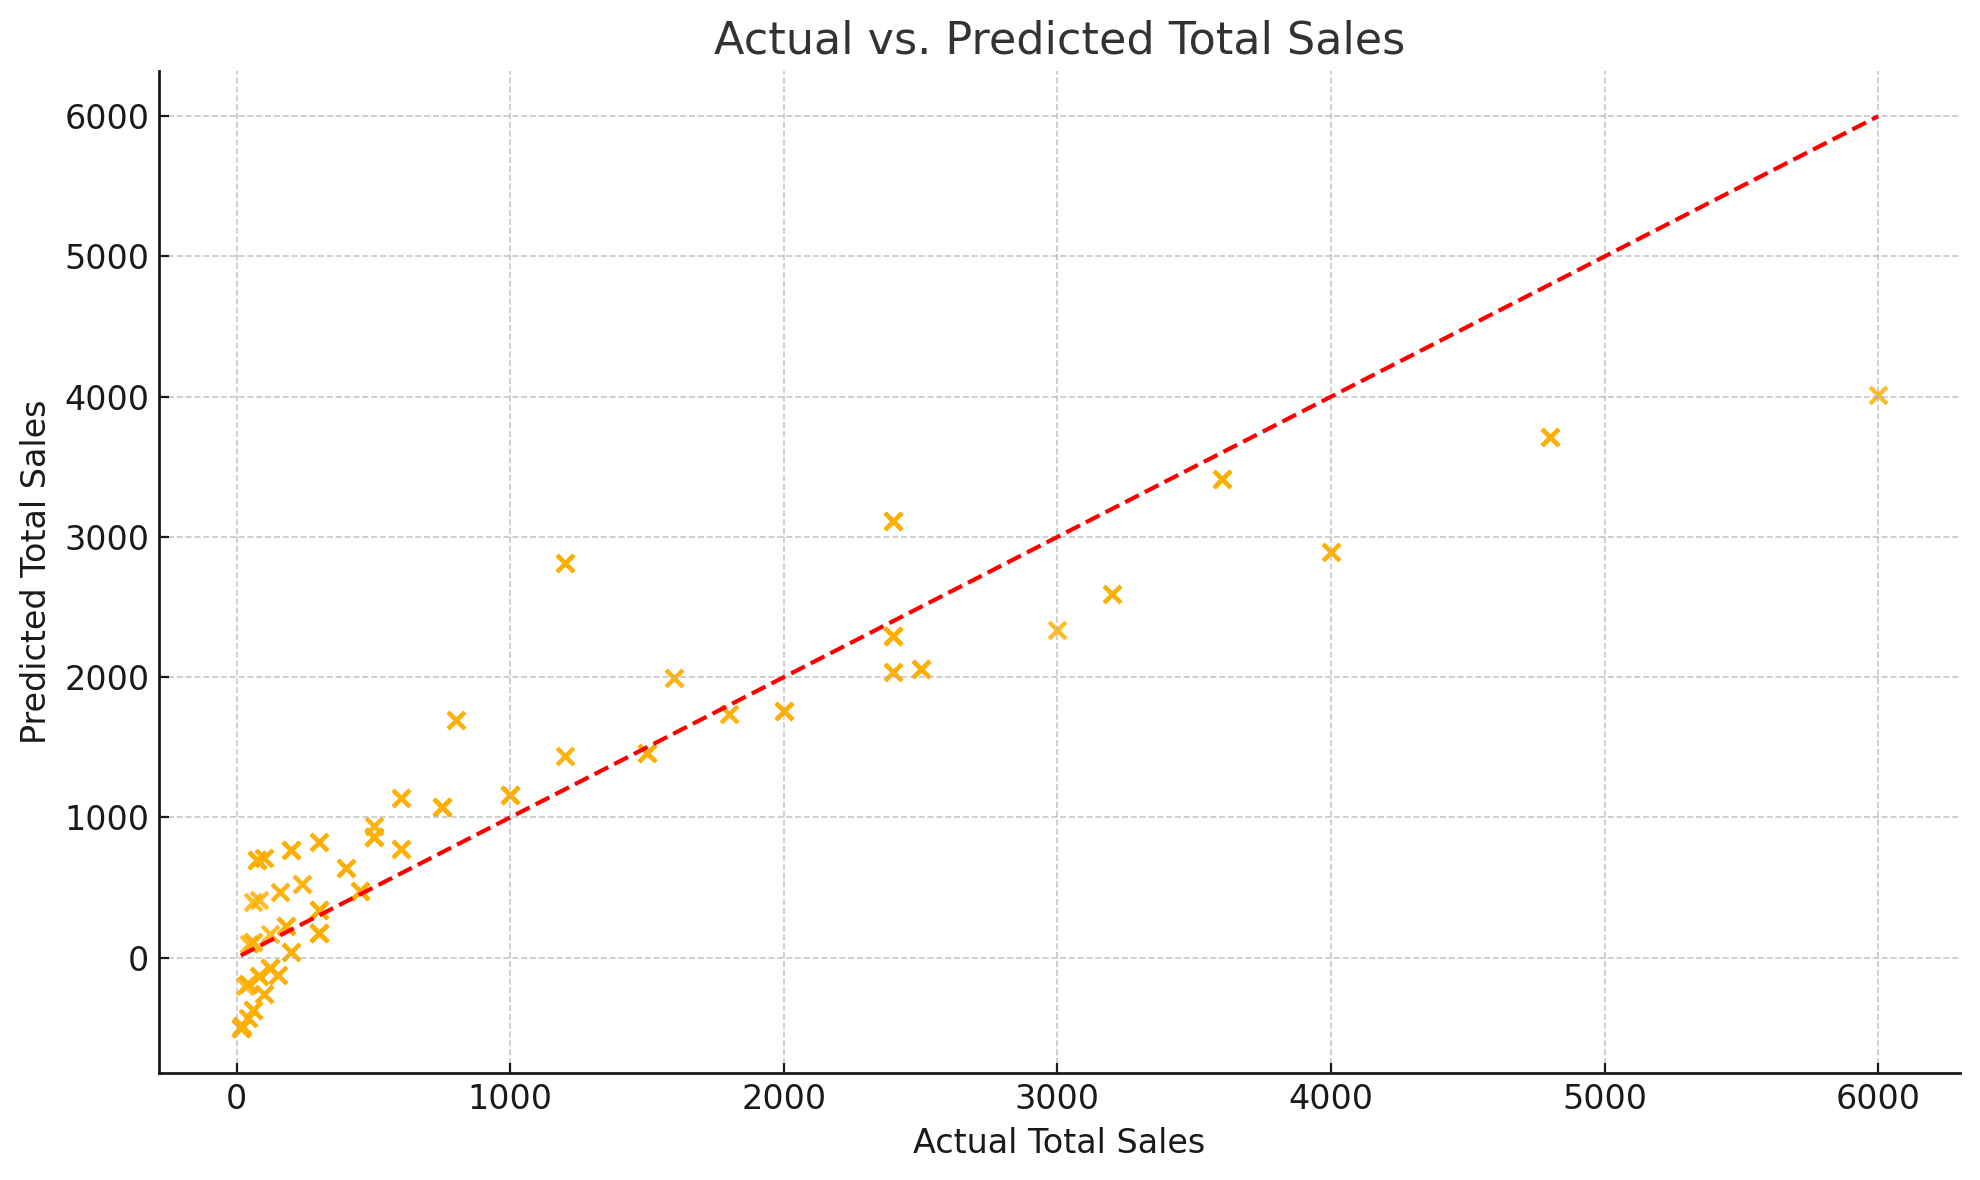
The regression model was applied to 250 orders. On average, predicted revenues closely match actual values, with very low bias. The average residual—the difference between actual and predicted revenue—is near zero, indicating balanced performance across most records.
However, some orders showed larger deviations, particularly at the extreme ends of price and quantity. These outliers may reflect other influencing factors not captured in the model, such as discounts or product type.
Question 5
How much revenue should we expect from orders with the lowest and highest price or quantity, and do these outliers follow expected patterns?
The regression model shows less accurate results for extreme values. For example:
- The order with the lowest price was overestimated by about 230 units of revenue.
- The highest-priced order was underestimated by over 1,600 units.
- The highest-quantity order was underestimated by nearly 2,000 units.
These results suggest that the model underperforms for high-ticket or bulk orders. This may be due to missing features like product categories, discount levels, or nonlinear pricing behaviors that were not included in this version of the model.
Question 6
How would changes in price or quantity—such as a 50% increase or 100% drop—affect total revenue, and which lever has the greater financial impact?
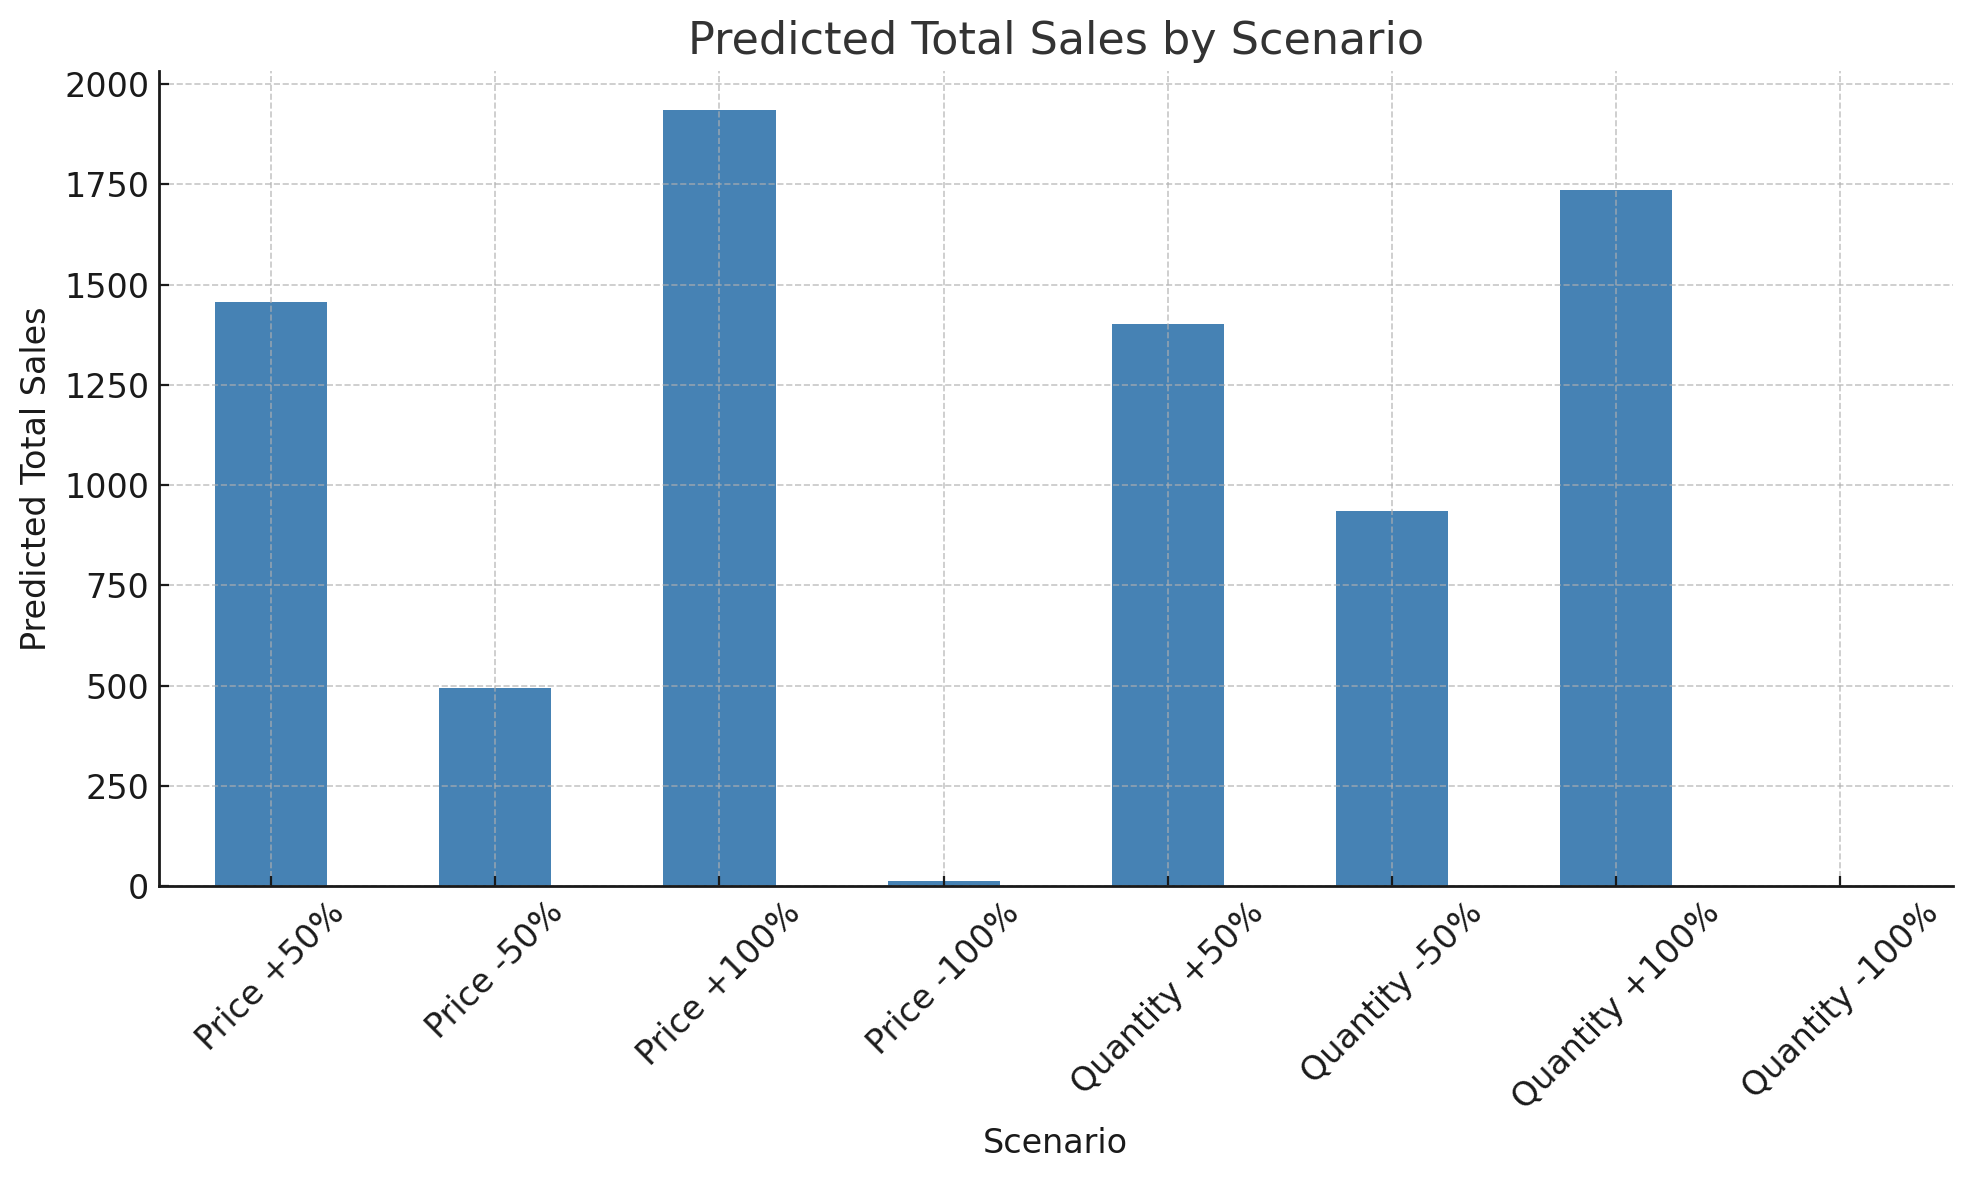
The regression model shows that both price and quantity changes significantly influence total revenue. A 100% price increase results in a revenue gain of 961 units, while a 100% quantity increase results in a gain of 760 units. Conversely, a 100% drop in either price or quantity leads to near or total loss of revenue.
While price adjustments create a larger immediate impact, quantity changes offer more predictable and scalable growth. In practical terms, raising prices may generate short-term gains, but increasing sales volume may lead to more sustainable long-term performance.
Question 7
How accurate is this regression model, and can I trust it for planning future sales strategies?
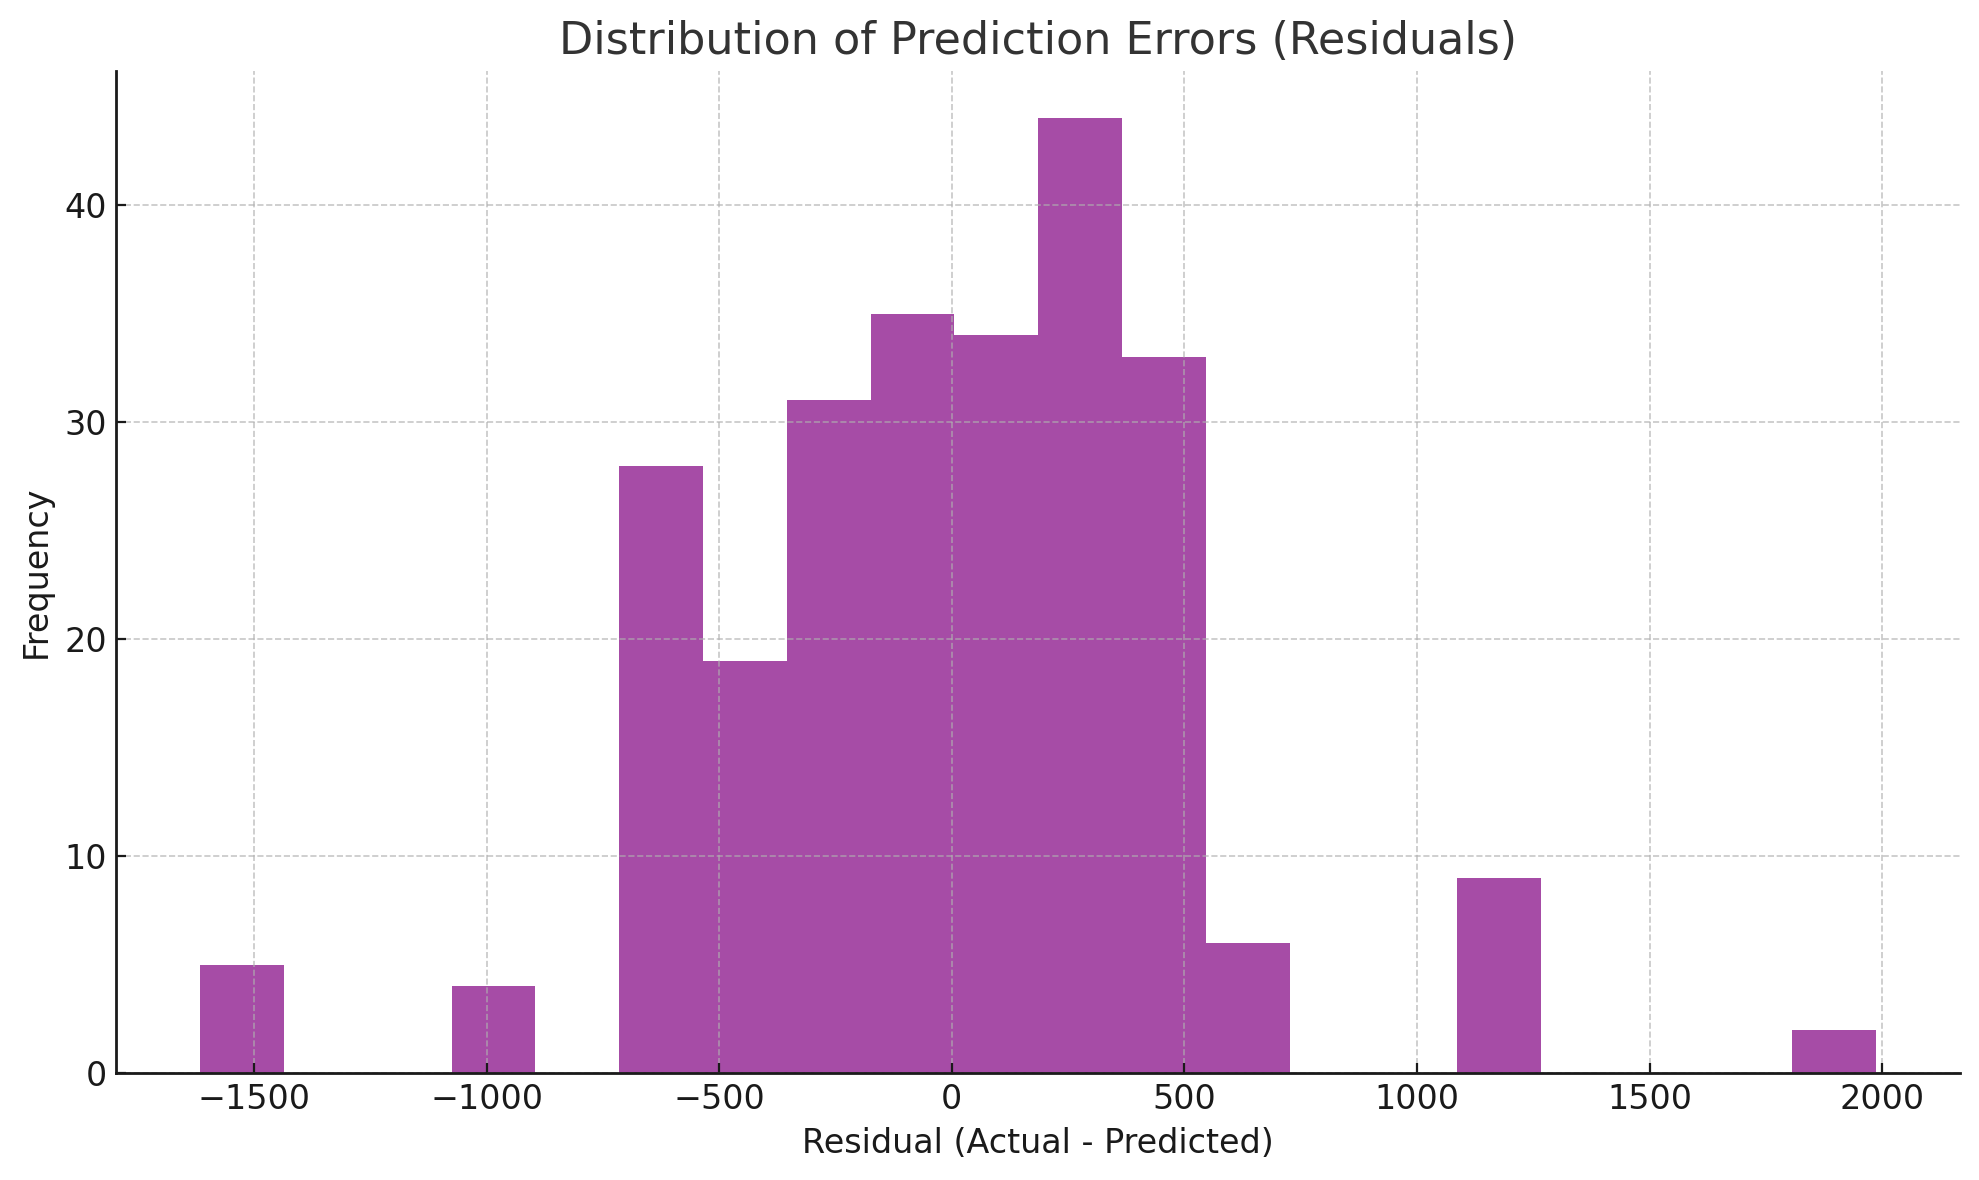
The regression model is accurate enough to support forward-looking sales planning. It accounts for 83.4% of the variation in total revenue, and both price and quantity are statistically significant. Prediction errors are generally small and centered around zero.
The model performs well for standard orders but is less reliable for outlier cases involving very high prices or volumes. These may require model refinement with more variables or non-linear components. Still, the current model provides strong foundational insight for strategic planning.
Conclusion
Pursuing a volume-based strategy is the more stable and scalable path forward, especially when supported by targeted margin enhancements on select products or segments. This hybrid approach captures the strengths of both strategies and is grounded in your actual sales data.
Recommendations
Prioritize volume-driven strategies to support consistent revenue growth, such as bundling, upselling, and multi-unit offers. These tactics take advantage of the strong and stable relationship between quantity sold and total revenue.
At the same time, apply targeted pricing and discounting to strengthen margins where appropriate:
- Set targeted pricing for high-performing or inelastic products—those that maintain demand even at higher prices. Use the regression model to identify where price changes are most effective.
- Design discounts strategically by customer or product segment. Emphasize volume-based discounts (e.g., “buy 3 get 1 free”) rather than general markdowns to maintain profitability while increasing units sold.
- Avoid extreme price adjustments on low-margin or high-variability items. Use small, incremental changes to test customer response and refine pricing tactics.
This combination of scalable volume tactics with selective margin plays provides a balanced, data-driven path for improving total revenue while managing business risk.