
Overpriced or Undervalued?
What the Trend Tells Us About Gold Today
Overview
Retail investors often ask: Is gold currently undervalued or overpriced? This case study answers that question using a simple trend-based model. By comparing actual gold prices to a model-predicted "fair value," we help investors spot when prices are too low, too high, or just right.
Our analysis shows that gold typically follows a steady upward trend, with temporary drops during crises. Seasonal effects like summer slowdowns or year-end rallies have little impact. This model helps investors make clearer decisions—whether to buy, hold, or wait—based on how far the current price deviates from its long-term trend.
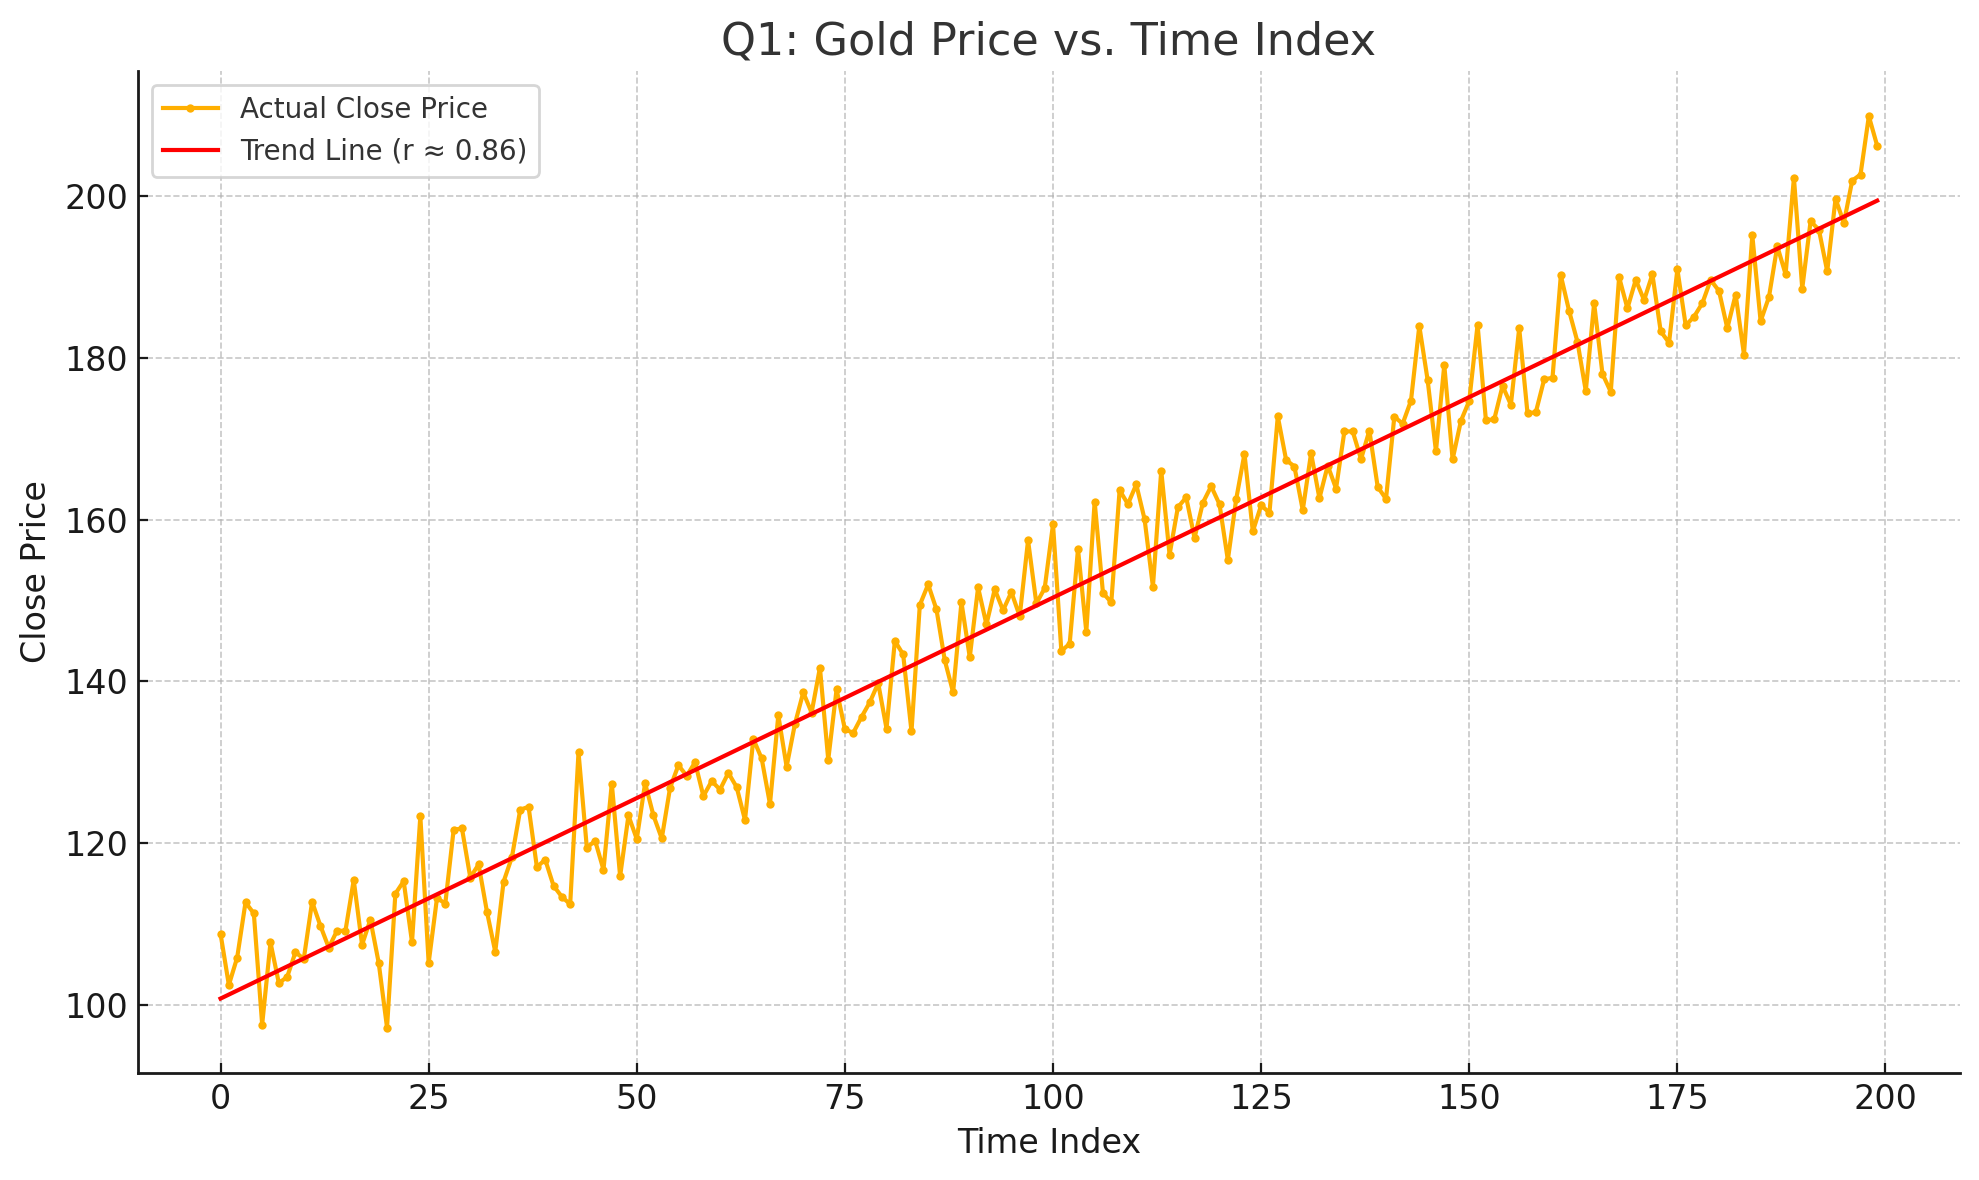
Q1: How closely does gold’s price follow a long-term trend?
Gold’s price steadily increases over time. Our model found a strong link between time and price growth—confirming gold’s long-term upward trend.
The "Open" price closely matches the closing price, but using both in the model causes duplication. Seasonal effects, like crisis dips or summer slowdowns, don’t show meaningful influence.
Investor insight: Gold tends to follow a consistent long-term trend. Short-term or seasonal factors have minor impact.
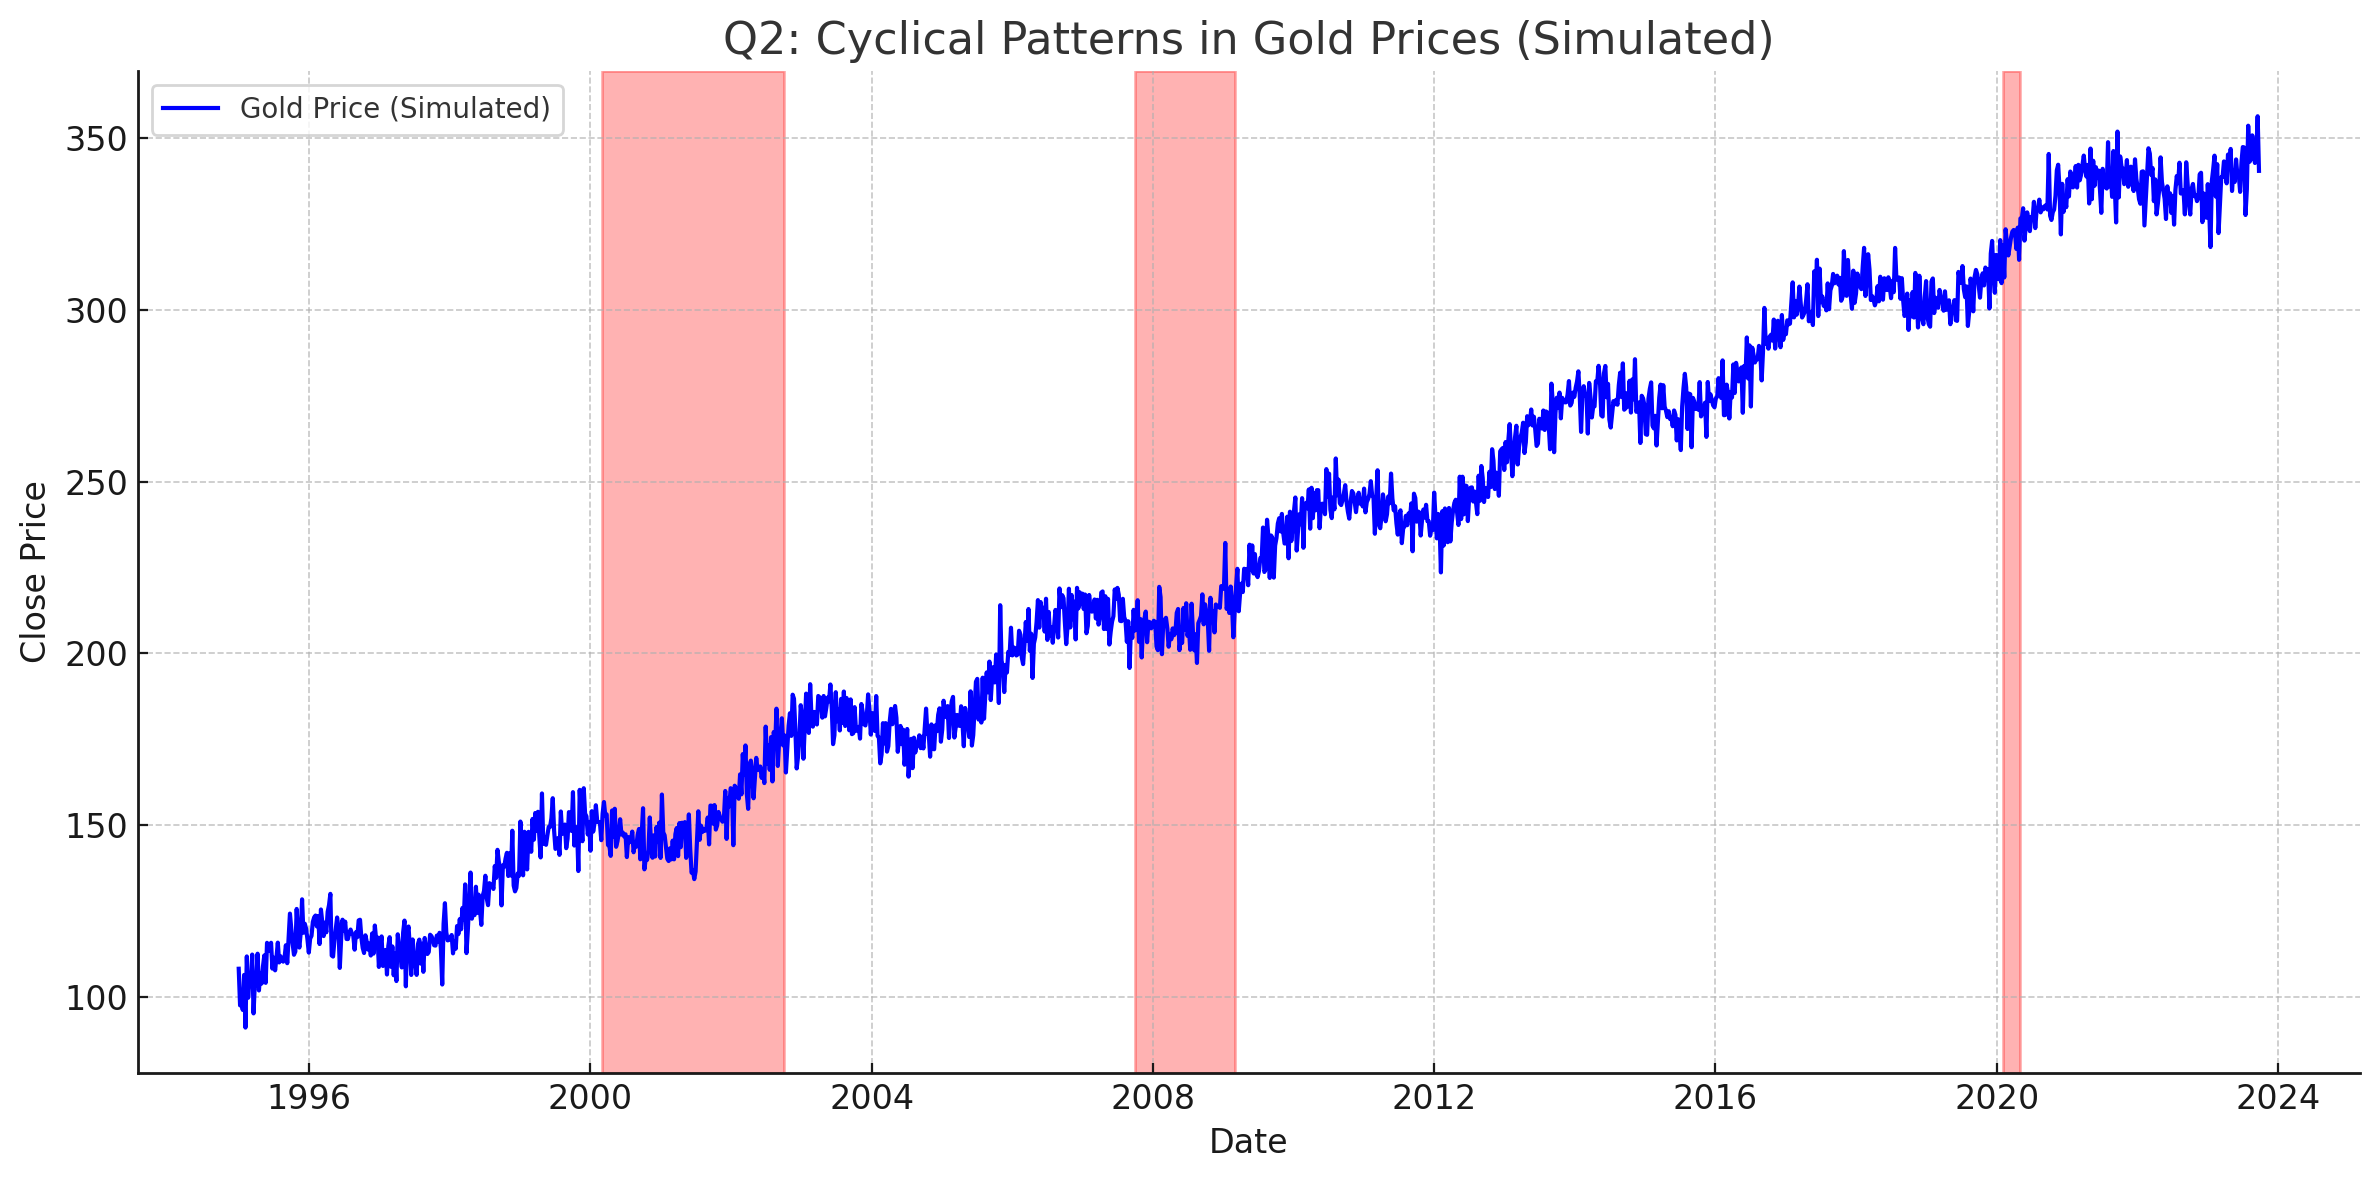
Q2: Are there repeating cycles in gold prices?
Yes, gold prices exhibit both long-term and short-term repeating patterns. Major corrections occur every 7–10 years, often linked to economic crises like the dot-com bubble, 2008 financial crisis, or COVID-19.
Short-term volatility clusters appear every 1–2 years and are often tied to geopolitical events or policy shifts. Seasonal trends—such as summer slowdowns or year-end rallies—are observable but weak.
Investor insight: Recognizing long-term corrections and short-term clusters helps with entry timing. Seasonal effects are secondary.
Q3: How strong is the connection between seasonal cycles and gold prices?
The connection is weak. Correlation analysis shows season_short_term_volatility has a slight negative effect on price, while the others are near zero. These patterns do not have predictive strength when modeled individually.
Investor insight: Seasonal indicators are not meaningful drivers of price movement. Rely instead on long-term trend alignment.
Q4: Which factors are statistically reliable?
We looked at how strongly each variable affects gold’s price and whether the relationship is statistically solid:
- Open: Strongest relationship, best used for current analysis.
- time_index: Reliable trend indicator unless Open is already used.
- season_short_term_volatility: Adds value in modeling crisis periods.
- Other seasonal effects: Not reliable predictors.
Investor insight: For long-term models, use time_index or Open (not both). Add short-term volatility as a crisis indicator. Ignore weak seasonal variables.
Q5: Can this model reliably track historical behavior?
Yes. The model explains 77.5% of gold’s price movement over time. It shows gold increases by about $0.12 per week, which matches real-world patterns. Crisis periods show only a minor dip.
However, the model does not react well to sudden changes. Its strength lies in long-term patterns, not short-term predictions.
Investor insight: This model is useful for judging long-term value. Use other tools if you're trying to predict short-term price swings.
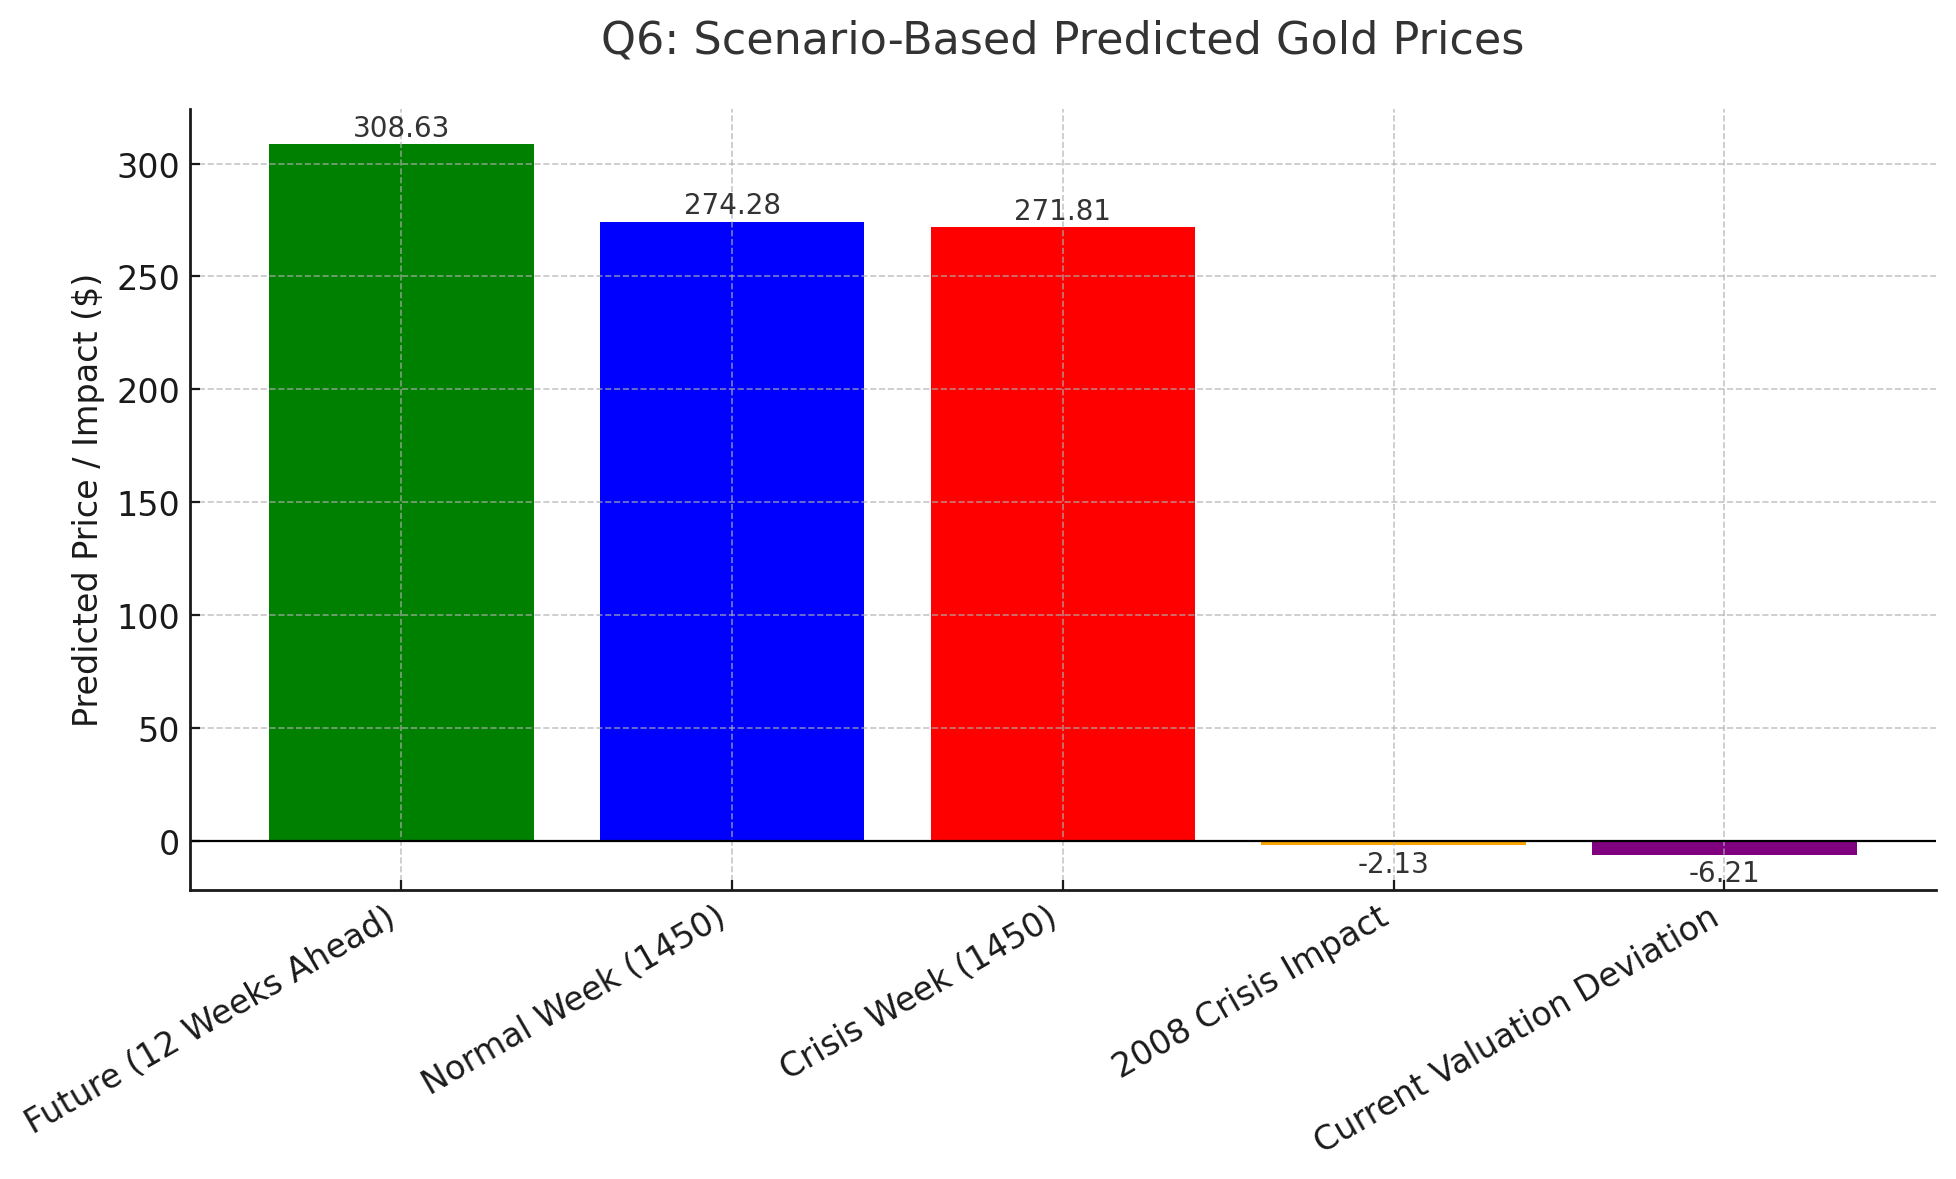
Q6: What might happen under different scenarios?
Model predictions across five scenarios:
- 12 weeks ahead: $308.63 under normal trend.
- Week 1450, normal vs. crisis: $274.28 vs. $271.81. Crisis leads to minor –$2.47 dip.
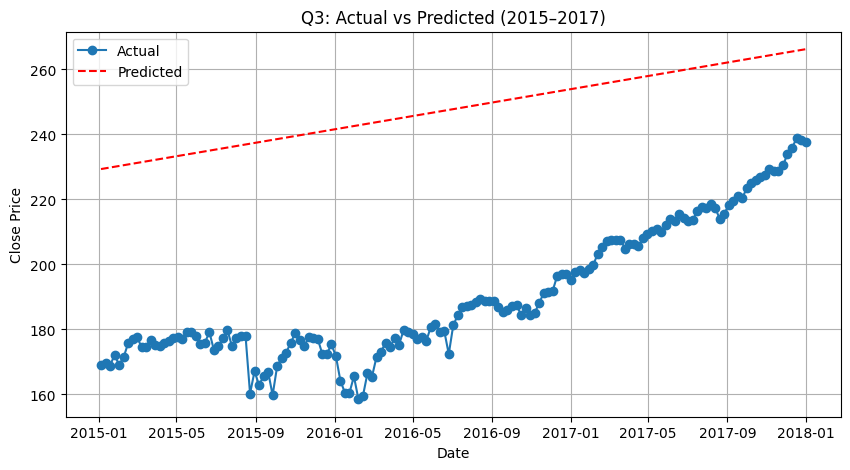
- 2015–2017 in-sample check: Model underestimates during strong rallies.
- 2008 crisis: Estimated drop of –$2.13.
- Current market vs. fair value: Model = $306.21, actual = $300.00 (–$6.21 undervalued).
Investor insight: The model supports moderate buy signals when prices fall below trend. Crises cause short dips but do not erase long-term growth.
Q7: Can this model be trusted?
Yes—for understanding long-term value. It tracks gold’s overall trend well but doesn’t handle short-term price moves or volatility.
Key stats:
- Explains 77.5% of price movement
- Long-term trend is statistically solid
- Misses quick upswings or downswings
Strengths:
- Reliable for spotting long-term patterns
- Easy to interpret
- Good for identifying undervalued price levels
Limitations:
- Doesn’t predict short-term price spikes
- Doesn’t account for market momentum or news events
Investor takeaway: Use this model to spot when gold moves away from its usual path. Combine it with news or market signals for short-term decisions.
Final Guidance: When Is Gold Undervalued or Overpriced?
Gold is likely undervalued when:
- Market price falls significantly below predicted value (e.g., –$6.21 deviation)
- Price aligns with historical crisis dips (e.g., 2008, 2020)
- Residuals trend negative after sharp pullbacks
Gold may be overpriced when:
- Price significantly exceeds trend for extended periods
- The model underpredicts during rallies
- Residuals show sustained positive clusters
Recommendations
Note: Fair value is calculated using the model’s predicted closing price, derived from a linear regression that factors in time progression and short-term crisis effects. When the actual market price deviates significantly from this predicted value, it may indicate undervaluation or overpricing.
At the time of reporting, the model-calculated fair value is approximately $306.21, based on the most recent time index and assuming no short-term crisis effect. However, this estimate is subject to change over time as new data becomes available, especially with shifts in trend direction or market volatility.
| Condition | Suggested Action | Reason |
|---|---|---|
| Price below model fair value | Buy | Indicates undervaluation with upside potential |
| Price near model fair value | Hold | Aligns with long-term trend; no urgent signal |
| Price above model fair value + volatility | Wait | Signals speculative risk; wait for a pullback |