Patterns Behind the Price
What Microsoft’s Stock Can Teach You About Long-Term Investing
Overview
This case study examines Microsoft’s adjusted closing price to help retail investors understand how the stock behaves over time and what factors influence its weekly movement. It focuses on identifying consistent price trends, the impact of market events like the Dot-com crash, the Global Financial Crisis, and COVID-19, and the role of predictors such as the stock’s opening price and time.
By applying a multiple linear regression model, the study uncovers long-term growth patterns, short-term cycles, and the effect of economic shocks. The goal is to provide investors with practical insights to support buy, hold, or sell decisions—whether evaluating when to enter the market, estimating the potential impact of a downturn, or judging the strength of a recovery.
1. Has Microsoft’s stock price been rising steadily over time, or is it just random?
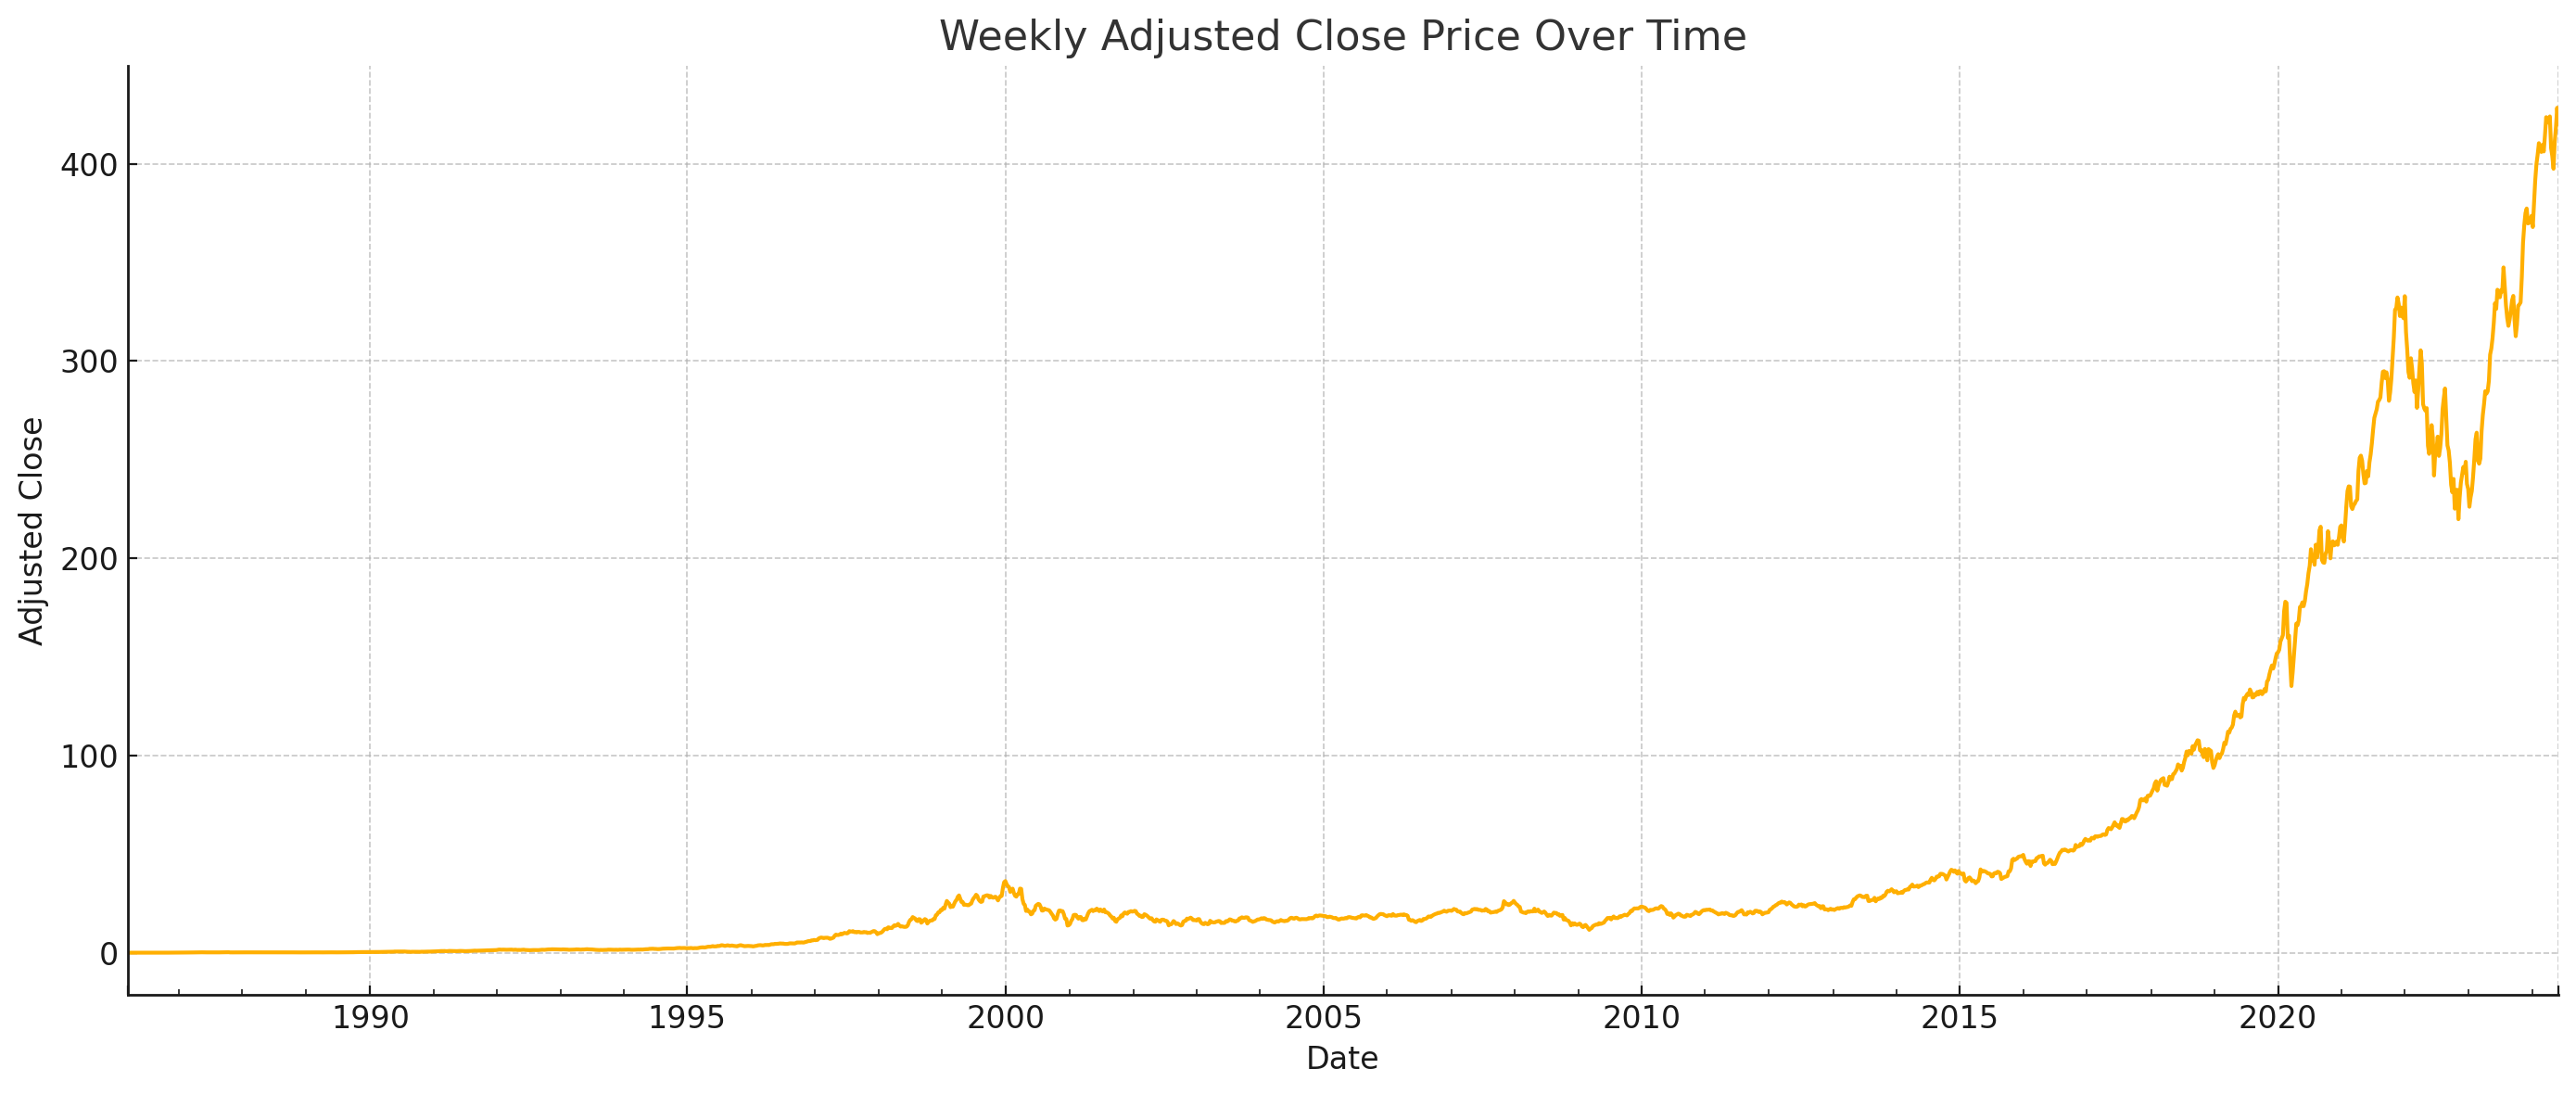
Microsoft’s stock price has shown a steady upward trend rather than random movement. The correlation between adjusted closing price and time index is 0.705, indicating a moderately strong relationship. This suggests the stock has generally grown in value over time.
What this means for investors:
The long-term trend supports confidence in holding Microsoft stock. Investors can use price dips as potential buying opportunities, knowing that historical patterns show consistent recovery and growth.
2. Do Microsoft stock prices follow any repeating patterns, like cycles where it tends to go up or down?
Yes, Microsoft’s stock follows recognizable patterns. It has a clear long-term growth trend, especially post-2010. In addition, it experiences cyclical fluctuations every 1 to 2 years and reacts sharply to external shocks such as the Dot-com crash (2000–2002), Global Financial Crisis (2008–2009), and COVID-19 (2020).
What this means for investors:
Those with a long-term strategy benefit from staying invested through growth cycles. For short-term investors, identifying 1–2 year waves offers timing opportunities. Recognizing these patterns also helps manage risk during periods of market uncertainty.
3. Can we measure how much crisis periods like COVID or Dot-com affected Microsoft’s price?
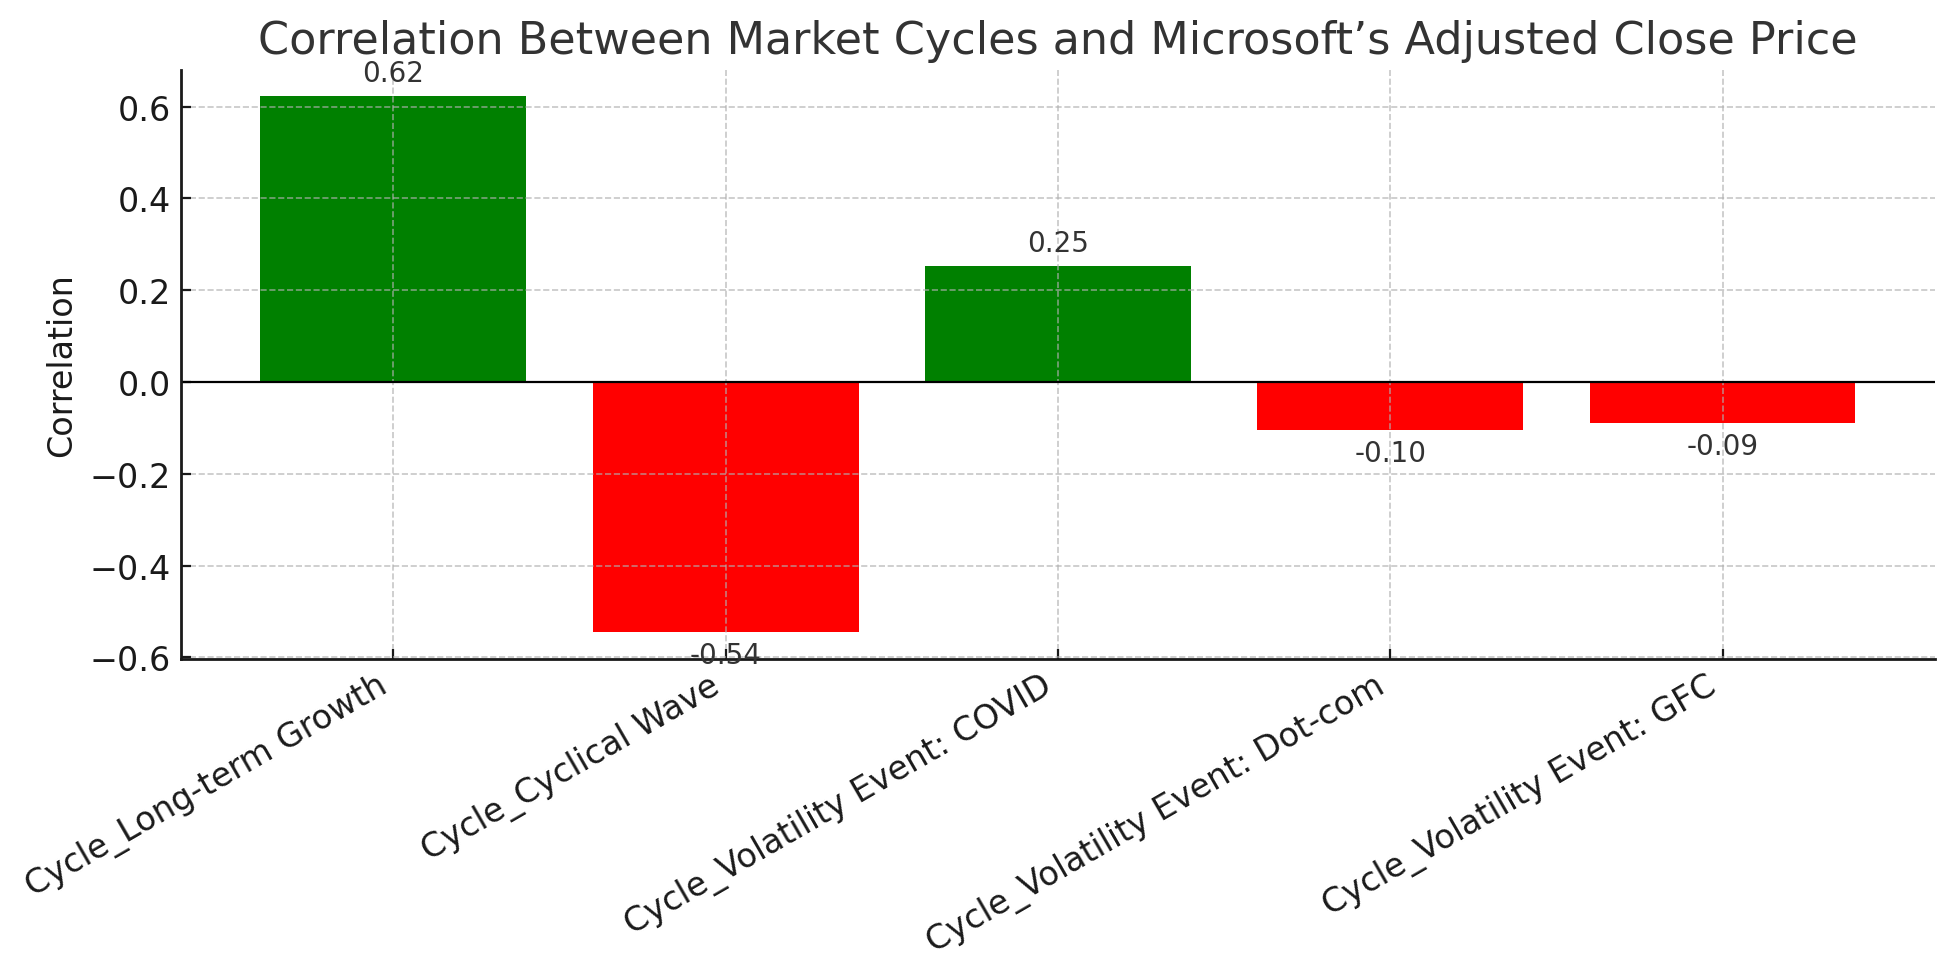
Yes. Long-term growth phases show a strong positive correlation with price (+0.622), while cyclical waves show a moderate negative correlation (–0.544). The COVID period had a weak positive effect (+0.253), and the Dot-com and GFC periods had small negative effects (–0.105 and –0.089, respectively).
What this means for investors:
Microsoft’s price has dipped during crises but recovered quickly. This history suggests resilience and reinforces the case for holding through downturns, rather than reacting to short-term fear.
4. Which factors matter most when predicting Microsoft’s stock price?
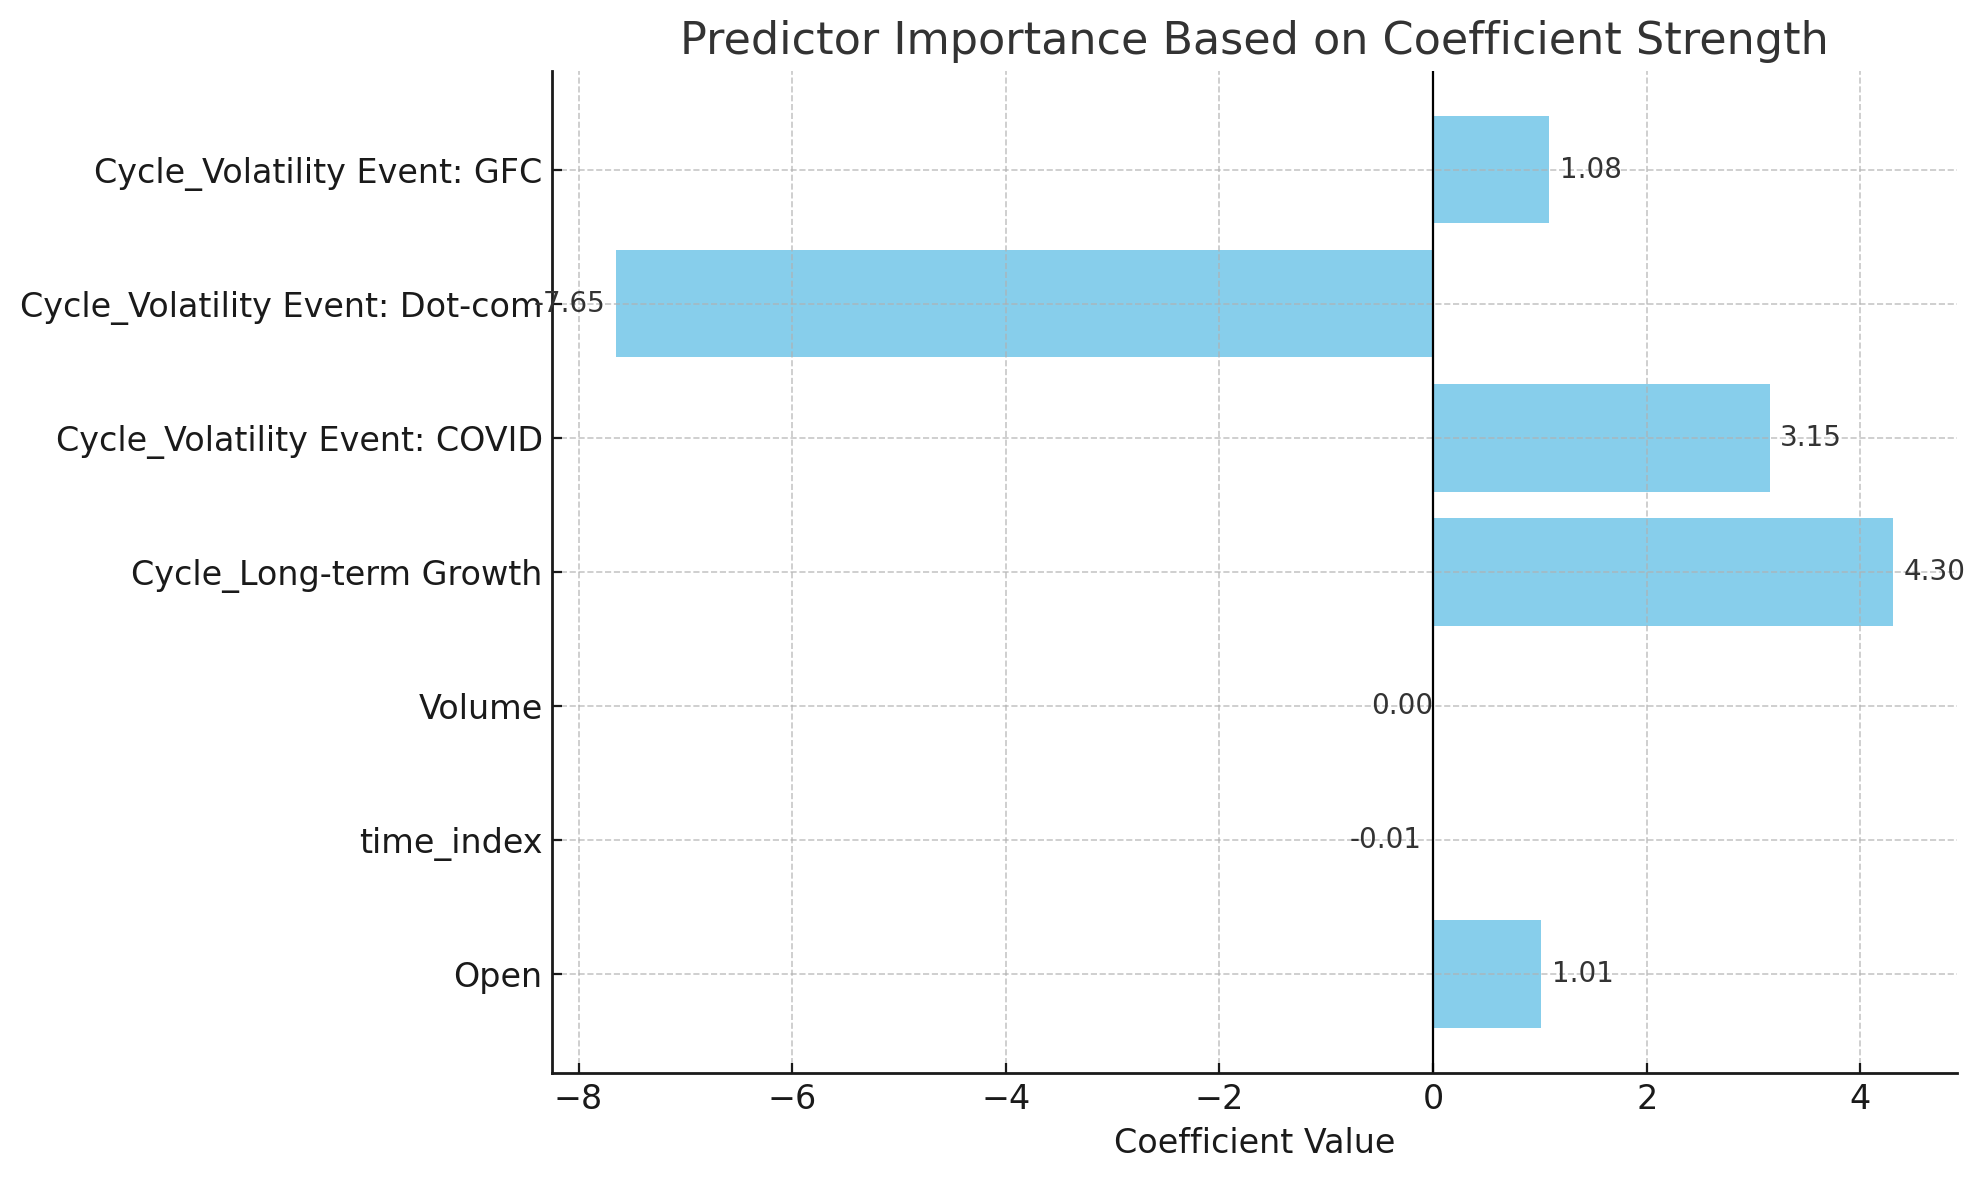
The most important predictors are the Open price, time index, and market cycles. For instance, the Open price has a coefficient of 1.013 and a p-value of 0.000, making it the strongest daily indicator. Volume, with a p-value of 0.145, has no meaningful impact.
What this means for investors:
Watch the Open price closely, as it’s a strong signal of where the stock may close. Time and known market cycles also influence price movement. Volume, however, can be ignored when making investment decisions.
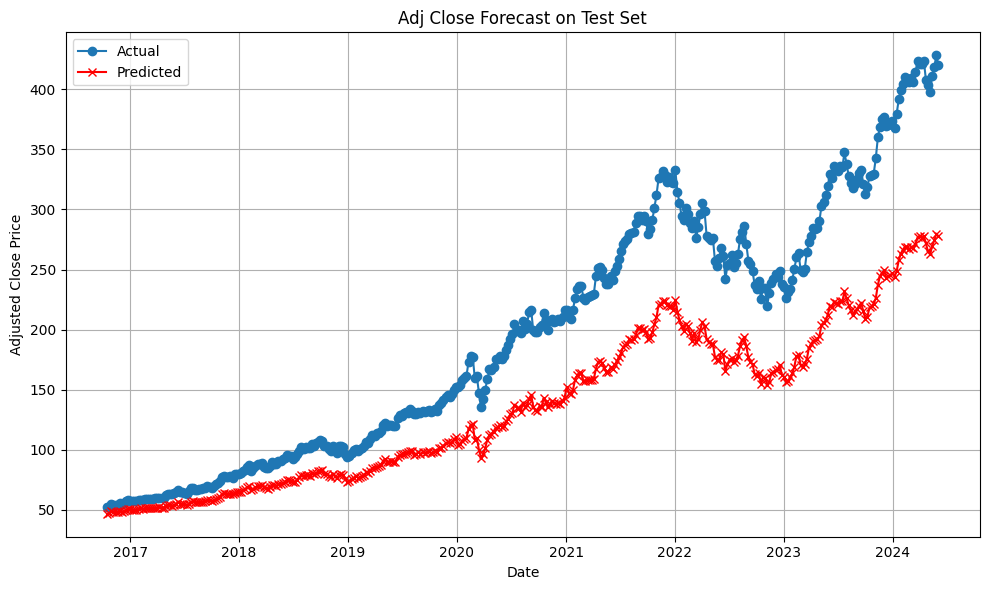
5. Can this model explain past price movements and project future trends?
Yes. The model explains 98.9% of the variation in Microsoft’s adjusted close price (R-squared = 0.989). It effectively maps how the stock has responded to different inputs over time, including growth periods and market shocks.
What this means for investors:
This analysis helps investors look both backward and forward. Understanding how the stock has reacted to past events can improve confidence in future decisions, especially when similar conditions arise.
6. What might happen if Microsoft faces another crisis or price shift?
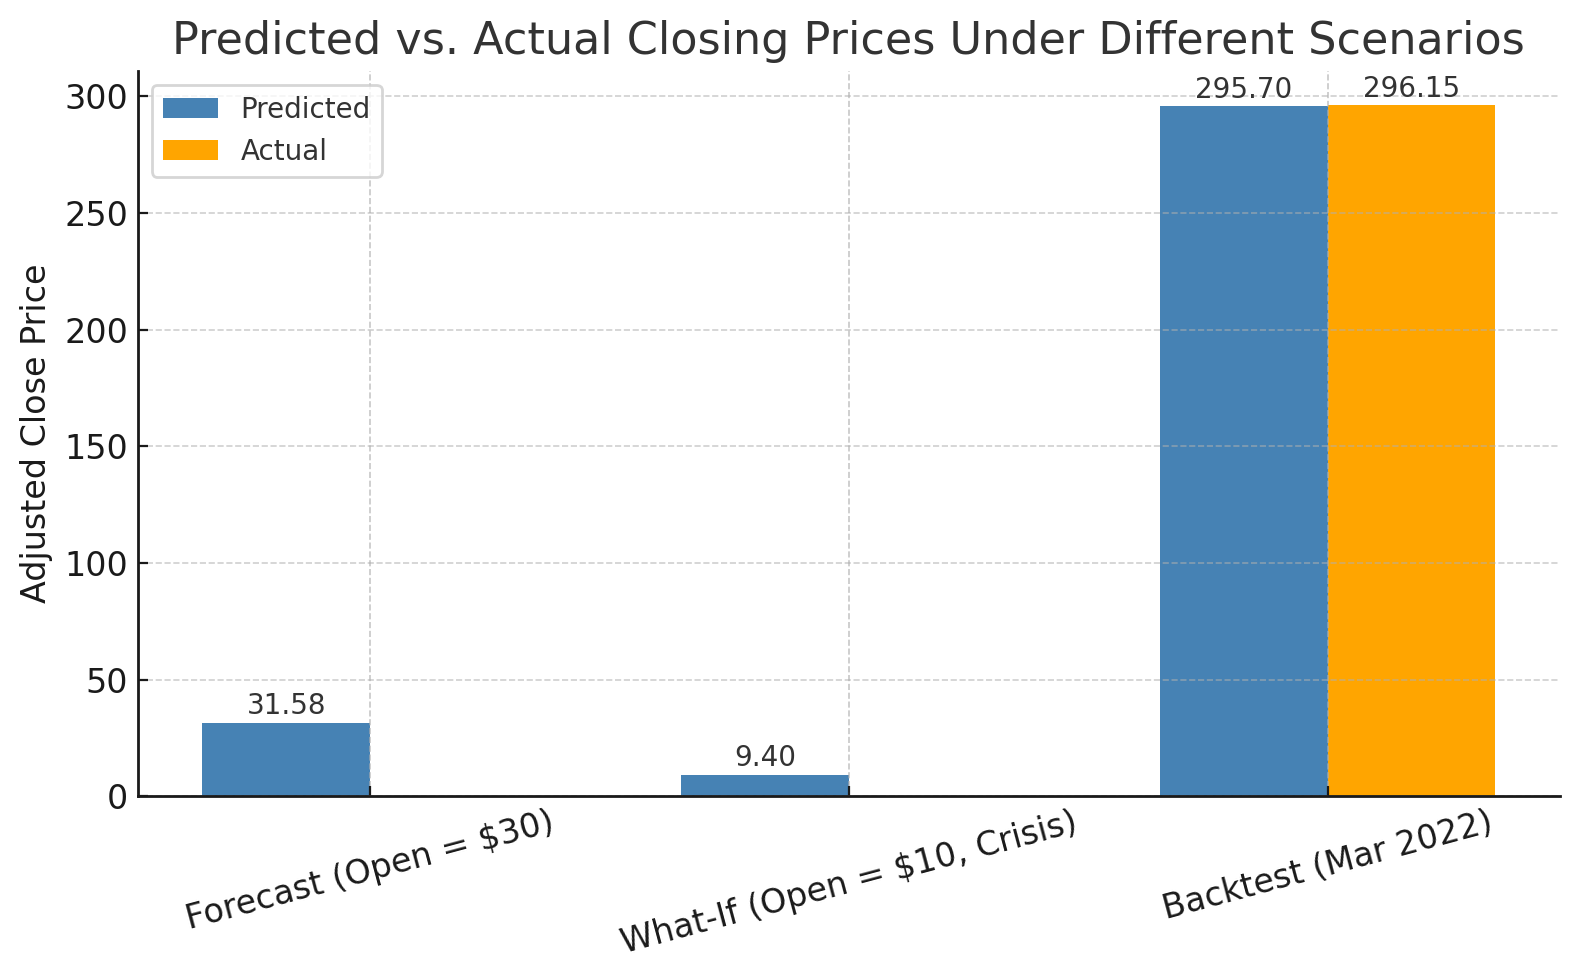
The model provides scenario-based predictions:
- If the stock opens at $30, the expected close is $31.58
- If it opens at $10 during a crisis, the expected close is $9.40
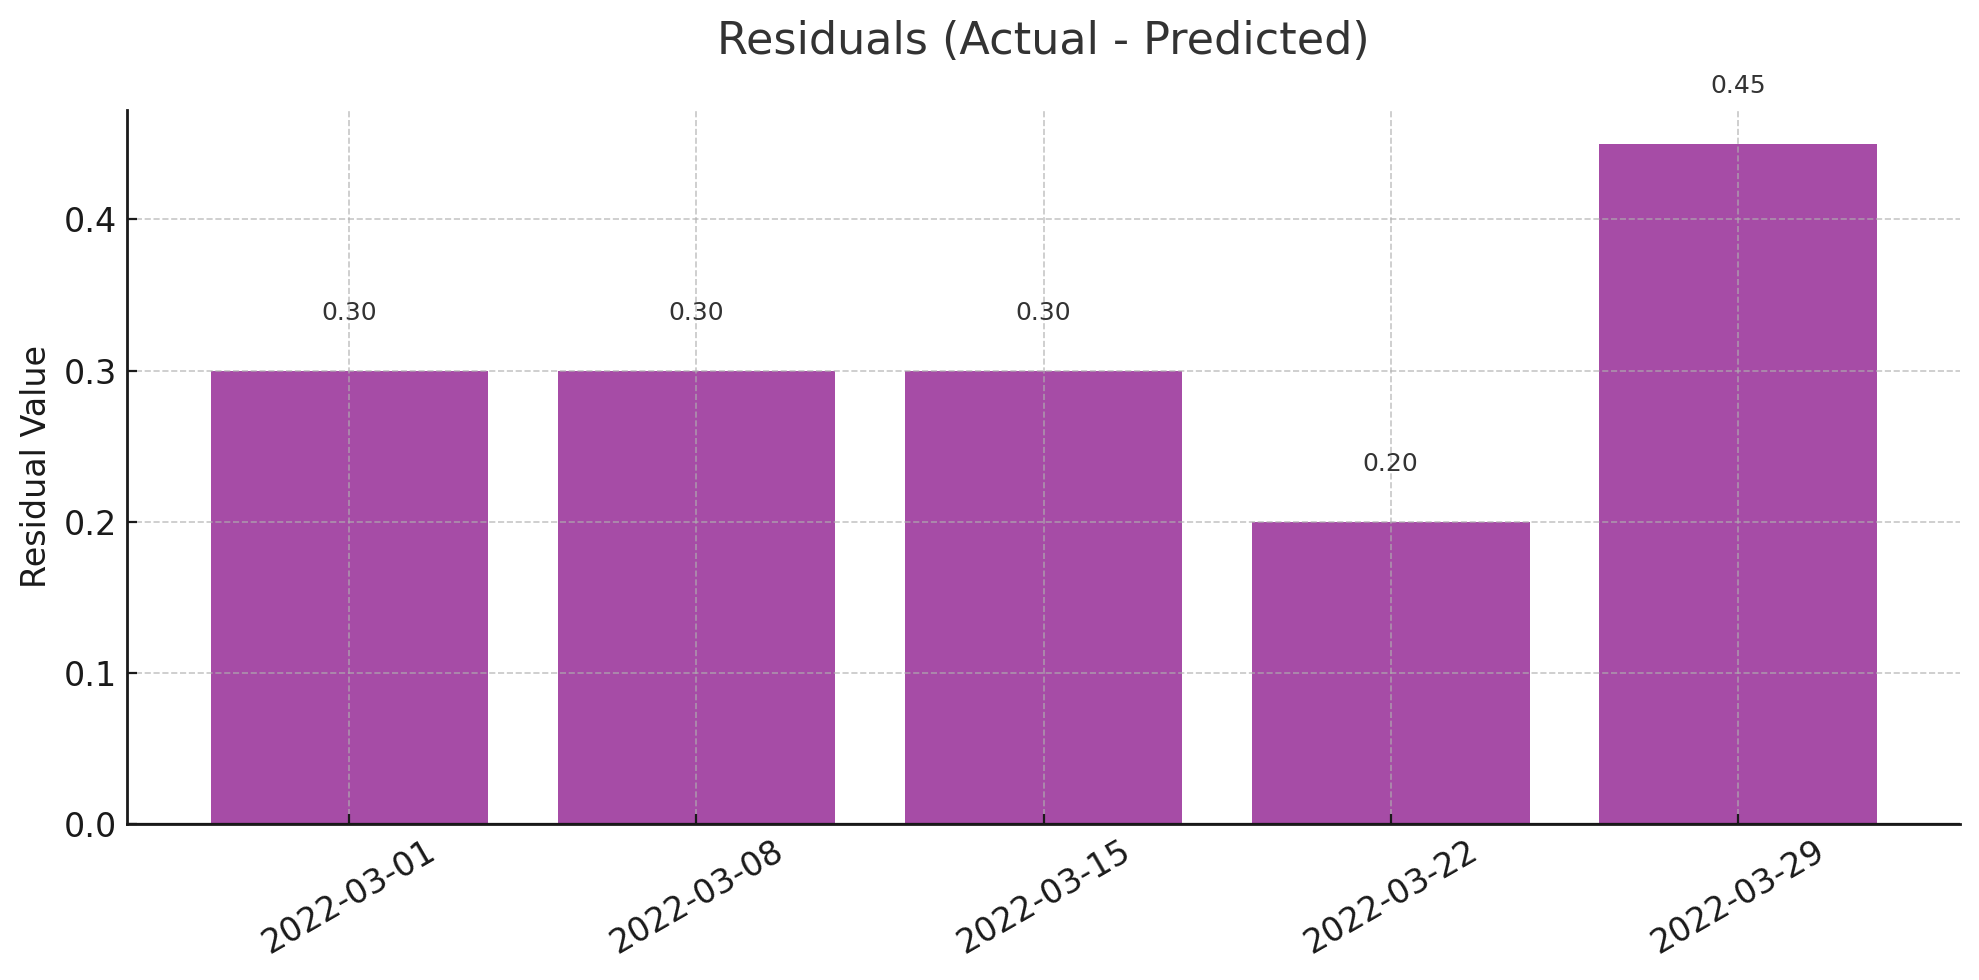
- In March 2022, the model predicted $295.70, while the actual close averaged $296.15 (just $0.45 off)
What this means for investors:
The model helps investors test future possibilities and assess risk. It's particularly useful for gauging the effects of price shocks or understanding recovery potential during economic events like COVID.
7. How accurate is the model in reflecting real market behavior?
The model is highly accurate. With an R-squared of 0.989, it closely mirrors actual price behavior. In backtesting, it consistently predicted prices within less than a dollar of actual values. All key variables are statistically significant, except for the GFC dummy.
What this means for investors:
Investors can trust the model’s insights for guiding real decisions. While no model is perfect, this one captures the key factors that influence Microsoft’s price with strong reliability.
Conclusion
Microsoft has been a consistent long-term performer. Its adjusted closing price is shaped mainly by the opening price, time, and broader economic cycles. Investors who understand these drivers—and who time their decisions based on dips within growth phases—can make more informed, evidence-backed choices.
Recommendations
-
When to Buy
- Look for temporary dips during long-term growth or post-crisis periods.
- A sharp drop in opening price—if not driven by fundamental weakness—may present a good entry point.
-
When to Hold
- Remain invested during stable growth phases, especially when volatility is low and market conditions are favorable.
-
When to Be Cautious About Selling
- Avoid selling during short-term market shocks like COVID. Historical data shows Microsoft tends to recover quickly.
- Consider selling only if the opening price is unusually high and not supported by long-term trends.