
Predicting Product Sales
Where Your Marketing Budget Works Hardest
Overview
This analysis was conducted to help marketing managers identify which advertising channels yield the highest return in product sales. The focus is on three key channels—affiliate marketing, billboards, and social media—with the goal of quantifying how much each dollar spent contributes to overall sales. By using regression analysis, the study aims to support data-driven budget planning and provide clarity on how to optimize advertising spend for better campaign outcomes.
The analysis addresses a practical business challenge: determining which channels drive the most sales and how reallocating budget could impact results. Marketing managers need to make informed decisions about where to invest to meet sales targets and maximize ROI. This report provides clear insights on each channel’s effectiveness, the reliability of the predictive model, and what to expect under different spending scenarios—all to guide smarter, performance-driven advertising strategies.
Question 1
How strongly is each marketing channel linked to product sales, and are any channels too similar to each other?
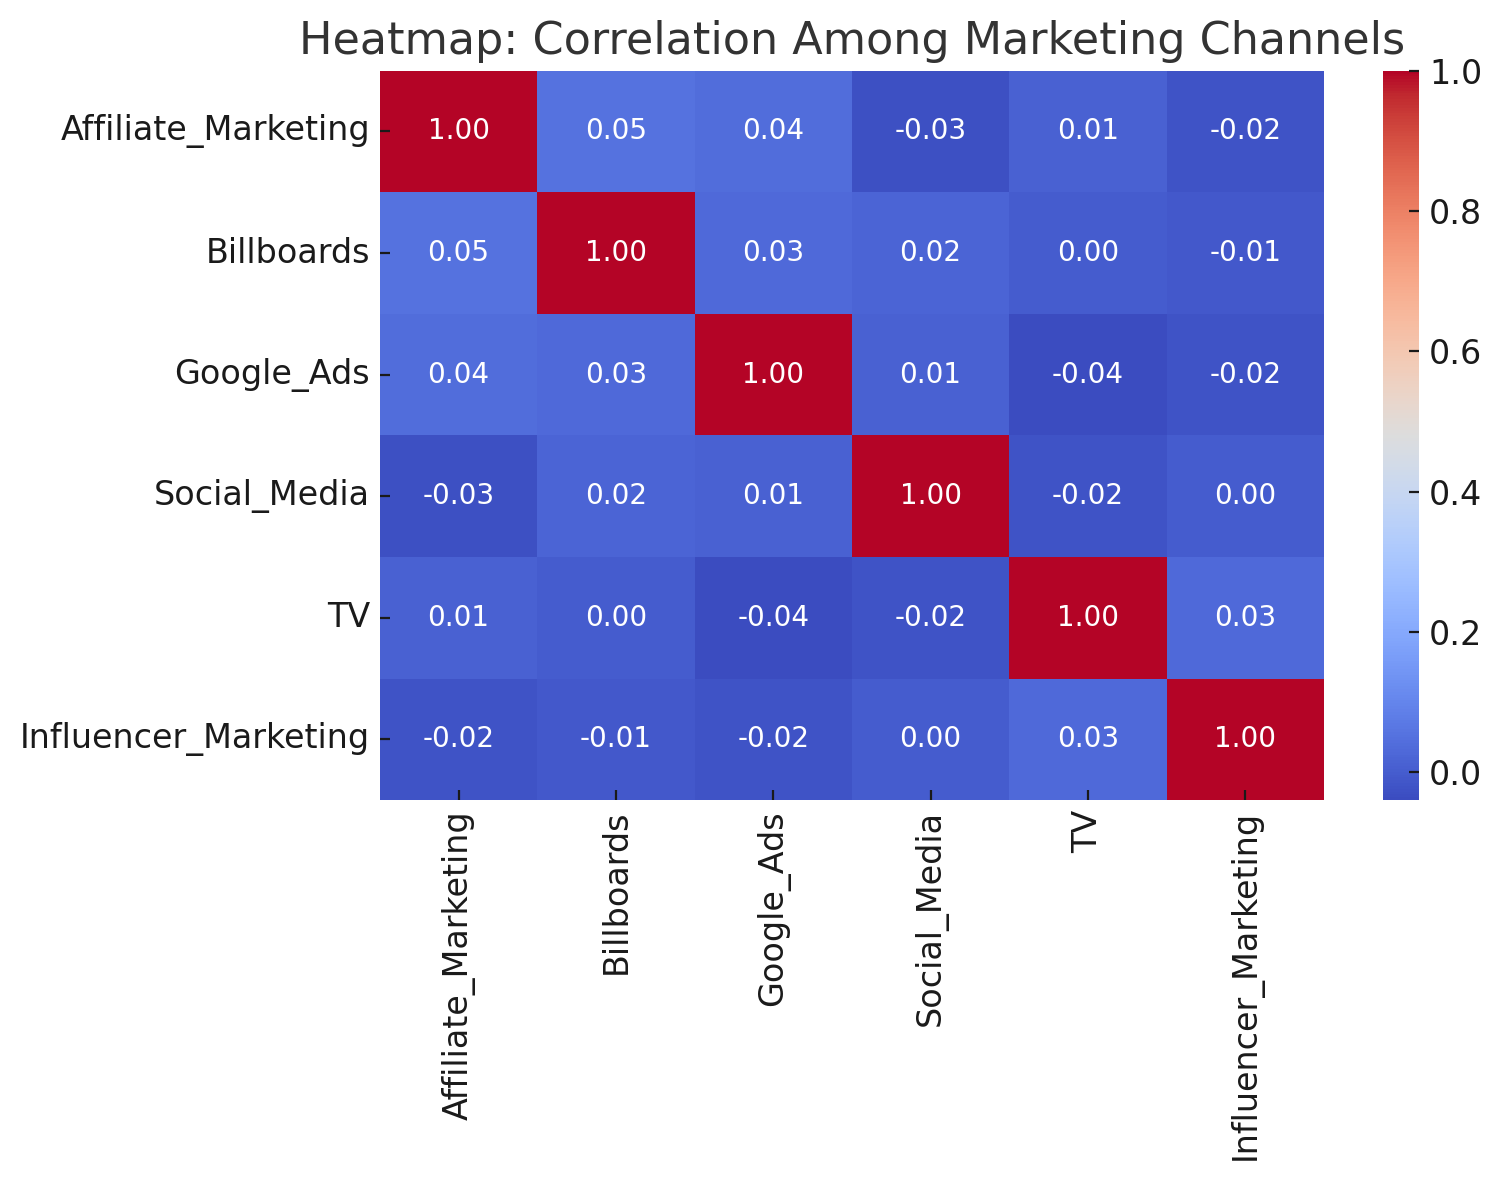
The strength of the relationship between each marketing channel and product sales was measured using correlation. Affiliate Marketing showed the strongest link, followed by Billboards and Social Media, which had moderate influence. TV, Google Ads, and Influencer Marketing had weaker connections to sales.
We also checked whether any channels were too closely related to each other, which could cause duplication in the model. Based on the correlation analysis between channels, no such overlap was found. This means the channels included in the model—Affiliate Marketing, Billboards, and Social Media—are distinct enough to use together without causing interference.
Question 2
Which advertising channels have a statistically significant impact on product sales?
All six advertising channels were found to have a statistically significant impact on product sales. This means the likelihood that their influence is due to random chance is extremely low. The p-values for all channels were close to zero, confirming their importance in predicting outcomes. Because of this, these variables can be confidently included in the model to support marketing decisions.
Question 3
Can we trust this model to make predictions on new or future campaign data?
Yes, the model demonstrates strong reliability. It explains about 78% of the variation in product sales, which indicates a high level of accuracy. The model also passed other important checks, such as a strong F-statistic and a Durbin-Watson value close to 2, which suggests that the prediction errors are randomly distributed and not biased. Together, these results show the model is well-suited for making forecasts about future campaigns based on planned ad spend.
Question 4
How much does each dollar spent in a selected channel contribute to product sales?
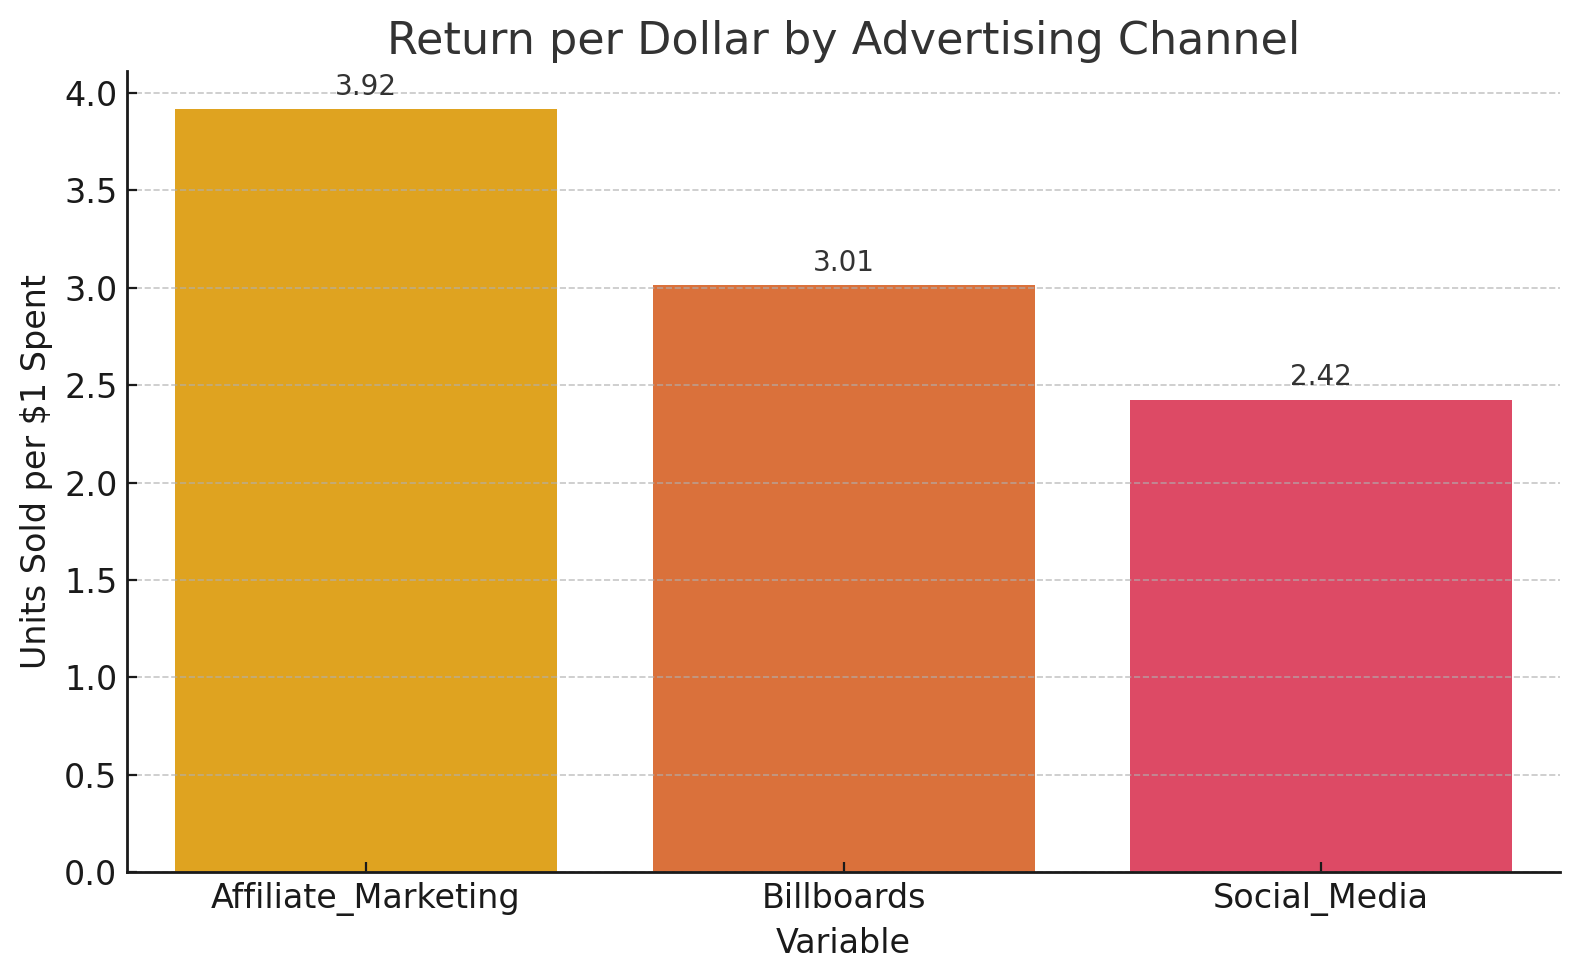
The model shows that every additional dollar spent on Affiliate Marketing is associated with approximately 3.92 more units sold. Billboards follow with about 3.01 units per dollar, and Social Media contributes around 2.43 units per dollar. This gives a clear view of which channels offer the best return for each marketing dollar and helps prioritize budget allocation to maximize sales outcomes.
Question 5
How accurate are the model’s predictions for individual campaigns, and where do the largest gaps appear?
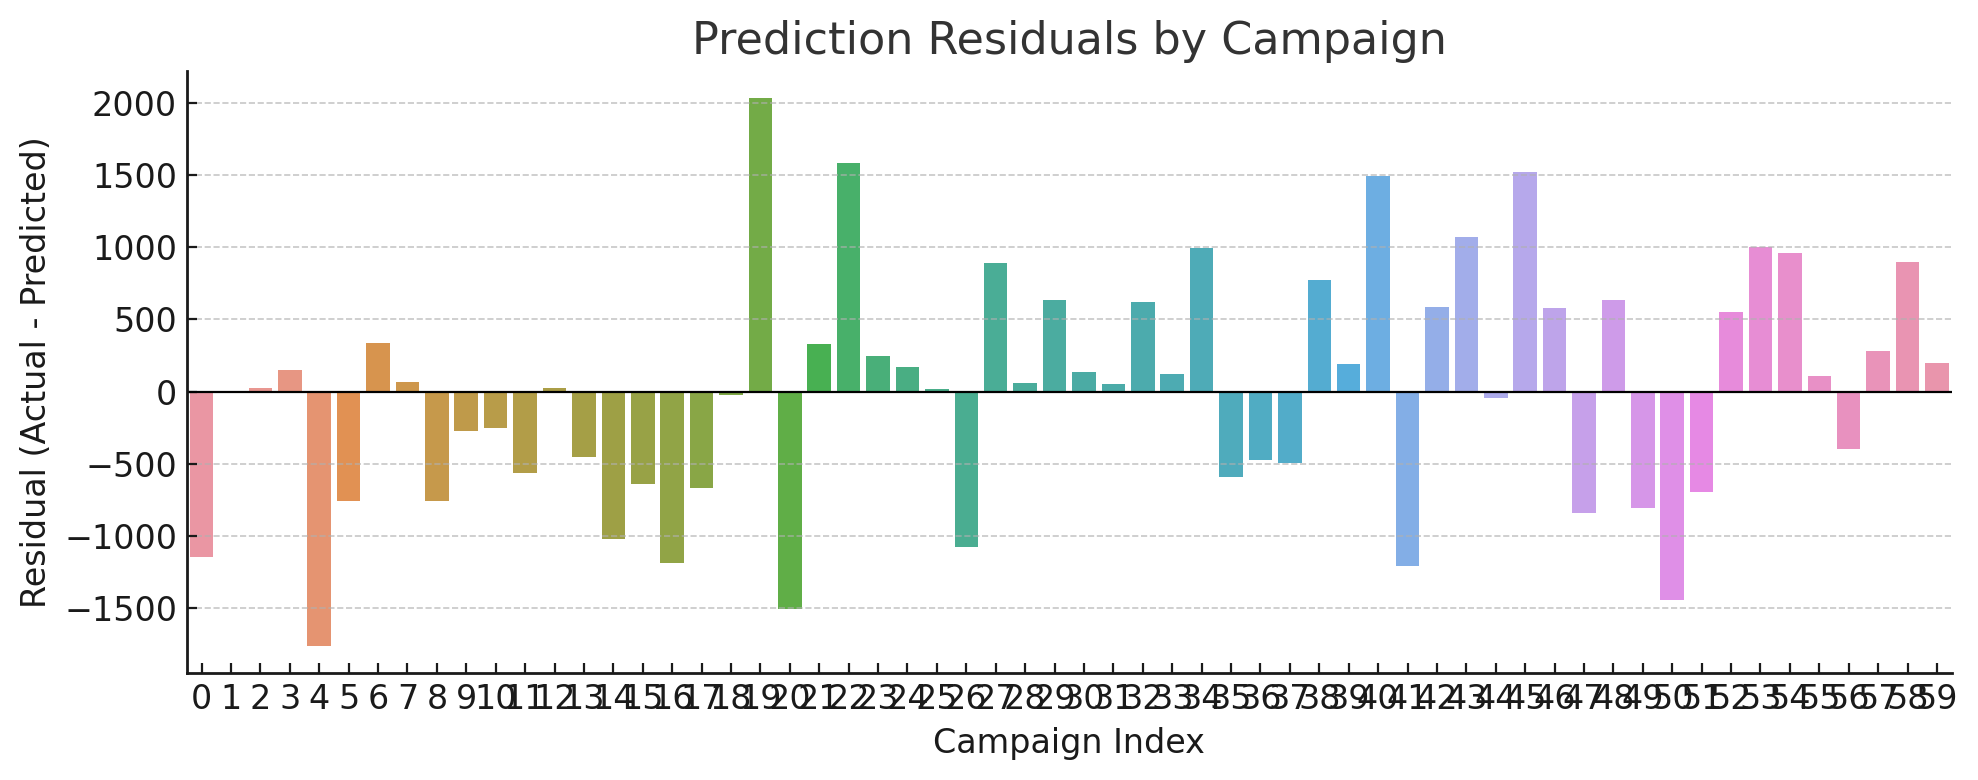
The model performs well when predicting product sales for individual campaigns. On average, the prediction differs from the actual sales by about 641 units, which is reasonable given that most campaigns have sales figures between 5,000 and 9,000 units. The correlation between predicted and actual sales is high, showing that the model generally follows the real sales trend.
However, there were a few campaigns with larger differences. For example, one campaign underpredicted sales by about 1,000 units, while another overpredicted by nearly the same amount. These gaps may be due to specific campaign factors such as timing, promotions, or competitor actions that were not included in the model. Still, overall accuracy remains strong and dependable for planning purposes.
Question 6
What sales outcome can we expect under specific campaign scenarios with different ad spend levels?
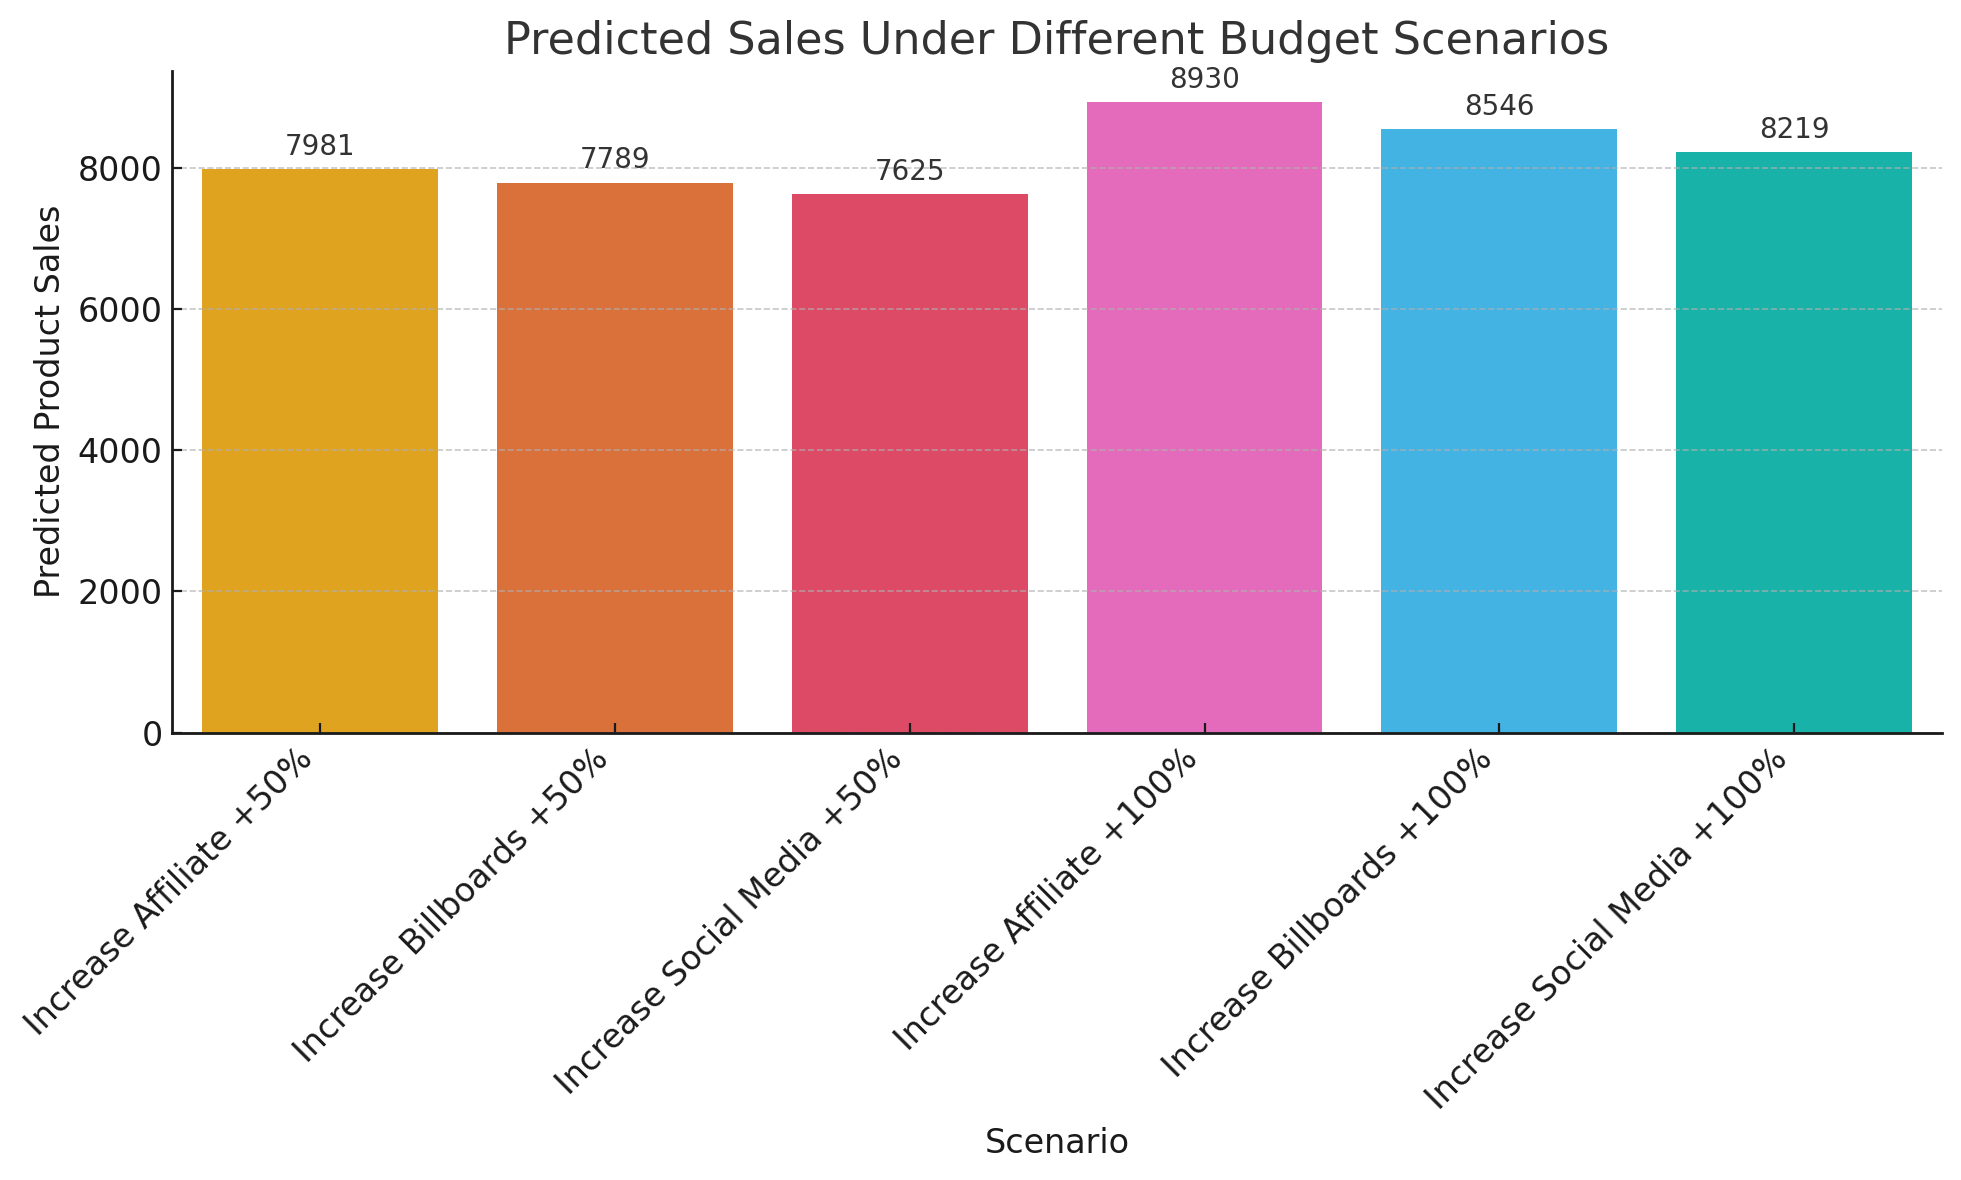
We simulated changes in ad spend by increasing one channel at a time while keeping the others unchanged. A 50% increase in Affiliate Marketing led to a predicted sale of about 7,981 units, while a 100% increase raised it to nearly 8,930 units. Similar increases in Billboards and Social Media spending also improved sales, though to a lesser extent.
These results suggest that Affiliate Marketing gives the most significant boost in product sales per dollar spent. Billboards provide solid improvements, and Social Media contributes meaningfully, though with smaller gains. This type of simulation helps marketing managers explore what-if scenarios and make informed decisions before launching a campaign.
Conclusion
The analysis confirms a strong and measurable relationship between advertising spend and product sales, with Affiliate Marketing consistently delivering the highest return—each additional dollar spent yields nearly four more units sold. Billboards and Social Media also have a positive impact, though to a lesser degree.
The regression model used is both statistically robust and practically useful, explaining 78% of the variation in sales and providing reliable predictions at both the overall and campaign levels. Scenario testing supports these insights, showing that increasing spend in Affiliate Marketing drives the most significant sales gains, followed by Billboards and Social Media. These findings offer a clear direction for optimizing ad budgets to maximize sales outcomes.
Recommendations
- Prioritize Affiliate Marketing for Budget Increases: Allocate a larger share of the ad budget to Affiliate Marketing, as it offers the highest return per dollar. This channel has the strongest correlation with product sales and consistently outperforms others in predictive scenarios.
- Maintain Moderate Investment in Billboards and Social Media: These channels are still valuable contributors to sales performance. Maintain or slightly increase investment where appropriate, particularly when targeting awareness or reach objectives.
- Use Predictive Modeling to Guide Budget Planning: Continue using the regression model to simulate campaign outcomes under different spending scenarios. This will help marketing managers forecast the impact of future campaigns and make informed allocation decisions.
- Monitor and Adjust Based on Campaign Performance: While the model is strong, some campaigns showed larger prediction gaps. Regularly compare predicted versus actual results and refine the model by incorporating new variables like seasonality, promotions, or competitive activity.
- Avoid Spreading Budget Thinly Across All Channels: Not all channels deliver equal value. Focus resources on those with proven impact instead of equally distributing across all platforms.
- Test Further Increases in High-Return Channels: Consider running controlled experiments to explore whether even greater gains can be achieved by further increasing spend in Affiliate Marketing, especially during high-demand periods.