
Trend or Trap?
Decoding Google’s Price Swings
Overview
Retail investors often face uncertainty when deciding whether to buy, hold, or sell a stock, especially when prices fluctuate sharply. This case study analyzes Google’s stock to help investors distinguish between long-term trends and short-term swings. Using historical data, we examine how Google’s price typically behaves across different timeframes to provide clear context for interpreting current movements.
The goal is to offer accessible insights, backed by practical analysis of price changes, moving averages, and volatility patterns. By identifying what’s normal, what’s not, and how the stock has responded to past events, this study aims to support sound, data-informed decisions.
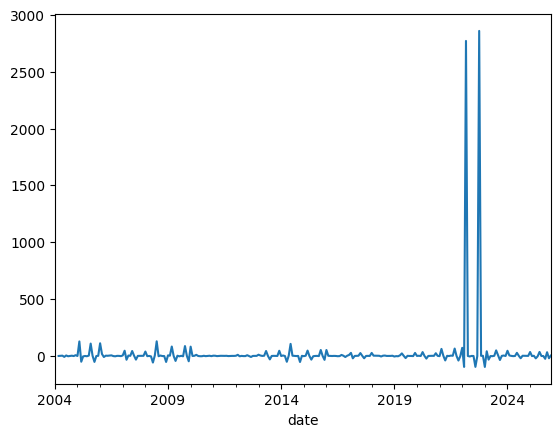
1. What is the typical range of daily and monthly percent changes for Google’s stock, and when does a change become unusual?
Daily price changes typically fall between –2% and +2%. Monthly changes usually range from –8% to +12%. Any movement beyond these limits is considered unusual and may reflect market events worth investigating. In 2022–2023, some monthly changes exceeded 2700%, far beyond the typical range. These outliers likely result from events like stock splits or data anomalies and should be reviewed or excluded.
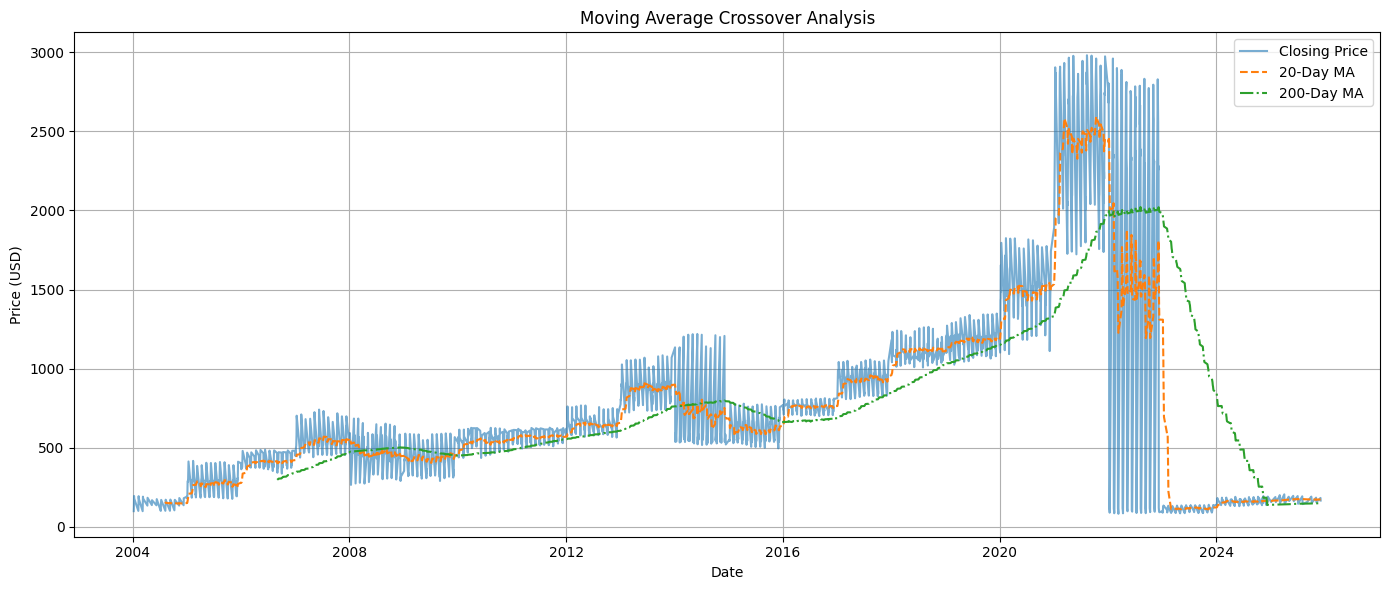
2. How do short-term (20-day) and long-term (200-day) moving averages interact, and what can crossover patterns tell us?
The 20-day moving average tracks short-term shifts, while the 200-day average reflects broader trends. When the 20-day average crosses above the 200-day, it often signals a potential uptrend (Golden Cross). When it crosses below, it may indicate a downturn (Death Cross). Notable examples include a Golden Cross in 2012 before a long rally and a Death Cross in 2022 ahead of a decline. However, data distortions after 2022 raise concerns, making it important to verify data before drawing conclusions.
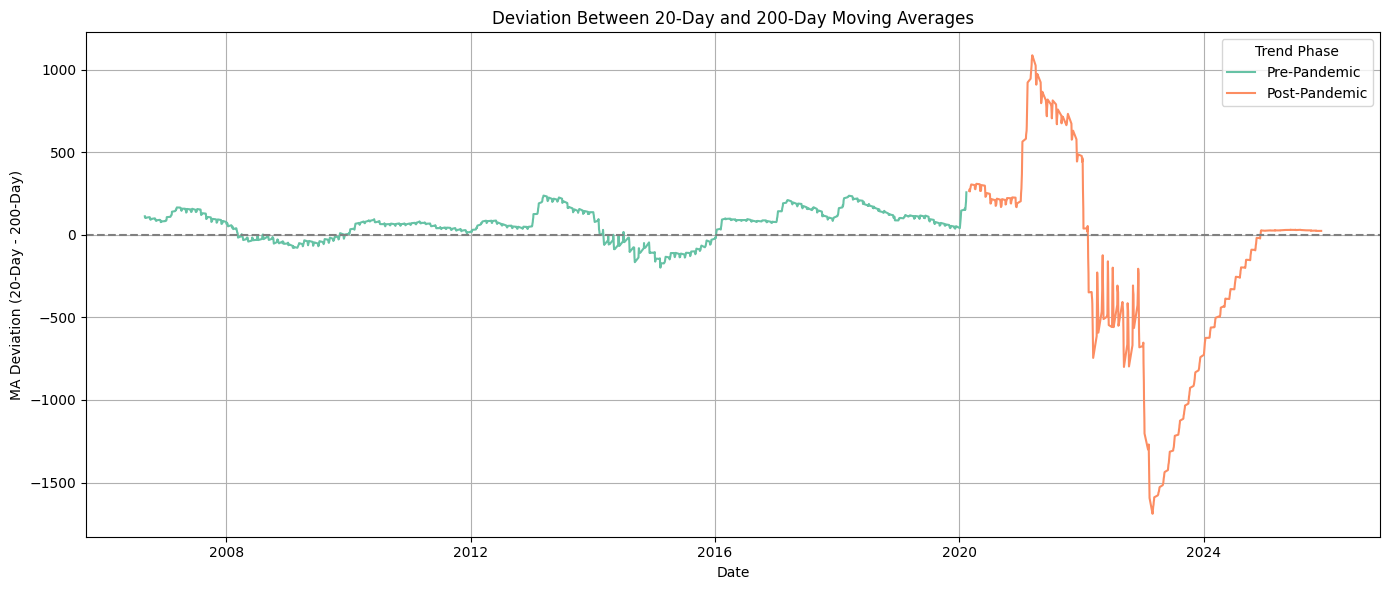
3. When did short-term price swings deviate significantly from long-term trends?
From 2004 to early 2020, short-term swings remained close to long-term trends. After 2020, extreme deviations occurred. In 2022, the gap between short- and long-term averages reached +1062 points. By 2023, it dropped to –1663. These unusual movements suggest temporary overreactions or data issues rather than lasting shifts.
4. After sharp short-term drops, how long did it typically take for the price to recover?
Analysis flagged 546 sharp daily drops of –5% or more. However, all showed zero-day recovery, which is not realistic. This likely stems from a flaw in the calculation, possibly comparing prices on the same day rather than measuring true recovery time. A better method would track recovery over several weeks or months.
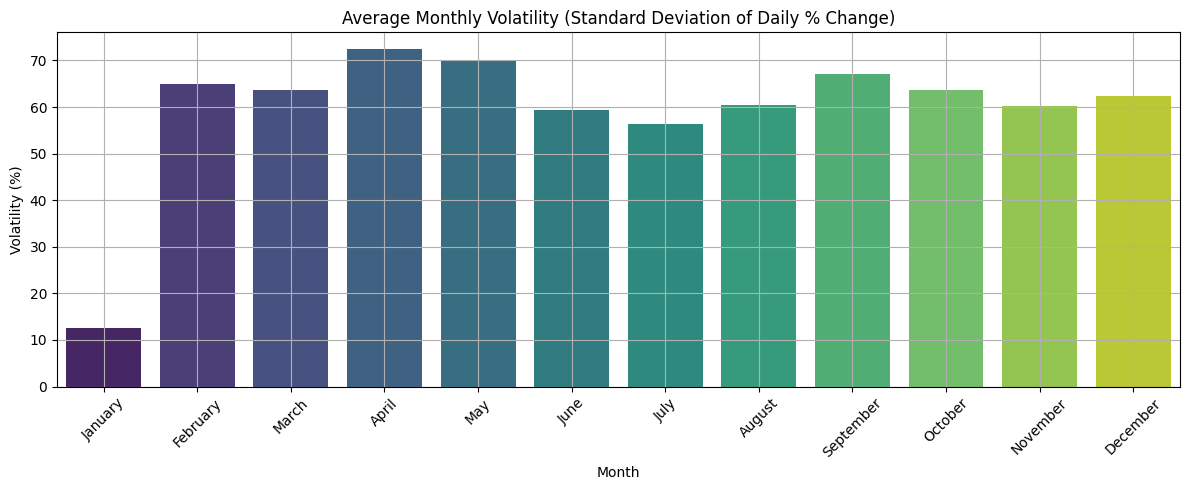
5. Are there seasonal or cyclical patterns in short-term swings?
From 2004 to 2021, quarterly volatility stayed within a 20%–60% range. In contrast, volatility spiked above 1100% in early 2022—an anomaly likely tied to market shocks or data issues. On a monthly basis, swings were most common in April, May, February, and September, which may coincide with earnings season. January showed the lowest volatility.
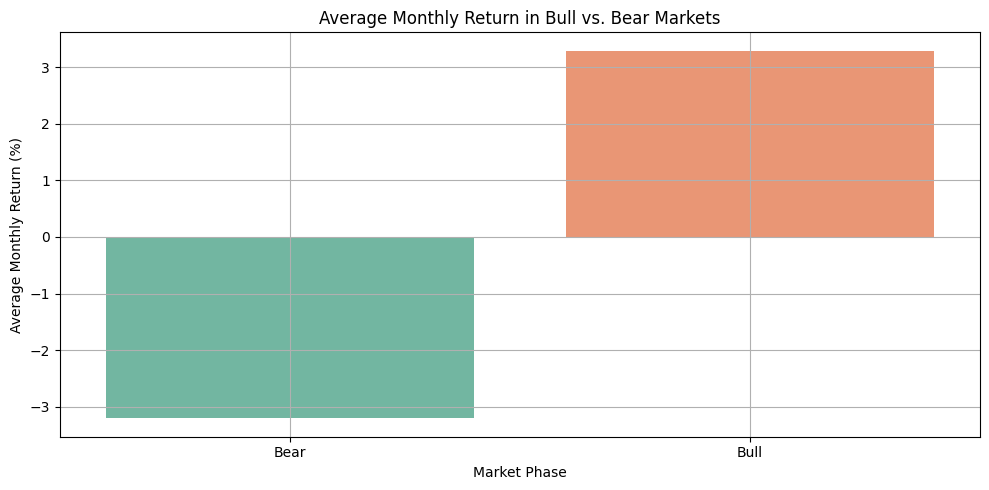
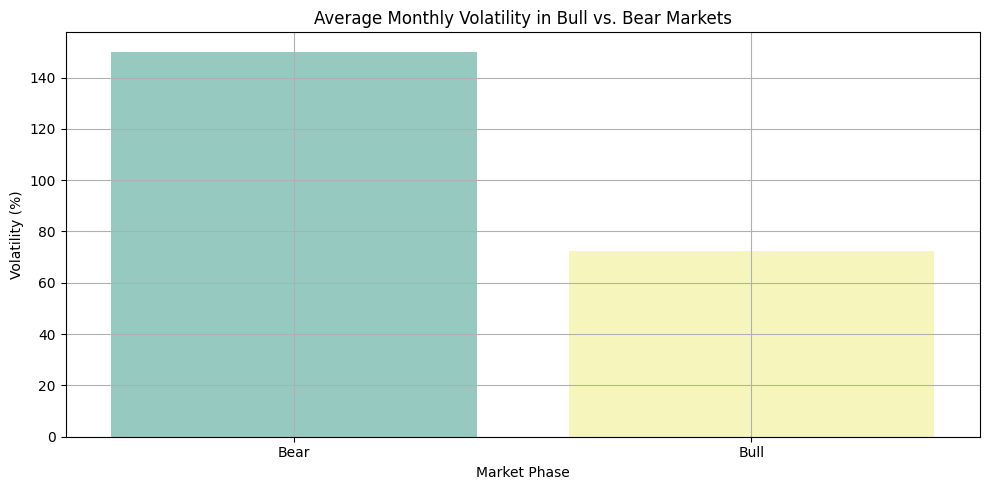
6. What is the average return and volatility during bull vs. bear markets?
In bull markets, Google stock returned an average of +3.32% per month with lower volatility (72%). In bear markets, the average return was –3.17%, with higher volatility (150%). These figures suggest that market phase heavily influences both return and risk, making it essential to adjust strategies accordingly.
Conclusion
From 2022 to 2024, Google’s price movements have been driven more by volatility spikes and market reactions than long-term trends. Key signals—such as large deviations between moving averages and sudden shifts in volatility—suggest that recent activity reflects a temporary swing rather than a new upward trend.
Investment Recommendations
- Hold: If already invested, hold with caution. Monitor for trend reversals and use stop-loss strategies to manage risk.
- Buy: Wait for a confirmed uptrend (e.g., a Golden Cross) and consider buying during low-volatility months like January or June.
- Sell: Consider trimming positions if you’ve seen recent gains and indicators show continued weakness.
Final Note
Avoid making quick decisions based on sharp movements. Instead, look for consistent signals, assess volatility, and ensure your data is reliable before acting.