Undervalued and Overlooked
Why Mid-Sized Homes Offer the Best ROI
Overview
This case study investigates how home prices vary across different square footage brackets to help real estate investors identify the most advantageous property sizes for investment. The analysis focuses on defining typical price ranges by size, evaluating price volatility, and simulating pricing expectations using a uniform distribution model. By comparing actual sales data with simulated benchmarks, the study provides insights into whether certain size categories are undervalued, stable, or volatile—insights essential for guiding acquisition, budgeting, and scaling strategies.
The findings are particularly relevant for investors seeking to optimize price-to-space efficiency and manage risk exposure. Emphasis is placed on identifying home size segments where pricing is lower than expected, volatility is moderate, and market behavior reveals overlap between smaller and larger homes. These indicators help pinpoint where value is concentrated, with mid-sized properties between 1500–2499 sqft emerging as a consistently strong investment category.
Question 1: What is the typical price range for homes in each square footage bracket?
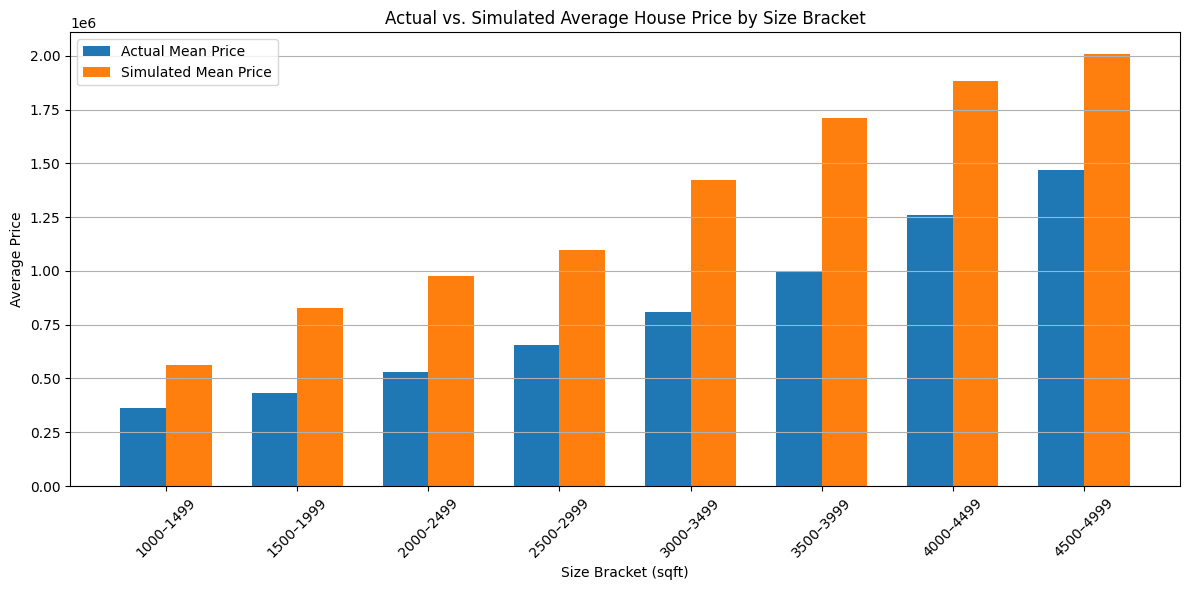
Home prices increase with square footage, but actual average prices remain below their simulated expectations across all brackets. For example, in the 1500–1999 sqft range, the simulated mean is $827,079, while the actual mean is only $430,846. Similarly, in the 2000–2499 sqft range, actual prices average $528,621, compared to a simulated mean of $978,380. This consistent undervaluation in the mid-sized segments suggests untapped investment opportunities, particularly where the gap between expected and observed prices is most pronounced.
Question 2: How wide is the price spread in each size bracket?
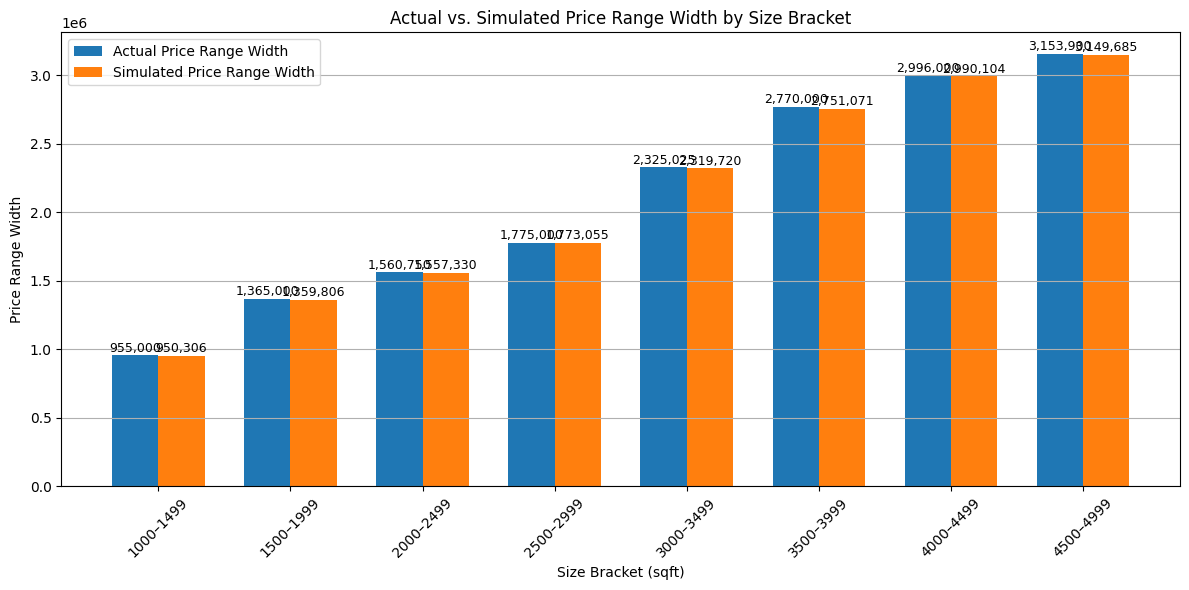
The price spread, defined as the difference between the maximum and minimum sale prices within each size category, increases with square footage. For smaller homes (1000–1499 sqft), the spread is approximately $955,000, while homes in the 4500–4999 sqft bracket show spreads exceeding $3.15 million. Simulated data using uniform distributions confirm the credibility of these patterns. This widening spread with size underscores that smaller homes present lower pricing variability, whereas larger homes introduce greater uncertainty—critical when matching investment strategies to risk tolerance.
Question 3: Which size brackets have high price volatility, and which are more stable and predictable?
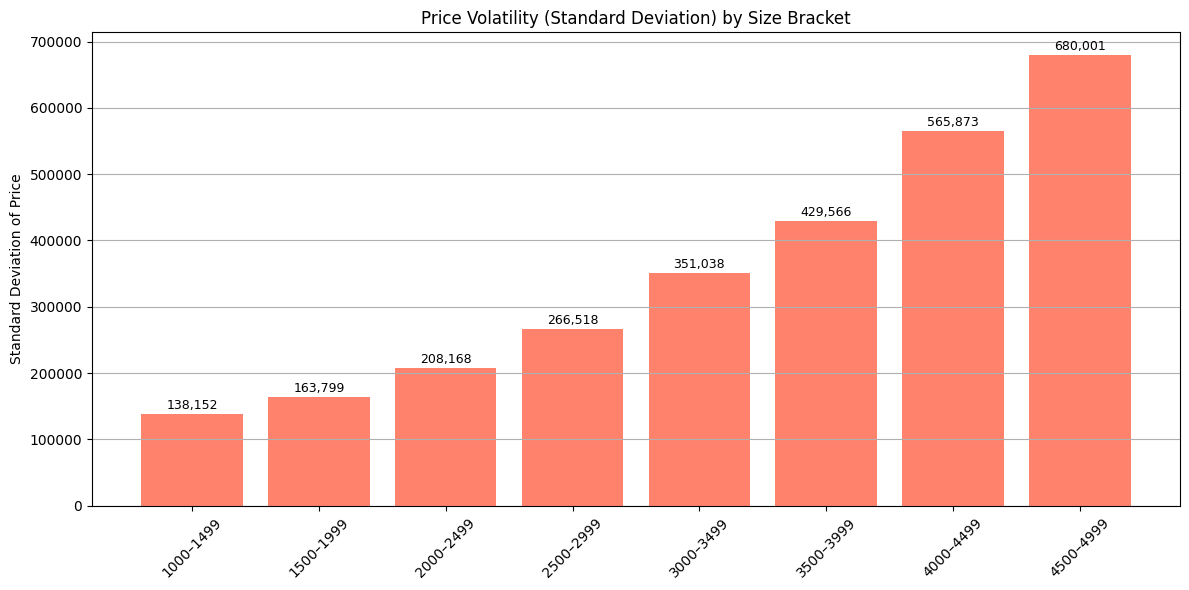
Price volatility, measured by standard deviation, rises with home size. Smaller homes (1000–1499 sqft) demonstrate low volatility, with a standard deviation of approximately $138,152. Larger homes (4500–4999 sqft), however, reach standard deviations of over $680,000. Mid-sized homes in the 1500–2499 sqft range strike a practical balance: they provide more living space than smaller homes while maintaining moderate price variability. These findings help investors assess which brackets offer stability alongside return potential.
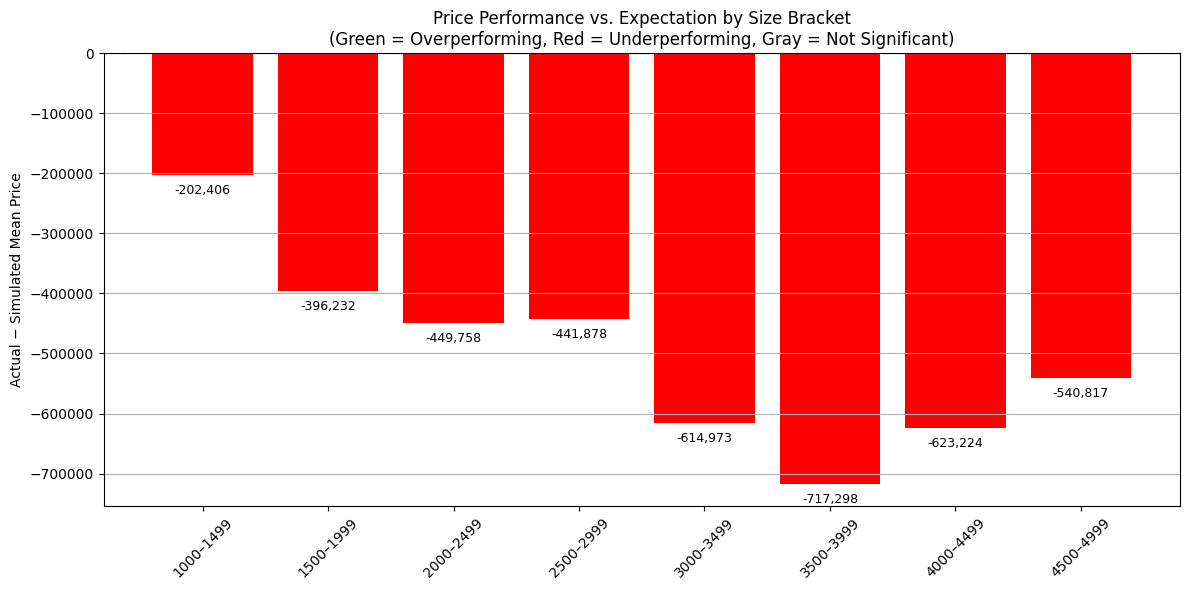
Question 4: Are there size ranges where home prices consistently underperform or outperform expectations?
Every size bracket underperforms relative to simulated expectations, with all p-values below 0.0001, confirming the statistical significance of the findings. The most notable gap occurs in the 3500–3999 sqft bracket, where actual prices fall short by over $717,000. Even the smallest bracket (1000–1499 sqft) underperforms by more than $200,000. While undervaluation is widespread, mid-sized homes (1500–2999 sqft) stand out for combining substantial pricing gaps with lower volatility—making them more appealing for investment than their larger counterparts.
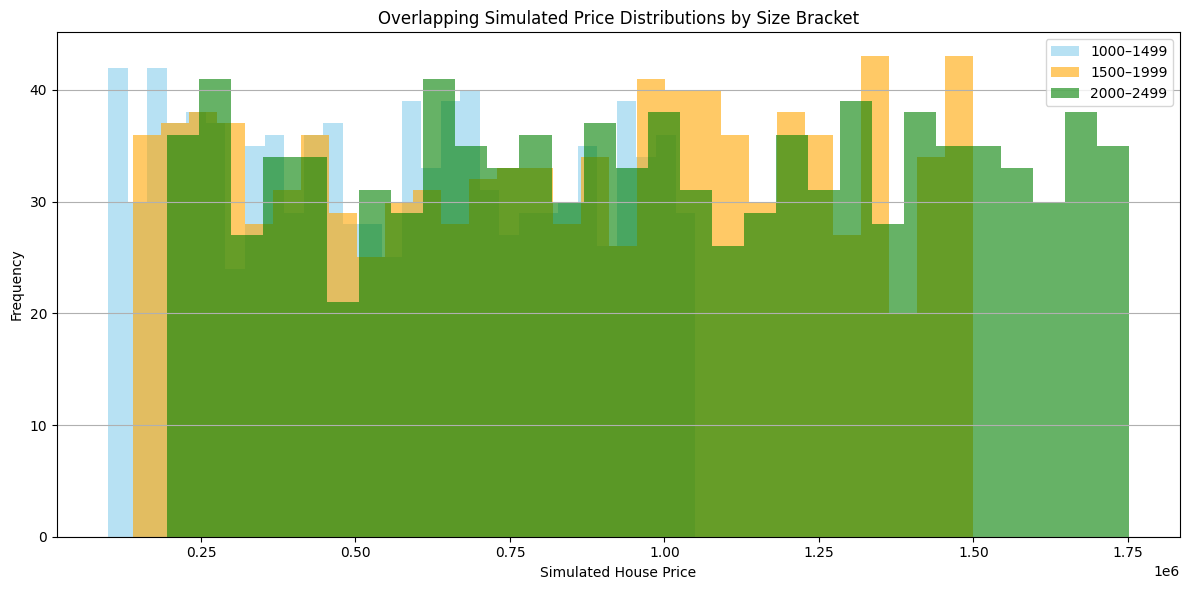
Question 5: Are there any overlaps in price between small and larger home sizes?
Simulated price distributions reveal clear overlap between smaller and mid-sized homes. Homes in the 1500–1999 sqft range often share price ranges with those in the 2000–2499 sqft bracket. This suggests that larger homes are sometimes priced similarly to smaller ones, offering savvy investors a chance to acquire more square footage without a proportionate increase in cost. Such pricing anomalies create an attractive entry point for value-driven acquisitions.
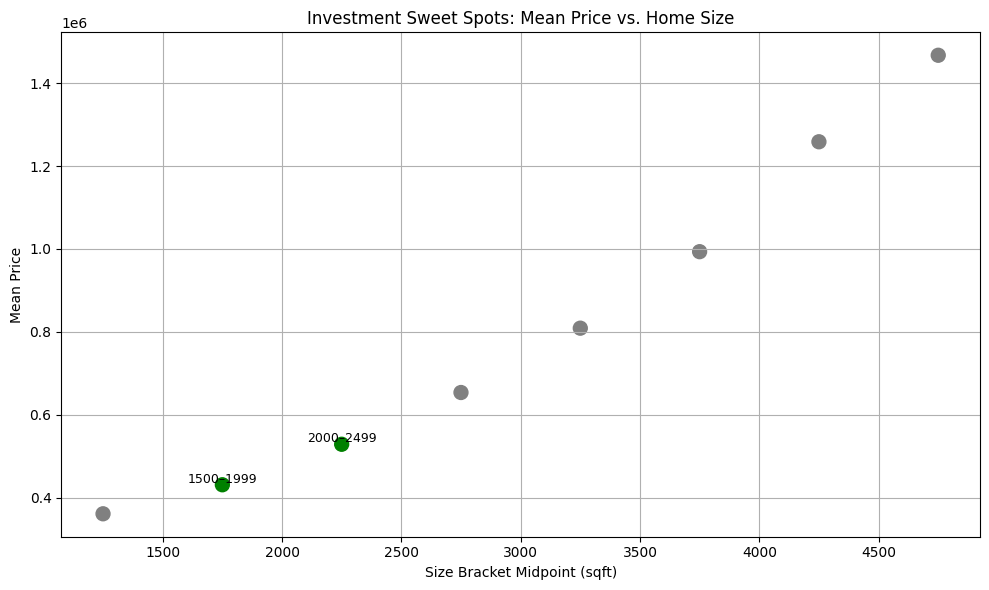
Question 6: Are there investment sweet spots—e.g., properties that are mid-sized but priced similarly to smaller ones?
The analysis identifies two investment sweet spots: the 1500–1999 sqft and 2000–2499 sqft brackets. These homes combine lower-than-average price per square foot—$246 and $235 respectively—with relatively low volatility. Both brackets fall below the expected pricing trendline, offering more living space for less cost. Larger homes, while commanding higher absolute prices, tend to deliver diminishing value per square foot and exhibit higher risk. These insights position mid-sized homes as ideal for balanced, growth-oriented investing.
Investment Insights
Mid-sized homes between 1500–2499 sqft offer the best combination of affordability, price stability, and space-to-cost efficiency. These properties are consistently undervalued by $396,000 to $450,000 below simulated expectations and show lower pricing variability than larger homes. Price overlap with smaller homes further strengthens their value proposition, allowing investors to acquire more space at similar or only slightly higher cost.
As home size increases beyond 2500 sqft, average price and volatility rise sharply. Homes above 3500 sqft show the highest standard deviations and deepest underperformance relative to expectations, suggesting higher potential returns but also increased risk. These properties may appeal to risk-tolerant investors but are less suited for those seeking stable, efficient capital use.
Investment Recommendations
- Prioritize Mid-Sized Brackets (1500–2499 sqft): These homes offer the most attractive balance of cost, risk, and return. Priced between $400K–$550K, they provide an optimal entry point for mid-level capital deployment, especially for investors looking to scale efficiently.
- Expand Cautiously into 2500–2999 sqft Range: Larger homes offer more space but come with rising volatility. Focus on properties below the average price in this range or those overlapping with mid-sized pricing. Avoid properties above 3500 sqft unless the investment strategy prioritizes long-term appreciation with higher risk tolerance.
- Diversify Within Mid-Size Segments: To balance exposure, consider diversifying within the mid-sized category by targeting properties across varied zip codes, condition ratings, or age. This helps mitigate local market fluctuations and strengthens long-term portfolio resilience.