
When to Buy and Sell Google Stock
How Data Reveals Hidden Patterns in Price and Volume
Overview
This case study looks at Google’s stock performance to help individual investors make more informed decisions about when to buy and sell. We examine long-term trends, seasonal patterns, and what typically happens around earnings announcements. Using simple techniques like moving averages and percent change, we aim to show how price and trading volume have changed over time and what that might mean going forward.
The goal is to give practical, data-backed guidance. We highlight when Google stock tends to rise or fall, identify patterns that repeat each year, and explain how earnings seasons affect short-term behavior. These insights can help investors plan smarter entry and exit points.
Trend Analysis: Long-Term Growth and Consolidation
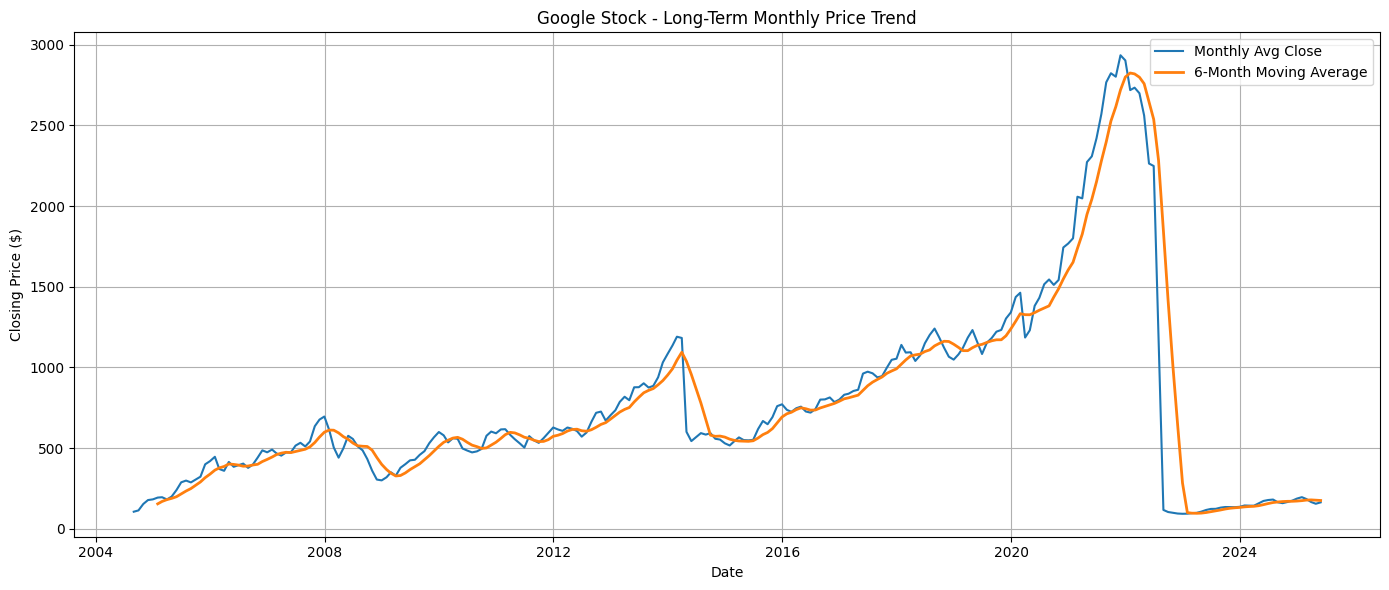
From 2004 to 2021, Google’s stock grew steadily. The average monthly closing price rose from about $100 to over $2,900 by late 2021. A sharp downturn followed in 2022, with prices dropping below $200. This shift was confirmed by the 6-month moving average, which helps smooth out short-term noise and reveal bigger trends.
Since 2023, prices have stabilized. For example, in May 2025, the stock closed at $163.19 and the 6-month moving average was $174.92. This flattening trend suggests a phase of consolidation. The moving average is a useful tool for spotting when momentum changes.
Price and Volume Changes: Spotting Shifts in Sentiment
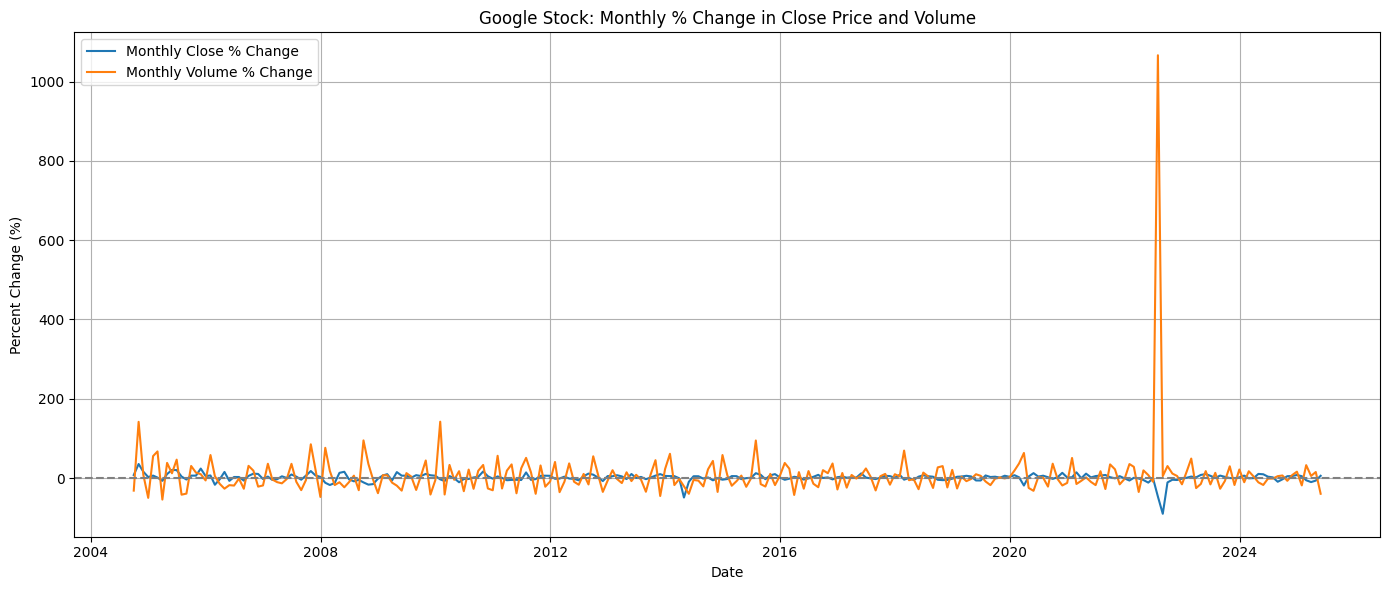
Google’s stock typically shows moderate monthly price changes, usually within ±10%. In March 2025, for example, the stock dropped by –10.29%, but it rebounded by +5.59% in May 2025. These swings are important to watch, especially for spotting recovery opportunities.
Volume changes tend to be more dramatic. February 2025 saw a 32.42% rise in trading volume, while May 2025 had a 39.74% drop. When volume spikes ahead of price moves, it often signals changing investor interest.
Quarterly data helps simplify things. Q1 2025 ended with a +3.65% gain, but Q2 saw a –14.01% drop, offering a clearer view of longer-term trends beyond monthly noise.
Comparing Time Periods: Before and After 2019
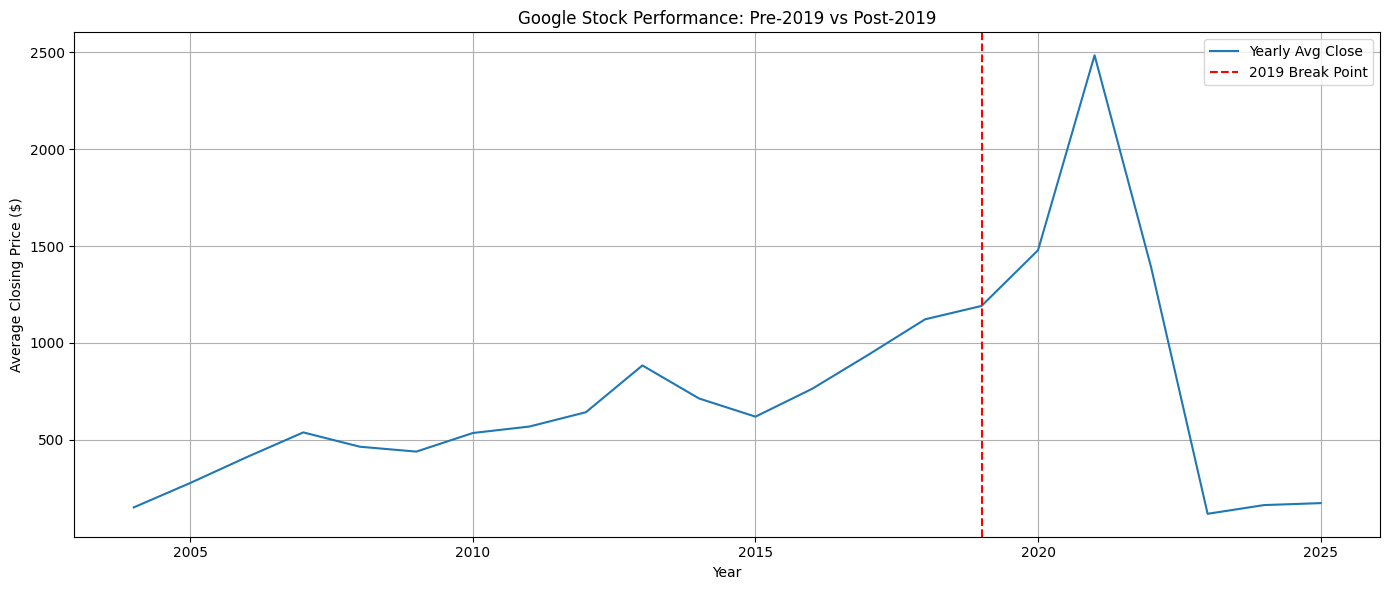
Between 2004 and 2018, Google’s average monthly close was $604.98. After 2019, it rose to $1,000.30—an increase of 65%. This growth was mostly driven by a strong rally in 2020–2021. However, volatility also increased significantly.
Trading volume nearly doubled, rising from 7.95 million shares before 2019 to 16.18 million afterward. This higher activity reflects increased market speculation and highlights the need for timing strategies in more volatile conditions.
Earnings Seasons: Short-Term Volatility
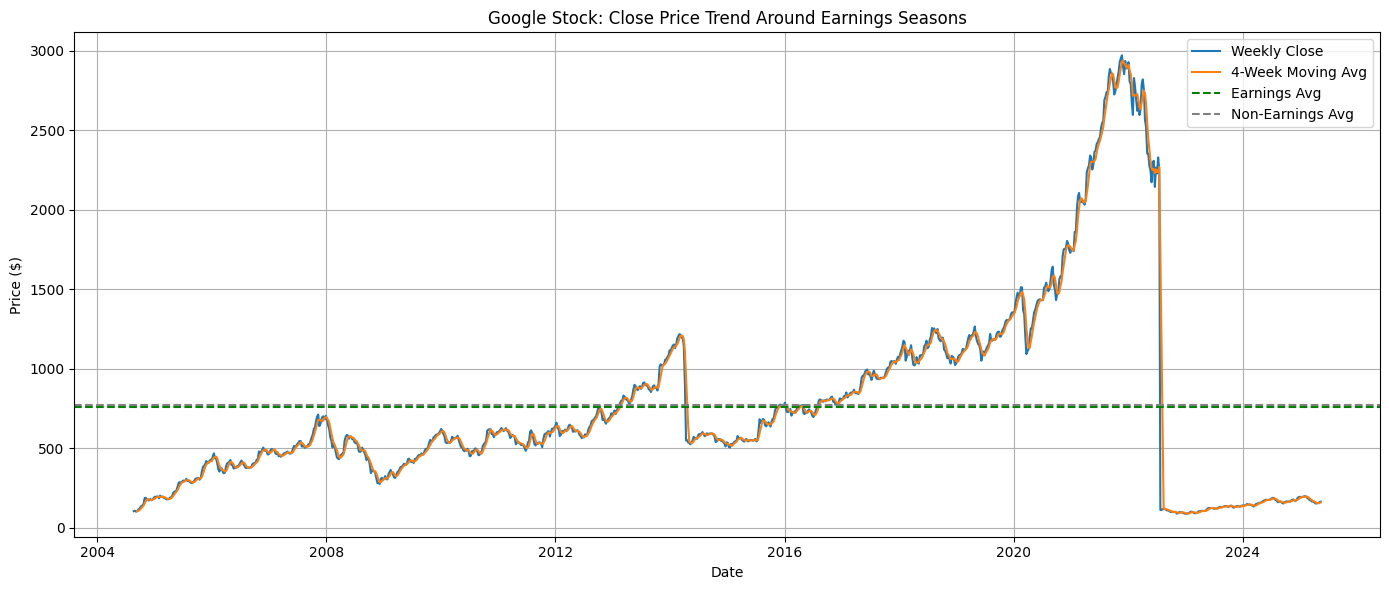
During earnings months (January, April, July, and October), average volatility increases. Price swings are larger—about 6.68% compared to 3.13% during non-earnings months.
Volume also rises slightly, from 9.37 million to 10.05 million shares. Prices tend to dip around earnings, which can create short-term buying opportunities.
The 4-week moving average helps cut through the noise and highlight real shifts. Investors should watch earnings periods closely, as price reactions can be sharp.
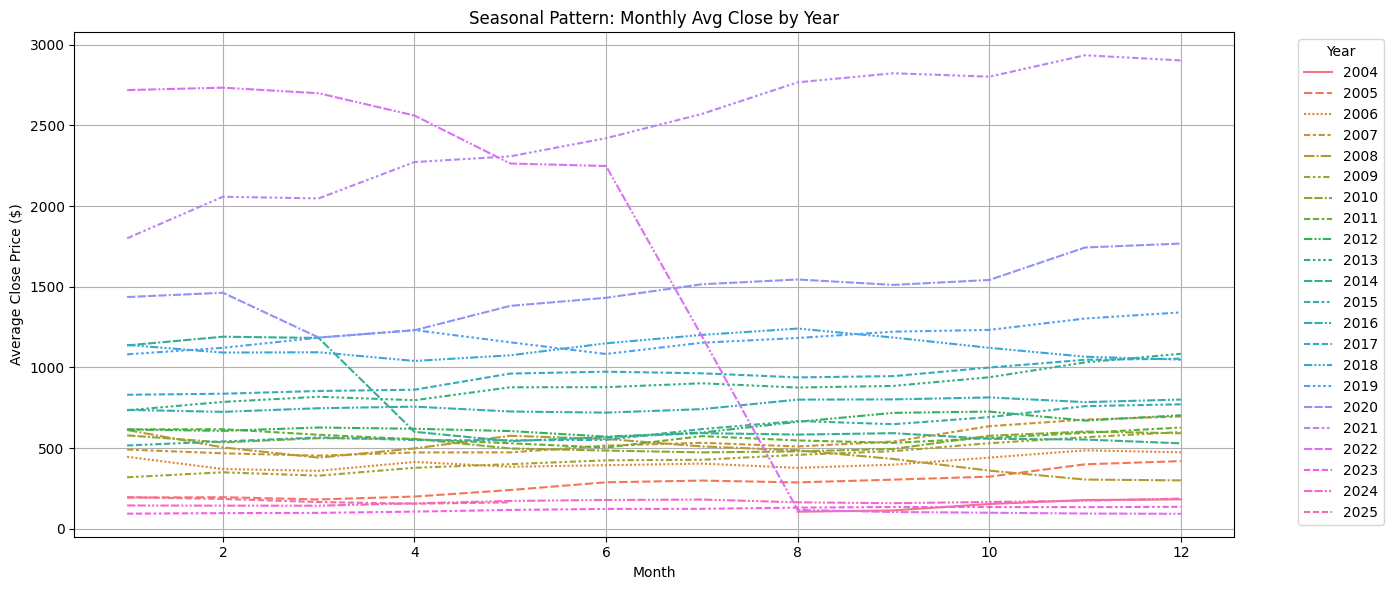
Seasonal Patterns: When Prices Tend to Rise or Fall
Some months consistently perform better than others. June ($802.82) and February ($791.15) have historically been strong. August is often weak, averaging only $710.57.
Q1 is the best-performing quarter ($783.36), while Q3 is the weakest ($723.06). These patterns suggest good windows for buying and selling. For example, investors may want to buy in August–September and sell between February and June.
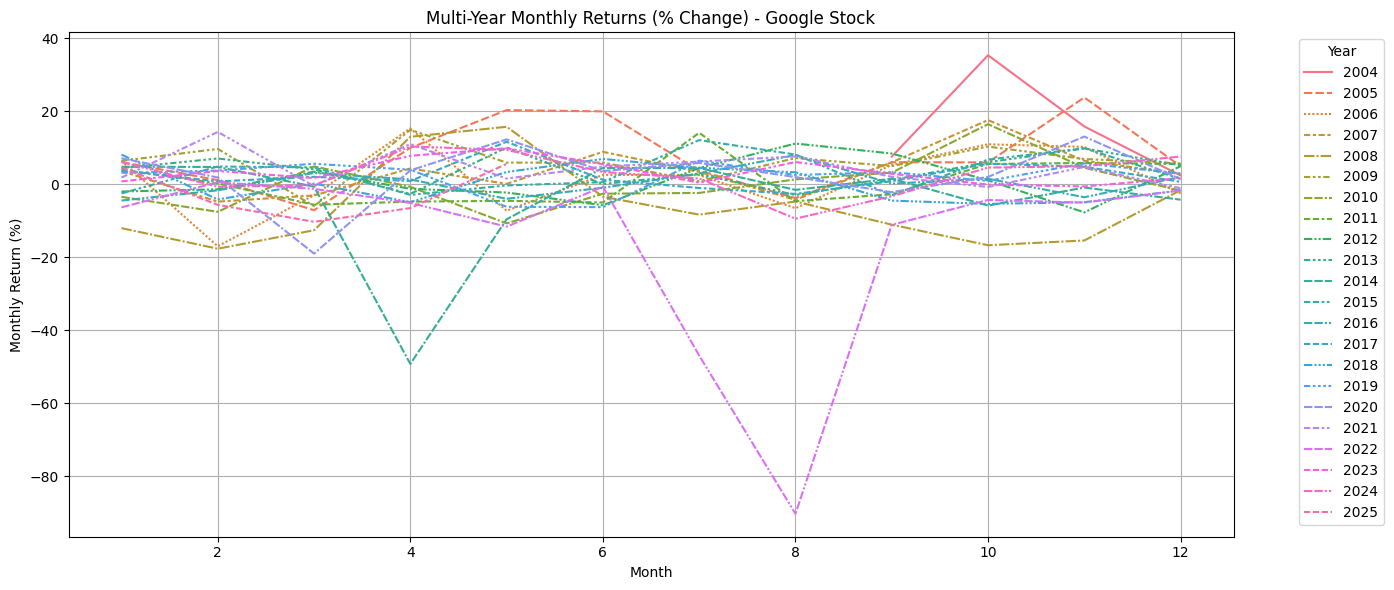
Multi-Year Averages: Return and Volume Patterns
October (+4.65%) and November (+4.21%) tend to deliver the highest monthly returns. August (–3.67%) and March (–1.89%) often underperform.
Volume is also seasonal. January, February, and October see the most trading activity, often tied to earnings announcements. August sees the lowest volume, reinforcing its pattern of poor returns.
These long-term patterns help investors avoid weak periods and take advantage of strong ones.
Summary Table: Best Months to Buy and Sell
| Strategy | Best Months | Why It Matters |
|---|---|---|
| Buy Opportunities | Aug–Sep, post-earnings | Prices dip, potential for rebound |
| Sell Opportunities | Feb–Jun, Oct–Nov | Historically strong returns, momentum |
Final Takeaways
- Use moving averages to spot long-term growth or slowdown.
- Watch for volume spikes—they often signal future price movement.
- Avoid chasing prices during earnings seasons without a plan.
- Consider buying in August or September and selling into Q1 and Q2 strength.
- Use patterns from past years to guide future decisions.
This data-driven approach helps retail investors make more confident, well-timed decisions—without needing a deep background in statistics.