99.5%
Model R-Squared
Regression model explains 99.5% of revenue variation, providing high confidence in subcategory driver identification
37%
Top Driver Influence
Wearable Accessories account for 37% of total revenue impact, making it the single most critical subcategory
+0.52
Marginal Impact Units
A 10% increase in Wearable Accessories sales generates +0.52 units of additional total revenue
1.35M
Baseline Weekly Forecast
Projected stable average weekly revenue of $1.35M, providing baseline for planning and budgeting
Key Revenue Driver Insights
Exceptional Model Performance
The regression model achieved an R² of 0.995, meaning it explains about 99.5% of weekly revenue variation. This exceptional fit gives high confidence that the selected subcategories are the true drivers of store performance, with statistically significant coefficients for Sportswear, Women's Wear, Accessories, Home Appliances, Laptops, Storage, TVs & Audio, and Footwear.
Clear Revenue Hierarchy
Wearable Accessories dominate with 37% influence, followed by Sportswear and Footwear together explaining 30% of total impact. This concentration means merchandising managers should prioritize these three subcategories for shelf space, promotions, and supplier negotiations to maximize revenue growth.
Varied Marginal Impact
A 10% sales increase shows dramatically different effects across subcategories: Wearable Accessories (+0.52 units), Sportswear (+0.21), Home Appliances (+0.12), while Footwear shows negative cannibalization effect (-0.20). This guides promotion budget allocation toward subcategories with highest marginal returns.
Distinct Seasonal Patterns
Revenue shows clear Q4 peaks driven by holiday shopping, with Laptops and Women's Wear amplifying these seasonal surges while Sportswear provides steady year-round stability. This dual pattern enables managers to plan inventory strategically—reliable base from Sportswear, peak capture from seasonal amplifiers.
Strategic Variable Selection
Variables were selected based on correlation strength above 0.97 with total revenue, focusing on subcategories rather than broad categories to avoid double-counting. This approach balances statistical power with practical business relevance, highlighting where merchandising actions like pricing, promotions, and space allocation can have measurable impact.
Revenue Analysis Visualizations
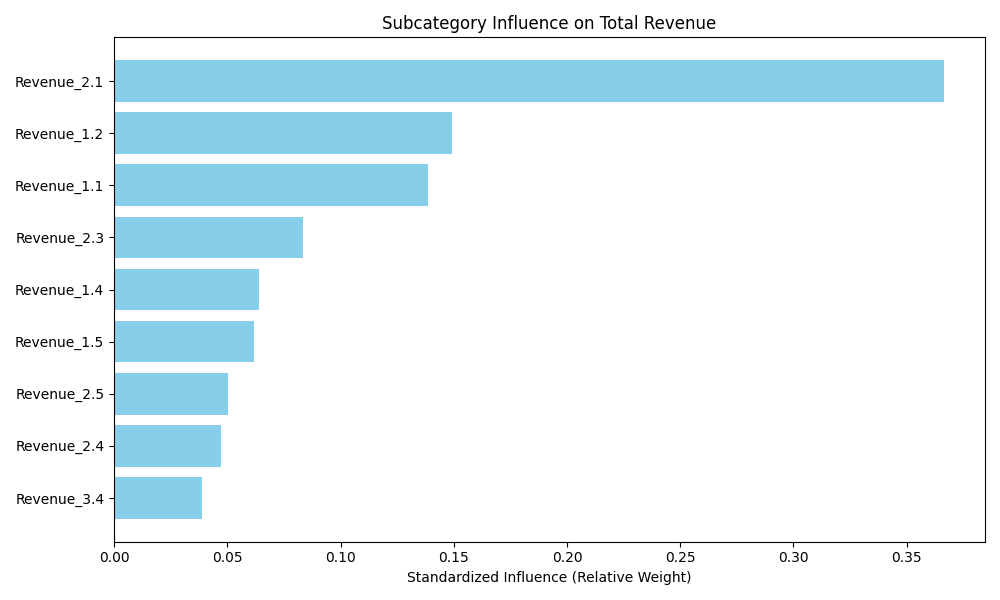
Subcategory Influence on Total Revenue
Wearable Accessories leads with 37% influence on total revenue, making it the critical focus area. Sportswear and Footwear combine for 30%, while other subcategories play supporting roles. This hierarchy directly guides where to allocate merchandising resources for maximum impact.
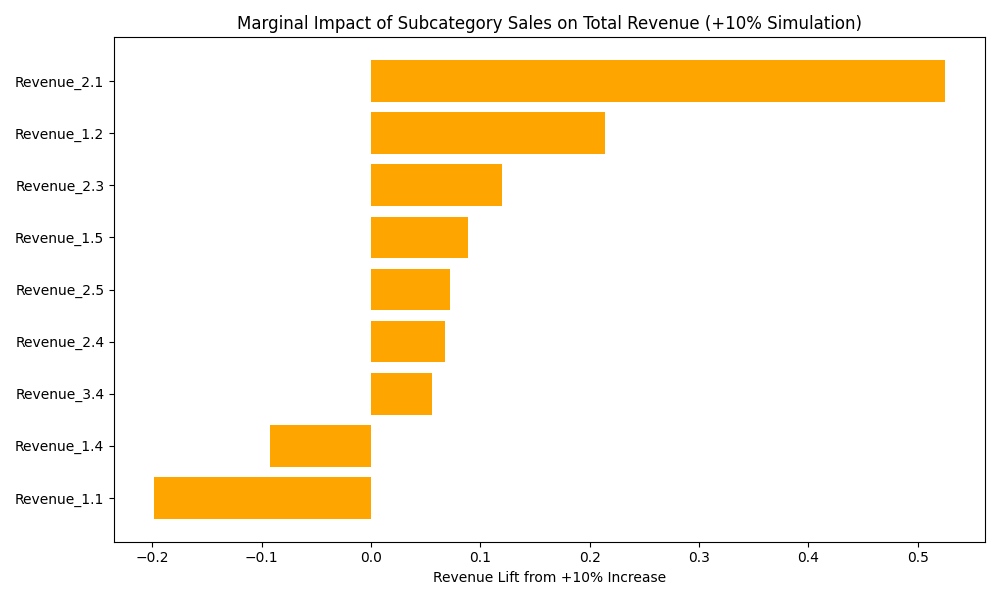
Marginal Impact of Subcategory Sales
Shows how a 10% sales increase in each subcategory affects total revenue. Wearable Accessories delivers the strongest lift (+0.52 units), followed by Sportswear (+0.21) and Home Appliances (+0.12). Footwear's negative impact (-0.20) suggests cannibalization requiring careful positioning.
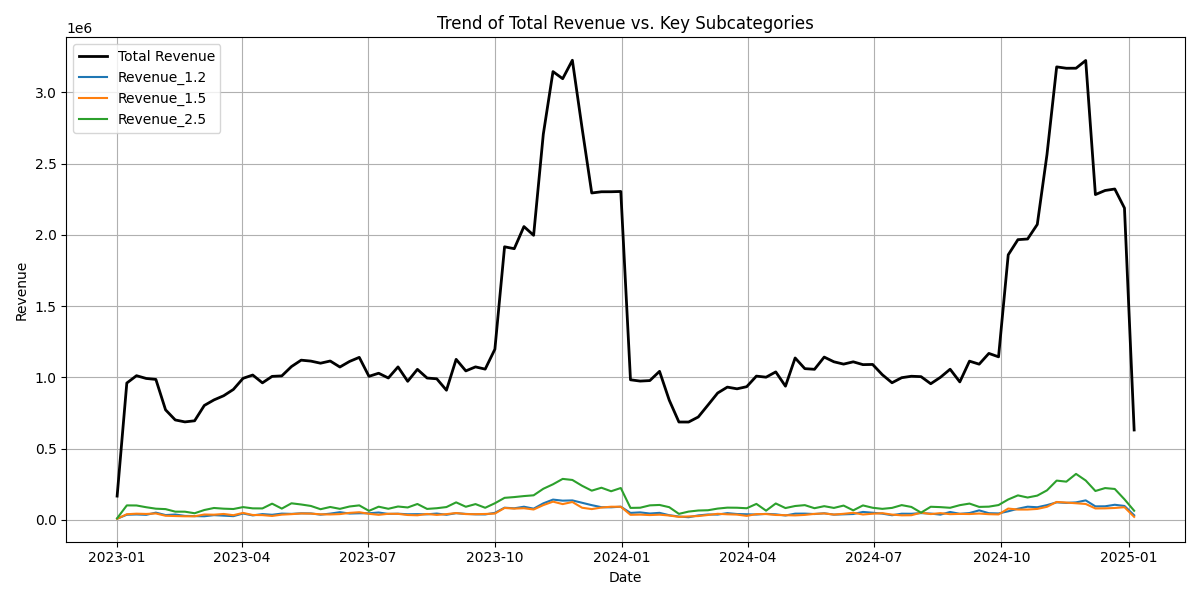
Revenue Trends and Seasonal Patterns
Total revenue exhibits clear Q4 peaks from holiday shopping, followed by Q1 declines. Laptops and Women's Wear amplify seasonal surges while Sportswear provides stable year-round performance. This pattern informs inventory planning—steady stock for Sportswear, peak preparation for seasonal amplifiers.
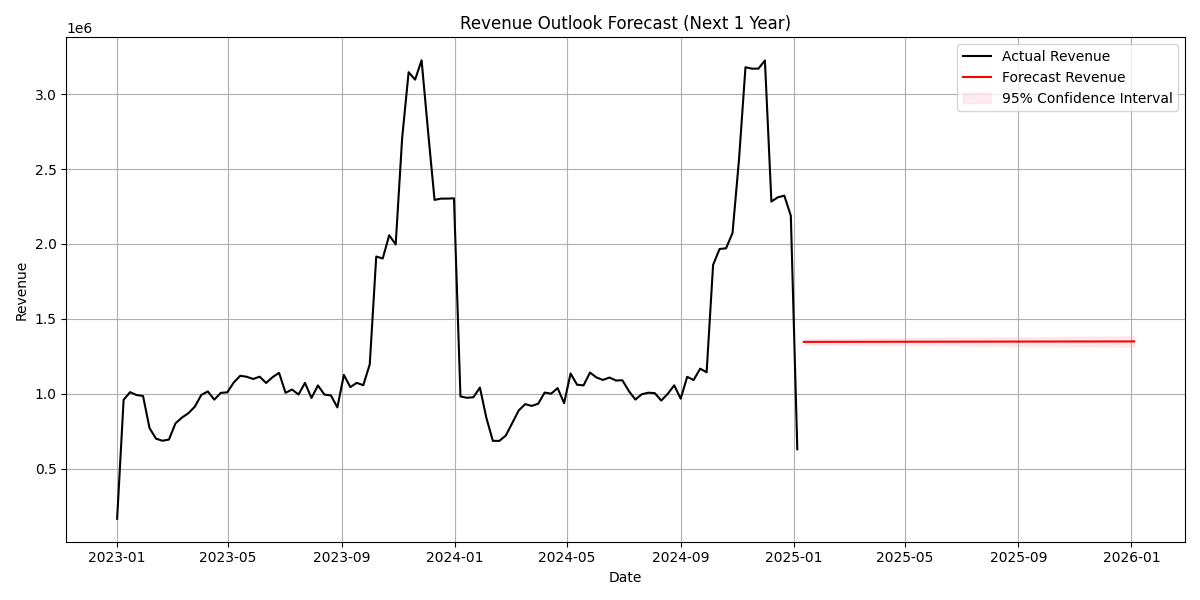
Revenue Outlook Forecast
Baseline forecast projects stable $1.35M average weekly revenue with narrow confidence bands. The flat projection reflects average subcategory effects without full seasonal cycles. Actual results will likely exceed this baseline during holidays and promotions, making it useful for conservative planning.
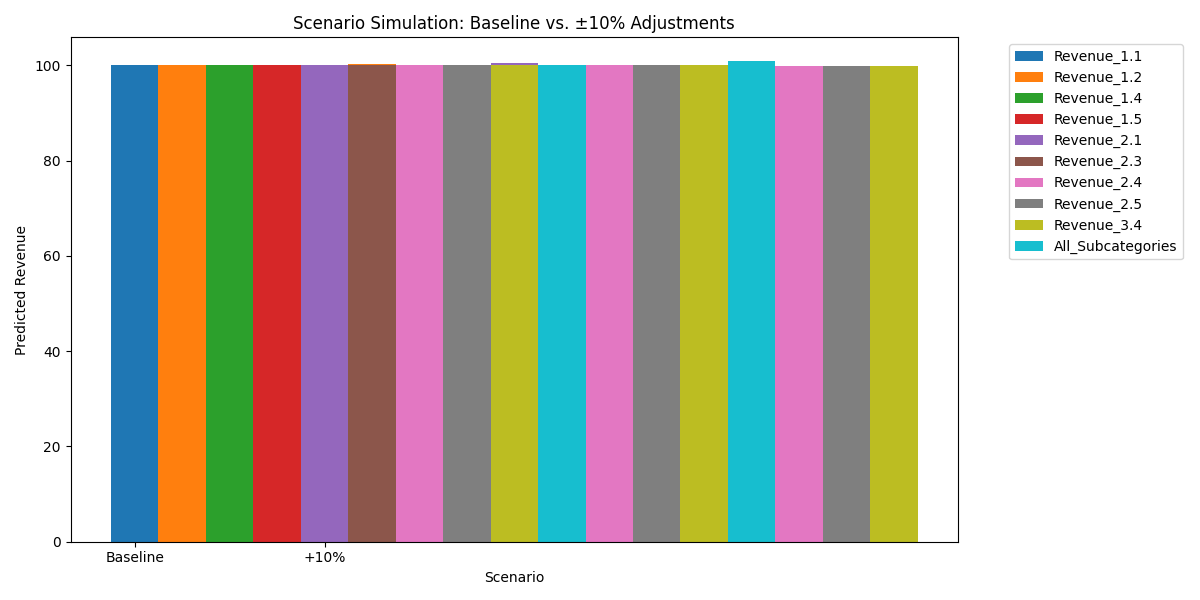
Scenario Simulation Analysis
Testing ±10% changes reveals that broad-based promotions across all subcategories deliver larger gains than single-category focus. While Wearable Accessories has strongest individual impact, coordinated actions across multiple subcategories maximize total revenue growth through cumulative effects.