Spotting the customers about to walk away.Illustration · Data Stories Lab
Customer Retention
Before They Leave
Support calls and inactivity flag who will leave
Data Stories LabAnalyst report1,000 customers · card portfolio
This report reads 1,000 card customers to answer one practical question for the retention manager: which customers are most likely to leave, and how can the bank spot them in time to act? Each record holds how long the customer has been with the bank, their monthly spend, how many products they hold, how often they called support, and whether the account is still active.
The findings below identify the clearest warning signs, show how much each one raises the chance of leaving, and test how well the riskiest customers can be picked out in advance.
The numbers
8.0%
of customers leave
5x
more likely to leave after repeated calls
3x
more likely if inactive
65%
of leavers in the top 20% riskiest
“Customers do not leave without warning: a few visible signs mark out who is at risk.”
What the data shows
1. What is the clearest warning sign a customer will leave?
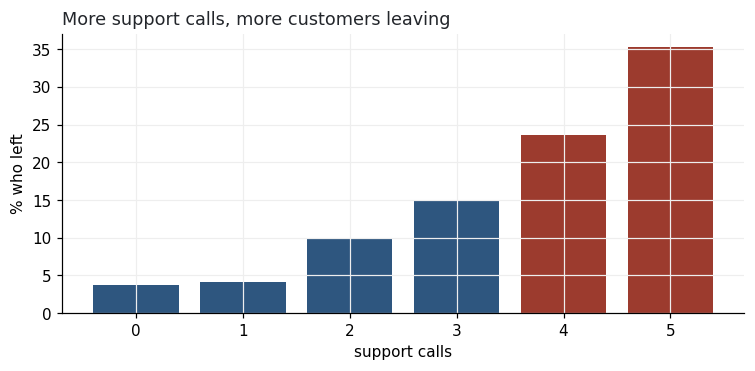
Repeated calls to support are the strongest signal. Customers who called three or more times left at 19%, against 4% for those who rarely called, about 5 times more likely to go.
A string of support calls is not just a service issue, it is an early warning that the relationship is breaking. By the time the calls pile up, the customer is often already deciding to leave.
Treat three or more support calls as a red flag, and route those customers to a callback that resolves the issue and rebuilds goodwill before they walk.
2. Do inactive customers leave more?
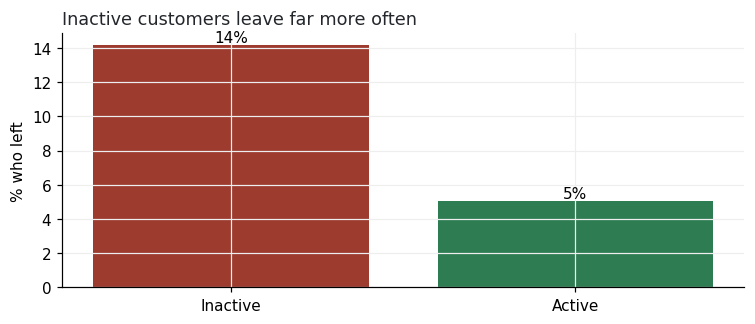
Clearly. Customers whose accounts had gone quiet left at 14%, about 3 times the 5% rate among active ones. Inactivity is one of the sharpest dividing lines in the whole book.
A dormant account is a customer drifting away, often quietly, without a complaint to flag them. Left alone, many simply close the account when something better comes along.
Watch for accounts going quiet and re-engage them early, with a relevant offer or a simple check-in, while there is still a relationship to save.
3. Are newer customers riskier than long-standing ones?
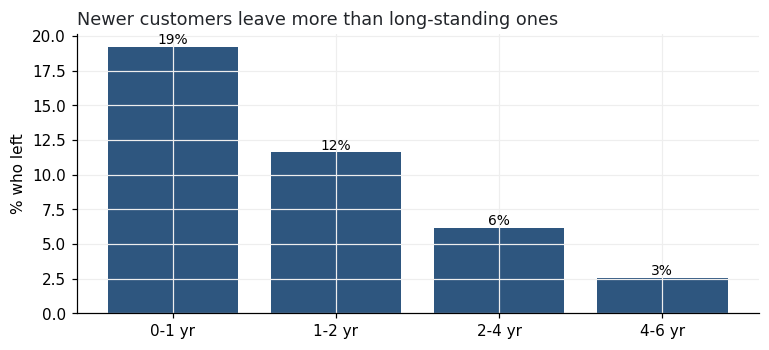
Yes. Customers in their first year left at 19%, against 3% for those past their fourth year. Loyalty builds with time, and the early months are the most fragile.
The first year is where the relationship is won or lost. A customer who has stayed for years has shown they are settled, while a new one is still deciding whether to commit.
Put the strongest onboarding and early attention into the first months, when a small effort prevents an early loss.
4. Does holding more products keep customers?
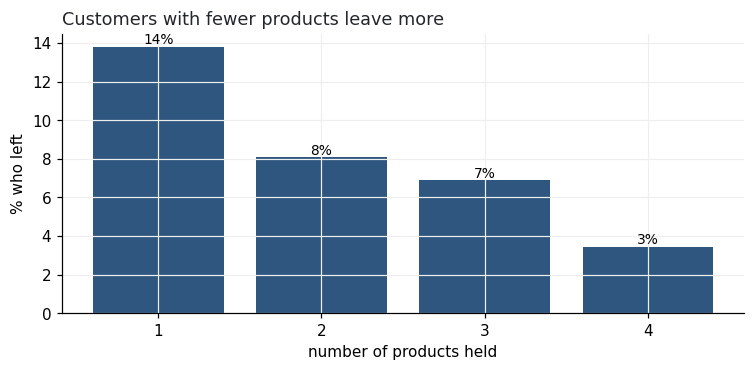
It does, strongly. Customers with just one product left at 14%, while those holding three or more left at only 5%. Each extra product roughly halves the chance of leaving.
More products mean more reasons to stay and more cost to switch away. A single-product customer has the least tying them to the business and is the easiest to lose.
Deepen single-product relationships with a relevant second product, which both raises value and reduces the risk of losing them.
5. Putting it together, what raises the chance of leaving most?
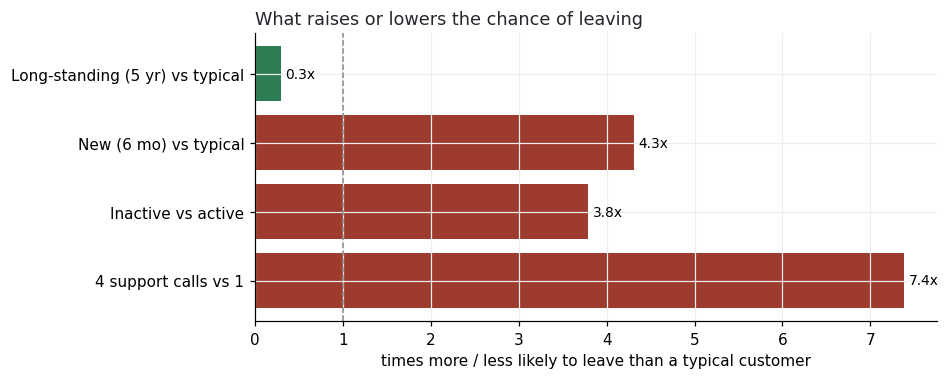
The risks stack. Against a settled customer, repeated support calls raise the chance of leaving about 5 times, going inactive about 3 times, and being new adds further risk, while extra products and years of tenure pull it back down.
A customer carrying several of these signs at once, new, inactive, one product and calling support, is in real danger of leaving, even though none of the signs alone is unusual.
Score every customer on these few signs together rather than one at a time, so the genuinely high-risk ones rise to the top of the list.
6. Can the bank tell in advance who is about to leave?
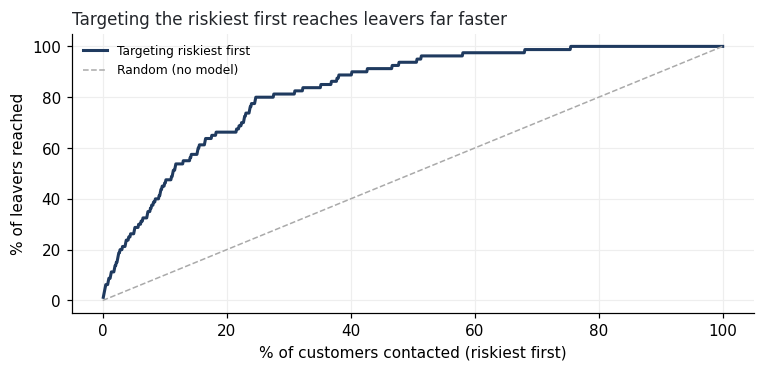
Well enough to act. Ranking customers by these warning signs and contacting the riskiest first reaches leavers far faster than working at random: the top fifth of the list by risk contains about 65% of everyone who actually leaves.
This turns retention from a guessing game into a focused effort. Instead of spreading attention across the whole base, the team can concentrate on the small group where most of the losses sit.
Work a monthly watchlist of the highest-risk customers, focusing retention budget and calls where they will save the most accounts.
Method & data
This report is based on 1,000 card customers, each recording tenure, monthly spend, number of products, support calls and whether the account is active. About 8.0% had left, so the analysis was set up to handle that imbalance and was judged on how well it ranks risk rather than on raw accuracy. We measured how much each sign changes the chance of leaving while holding the others steady, then scored and ranked every customer. The ranking placed about 65% of actual leavers in the top fifth and caught roughly three in four leavers when the riskiest were contacted. The numbers should be read as well-grounded estimates, not exact predictions for any individual.
Conclusion
Customers do not leave without warning. A handful of visible signs, repeated support calls, an account going quiet, being new, and holding only one product, mark out who is at risk, and they stack: a customer with several signs at once is in real danger of leaving.
Because these signs are already in the bank's records, the customers most likely to go can be found in advance. Ranking the base by risk puts about 65% of all leavers in the top fifth, so retention effort aimed there saves far more accounts per call than spreading it evenly.
The clear direction is to run a monthly high-risk watchlist built from these signs, and focus callbacks, offers and onboarding on the customers it flags.