Evaluating Store Customer Experience
How Data Shows Where Managers Should Act
Overview
Regional managers oversee many stores, but problems are not always obvious. Some stores fall behind while others perform well, making it difficult to know where to focus time and effort. Without clear comparisons, managers risk checking every store instead of fixing the few that truly need attention.
This analysis shows which stores are underperforming, why it is happening, and what action will have the biggest impact. By comparing stores against regional averages and breaking results down by customer journey stage, it helps regional managers focus on the right issues, take targeted action, and improve performance efficiently.
Data Sources and Methodology
This report is based on customer experience data from 43 retail stores across 7 regions in Malaysia, collected through structured mystery shopping visits. Each visit reviewed the full customer journey, from booking to checkout, using a consistent set of questions so that stores could be compared fairly across regions.
The analysis focuses on how well each store executes key parts of the customer journey. We examined overall experience scores, journey stage results, compliance and promotion execution, and how each store compares with its regional average. This makes it clear not only which stores are underperforming, but also the size of the gap.
The data comes from a single assessment period, so the focus is on relative performance rather than trends over time. Simple statistical techniques were used to separate normal variation from real problems, helping identify whether issues are isolated to specific stores or shared more broadly. The goal is to highlight where performance breaks down and where management effort will have the biggest impact.
1. Where do we stand on customer experience across regions?
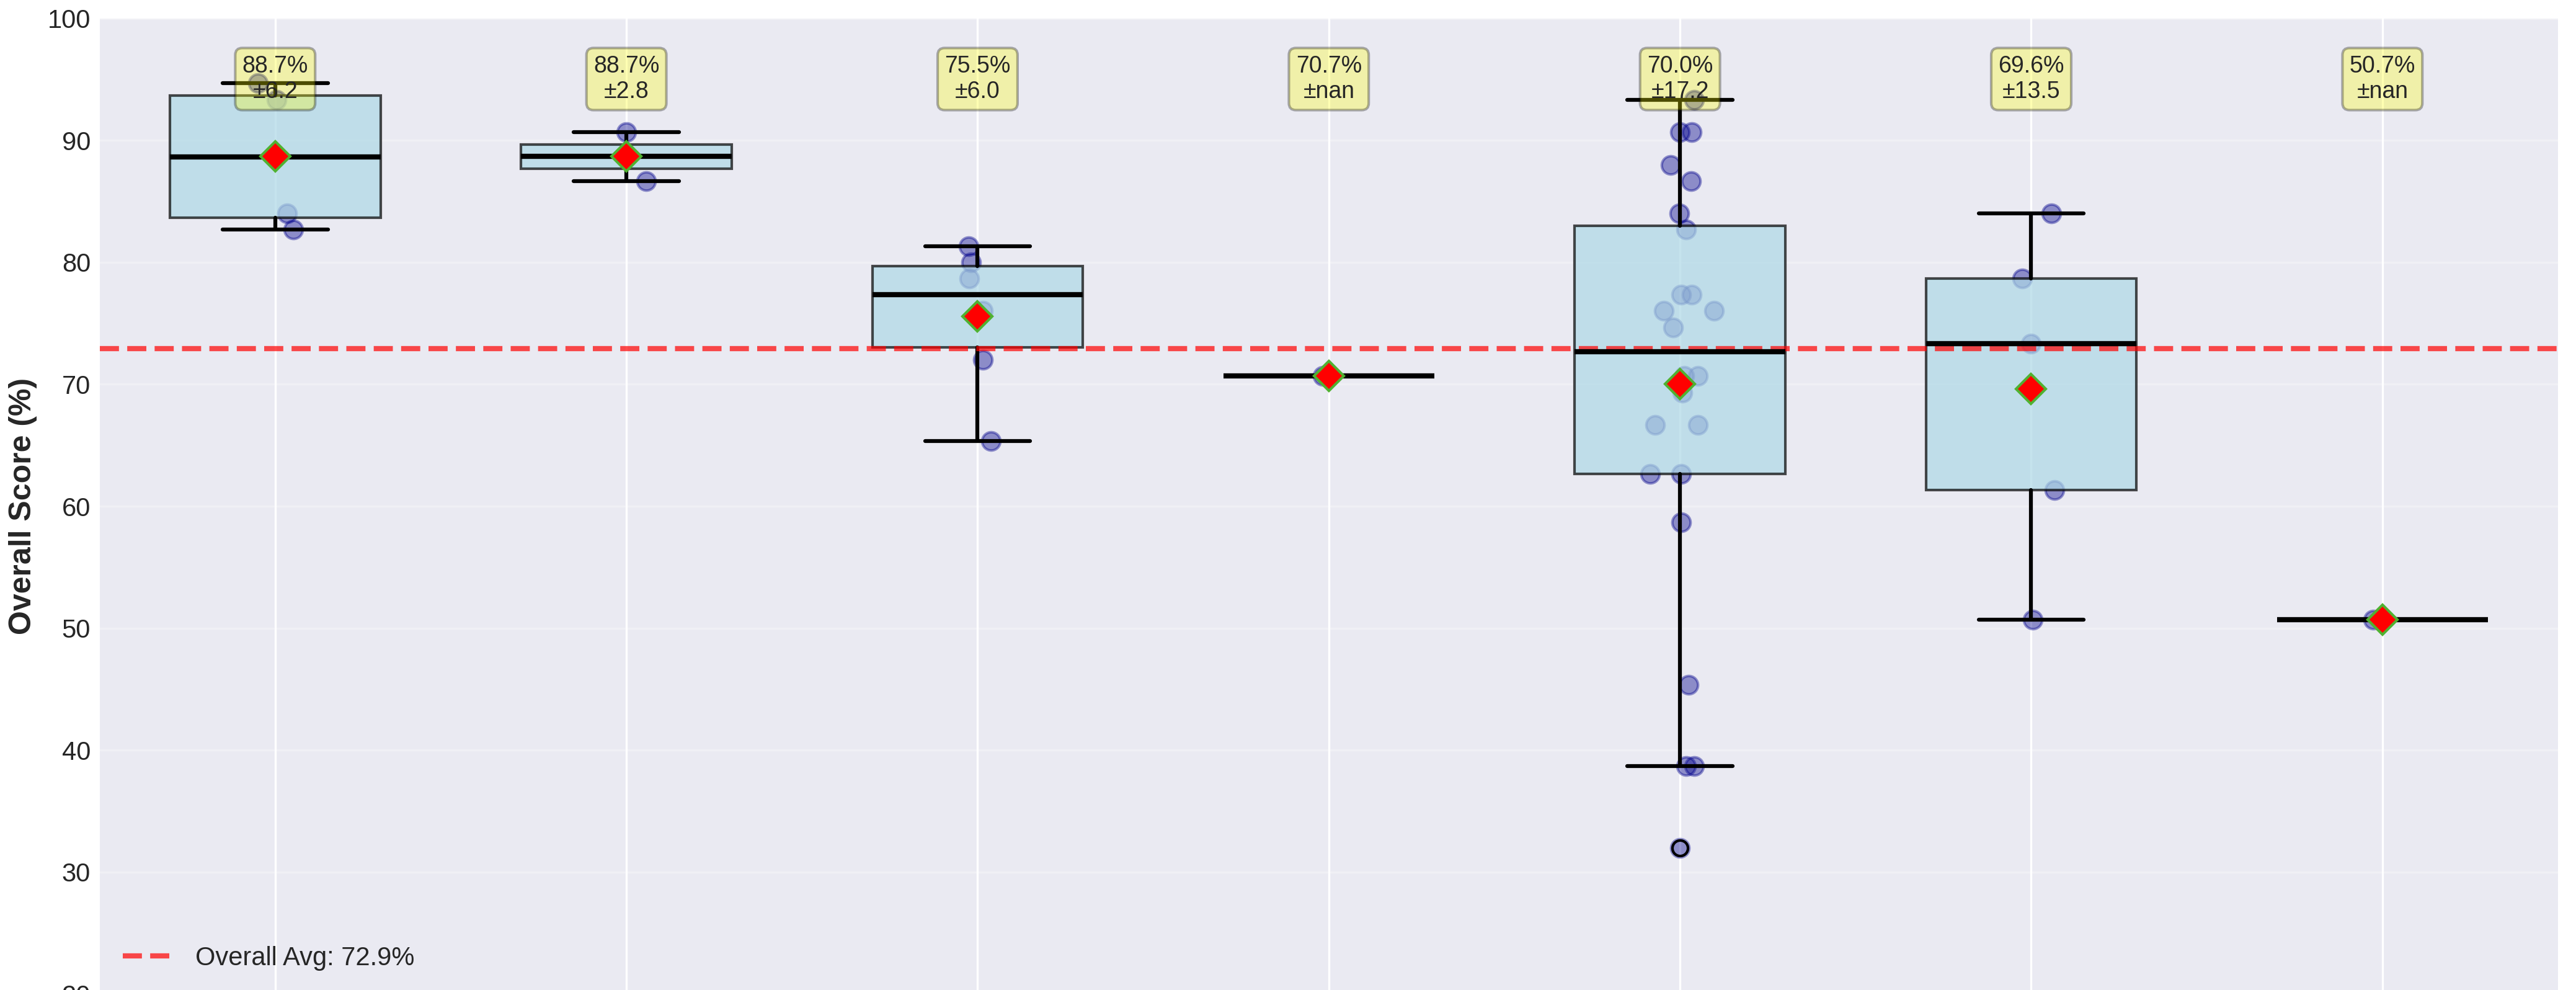
The overall average score is 72.9%, which sets a reasonable baseline across stores in Malaysia. George Town (Penang) and Melaka stand out clearly, both averaging 88.7%, with all stores in these locations performing consistently well. These two locations show what strong execution looks like and can be used as internal benchmarks for other regions.
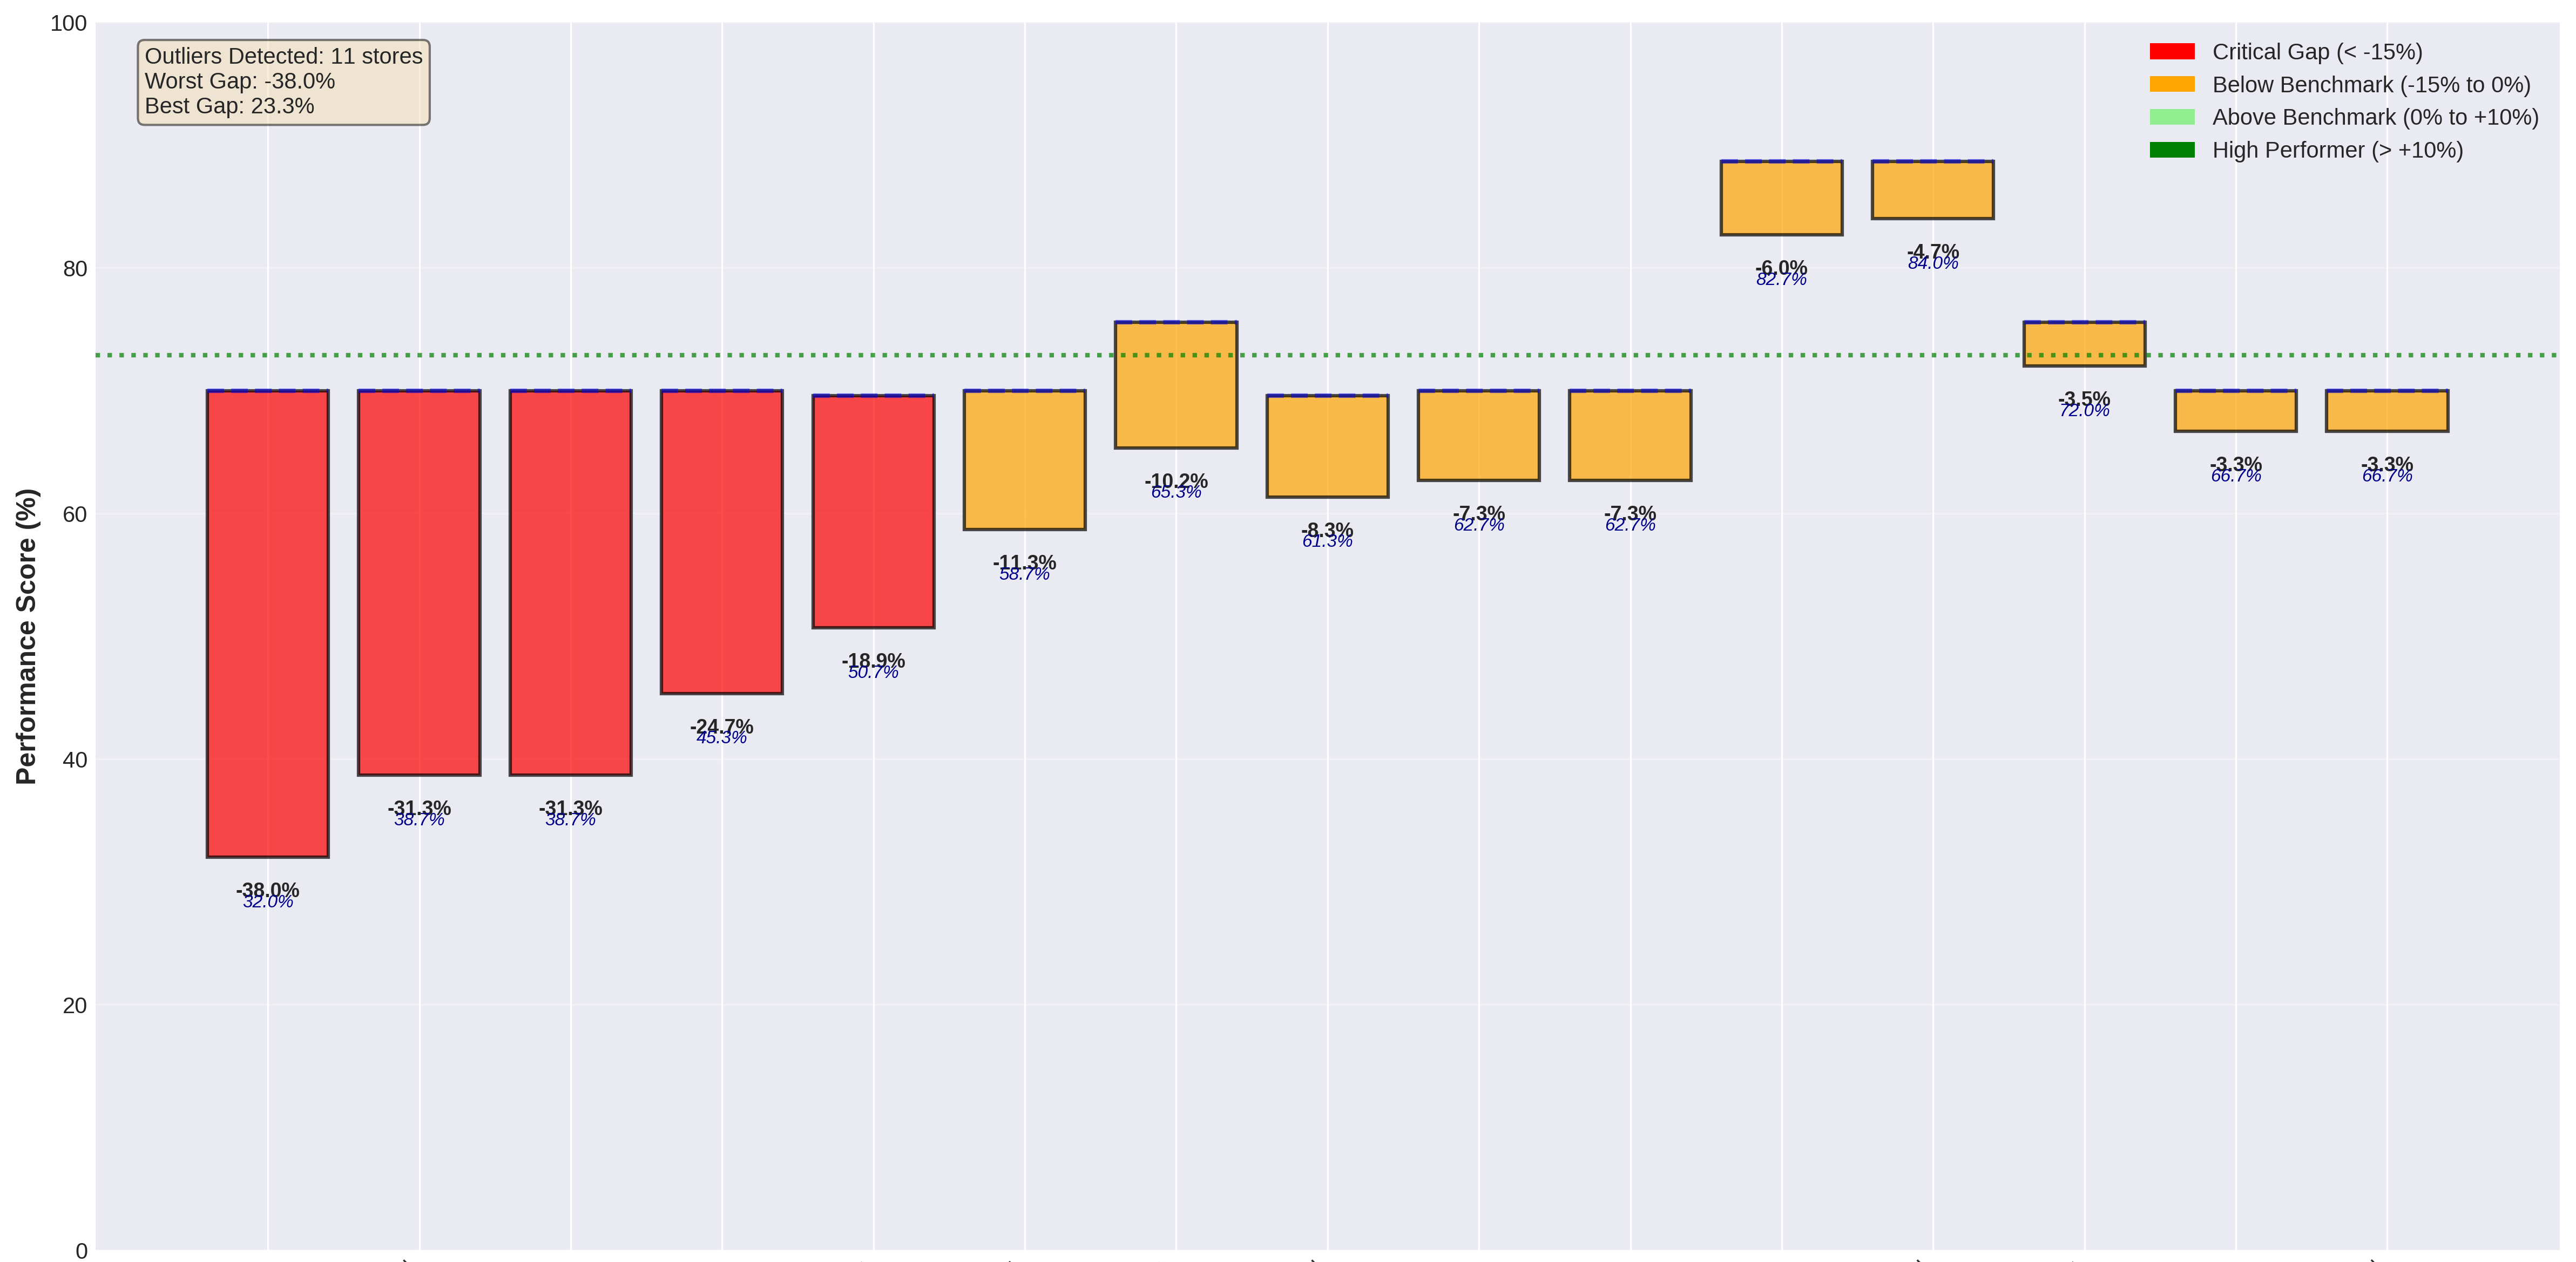
Most other locations sit around the acceptable range. Petaling Jaya (75.5%) and Ipoh (70.7%) are broadly stable, while Kuala Lumpur (69.6%) and Other Locations (70.0%) fall slightly below the overall average. The bigger concern is inconsistency, especially within the "Other Locations" group, where store scores range from 93.3% down to 32.0%, suggesting uneven standards rather than a single shared issue. Kota Bharu, represented by a single store scoring 50.7%, is clearly underperforming and requires attention.
In practical terms, stores scoring above 80% are performing well and can serve as examples, 70-80% should be monitored, 60-70% need coaching, and anything below 60% signals the need for urgent action.
2. Which stores need attention, and how widespread is the problem?
Only 4 stores (9% of the network) qualify as true statistical outliers, with performance gaps greater than 15 percentage points below their regional averages. The most severe case scores 32.0%, sitting 38 points below its regional benchmark. Several other stores fall below benchmark but remain within normal variation, suggesting performance drift rather than a complete breakdown.
At the other end, strong performers such as Suria KLCC (94.7%), Pavilion Kuala Lumpur (93.3%), and Mid Valley Megamall (93.3%) show that high-quality execution is achievable under current systems. Overall, 65% of stores perform within plus or minus 10% of their regional average, confirming that the network is largely stable and that poor performance is concentrated in a small number of locations rather than being widespread.
This means the issue is not one of scale, but of focus. A small set of stores requires immediate management attention, while most of the network is operating within acceptable limits and does not require heavy intervention.
3. Are performance issues clustered by region or isolated?
Statistical testing shows no meaningful geographic clustering of underperformance (p-value 0.807). In simple terms, weak performance is not driven by region or regional leadership. Even in areas with higher underperformance rates, such as Kuala Lumpur (20.0%) and Other Locations (20.8%), underperforming stores are spread out rather than concentrated in one place.
There is, however, one clear pattern that cuts across locations. Greeting and engagement is weak in 34.9% of stores, affecting 15 locations across five regions. This points to a company-wide behaviour issue, not a problem tied to any single city or region. Other weak stages, such as booking, promotion explanation, and product selection, appear inconsistently and vary from store to store.
The implication is straightforward. Most issues should be handled through targeted, store-level action, while greeting behaviour should be addressed through a single, company-wide improvement effort rather than regional fixes.
4. What is actually driving performance gaps?
Three stages account for around 20% of the total performance gap, making them the most important areas to focus on. The largest driver is Product Selection, which contributes 11.0% of the gap and affects 30% of stores, with an average shortfall of nearly 25 points. This points to weaknesses in consultative selling, such as clearly explaining options, linking products to customer needs, and avoiding overly aggressive upselling.
The second driver is Promotion Explanation, responsible for 4.1% of the gap. While fewer stores are affected (19%), this stage carries the highest weight in the scoring model, so mistakes here have a disproportionate impact on overall performance. The third driver is Booking, which contributes 5.0% of the gap and is mainly driven by process issues rather than staff behaviour.
Focusing improvement efforts on these three stages will deliver the fastest and most measurable results. Other stages contribute far less to underperformance and should be treated as lower priority once these key areas are addressed.
5. Are the problems behavioural or process-related, and how should they be fixed?
Across the network, behavioural issues (28%) are more common than process issues (16%). This difference is even clearer among the most critical stores, where 75% of severe underperformance is driven by behaviour. Common problems include weak customer engagement, poor explanation of promotions, and rushed consultations. Process issues exist, but they play a smaller role and are usually easier to fix.
Behavioural problems take longer to address because they involve changing habits and skills. They typically require coaching, role-play, and follow-up mystery shopping over 6-8 weeks. Process issues, such as booking procedures or compliance steps, can usually be resolved within 1-2 weeks through clearer guidelines and stronger accountability.
This distinction is important because it shows where effort should be focused. For critical and "needs attention" stores, most resources should go into behavioural coaching, with quick process fixes used to support and reinforce those improvements.
6. Where should intervention start to deliver the fastest impact?
The highest return comes from fixing the most severe outliers first, while clearly separating quick wins from longer-term work. Four stores require immediate action, including one scoring 32.0% due to promotion failures and another at 38.7% linked to booking and greeting issues. These stores should be prioritised in the first two weeks, with close oversight from regional management.
Beyond these urgent cases, a small number of low-effort, high-impact improvements can be addressed quickly through focused training. A few high-effort, high-impact cases also exist and should be planned carefully, as they require more time and support. Importantly, no high-effort, low-impact actions were identified, which means management effort is unlikely to be wasted if priorities are followed.
In summary, the data supports a targeted approach: stabilise the most critical stores immediately, roll out a company-wide improvement in greeting behaviour, and address remaining gaps through focused, store-level coaching rather than broad regional programmes.
Conclusion
Overall performance across the network is stable, with 65% of stores meeting or exceeding acceptable standards. Poor performance is not widespread but limited to a small number of locations, with only four stores requiring urgent attention. This shows the core customer experience model is working, and the main challenge is focus rather than fixing the entire system.
The analysis also makes clear where improvements will matter most. Three customer journey stages account for about 20% of the total performance gap, giving managers a short and clear list of priorities. Most serious gaps are driven by staff behaviour, while process issues are fewer and quicker to fix. This helps ensure the right actions are taken for the right reasons.
The path forward is practical and achievable. By fixing the most critical stores first and rolling out focused training and coaching, the network can lift the average score from 72.9% to above 80% within a few months, and reach 85% or higher within six months by applying proven practices from top-performing regions. This approach balances quick wins with long-term improvement and supports consistent customer experience across all stores.