Spotting today’s cash cows and tomorrow’s winners.Illustration · Data Stories Lab
Retail & product strategy
From Cash Cows to Hidden Gems
Spot proven earners and the next winners
Data Stories LabAnalyst reportProduct sales · clustering
This analysis helps business owners see which products truly make money and which smaller ones could become the next big winners. Sales alone don't tell the whole story – some bestsellers earn little profit, while quieter products perform far better.
By studying 200,000 transactions, the report identifies Cash Cows (proven profit makers) and Hidden Gems (emerging performers). The goal is to give business owners clear, practical insights to decide where to focus inventory, pricing, and marketing – protecting today's profits while building tomorrow's growth.
The numbers
4 clusters
product groups
RM8.2m
cluster 3 revenue
iPhone 14
hidden gem
34 mo
to catch up
“This analysis turns sales data into a clear roadmap for smarter, profit-driven decisions.”
What the data shows
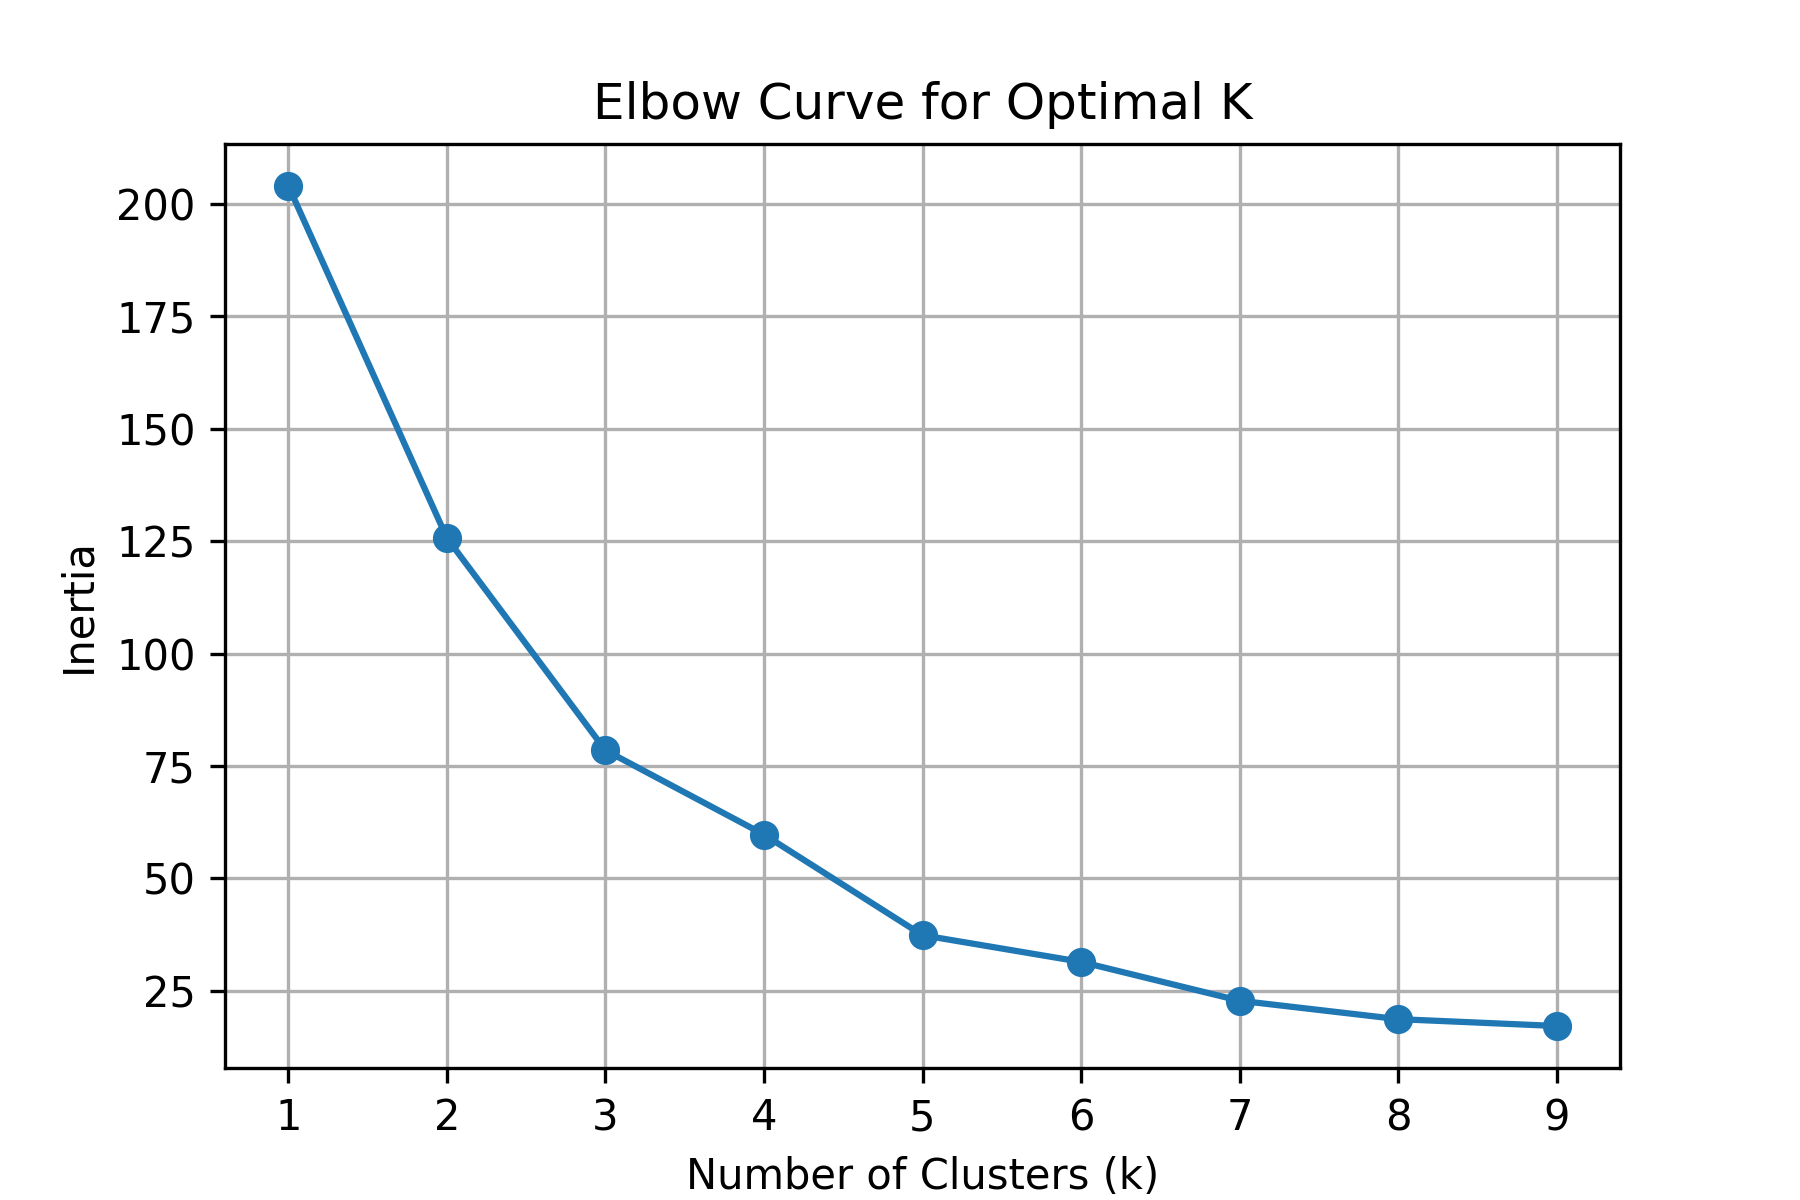
Q1: How do our products naturally group based on sales, profit, price, and quantity?
Our products fall into four clear performance groups based on sales, profit, price, and quantity. The analysis shows that products naturally cluster into Cash Cows (high sales and profit), Moderate Performers (steady sales but lower margins), Low Performers (weak in both), and Premium/Niche Products (high price, low volume).
This segmentation helps focus effort where it matters most. Cash Cows should get top priority in stock, promotion, and supplier planning. Moderate performers can be improved through pricing and marketing adjustments, while low performers may need repositioning or removal. Premium items, though smaller in volume, help maintain brand strength and attract high-value customers.
In short, clustering turns raw sales data into a clear view of product roles. Business owners can now direct investment toward proven winners, nurture moderate performers, and make informed choices about weaker products instead of spreading resources thin.
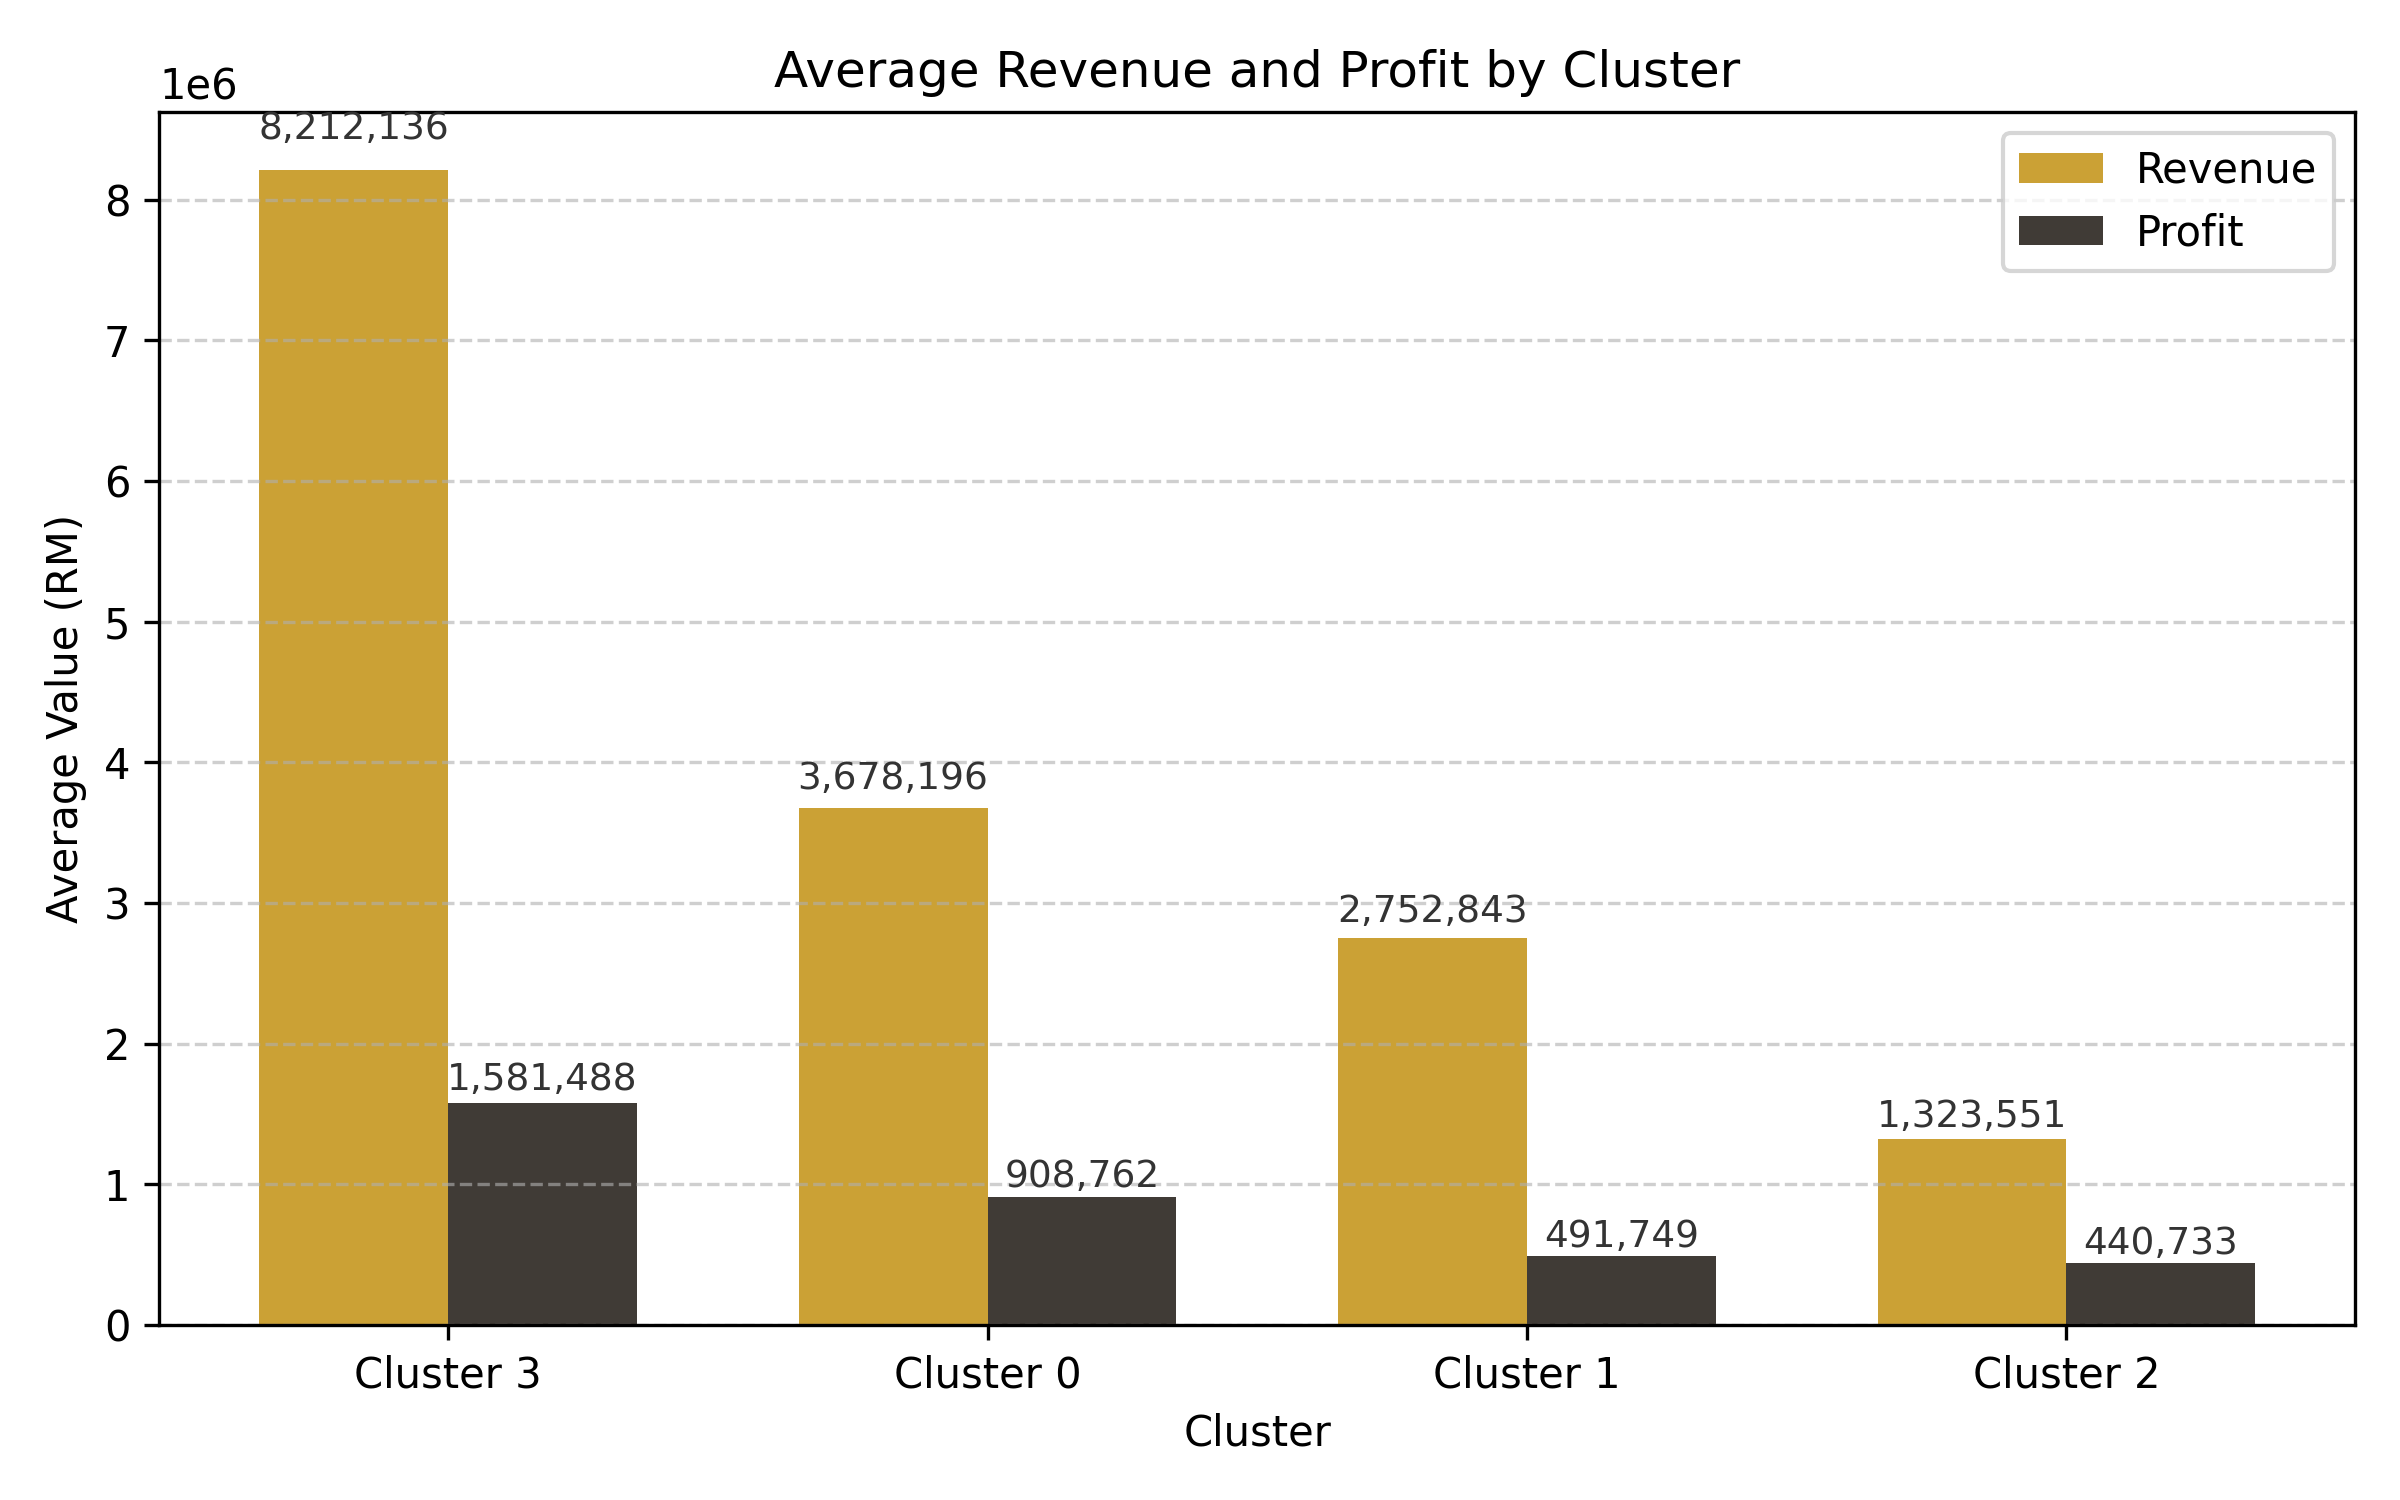
Q2: Which clusters represent truly profitable products?
The analysis shows that Cluster 3 is the strongest group, averaging RM8.2 million in revenue and RM1.6 million in profit per product. These are the company's true Cash Cows, combining strong sales and high margins. Clusters 0 and 1 show moderate results – steady sellers with either smaller margins or slower growth – while Cluster 2 lags behind with the weakest performance.
For business planning, this means Cluster 3 products deserve continued focus and protection. Cluster 0 holds potential for growth with more promotion or bundling, while Cluster 1 needs profit improvement before scaling further. Cluster 2 requires review – these products may need cost adjustments, repositioning, or phasing out.
This tiered view ensures investment follows performance. It keeps resources concentrated on the highest-return products while giving weaker performers a structured path to improve or exit.
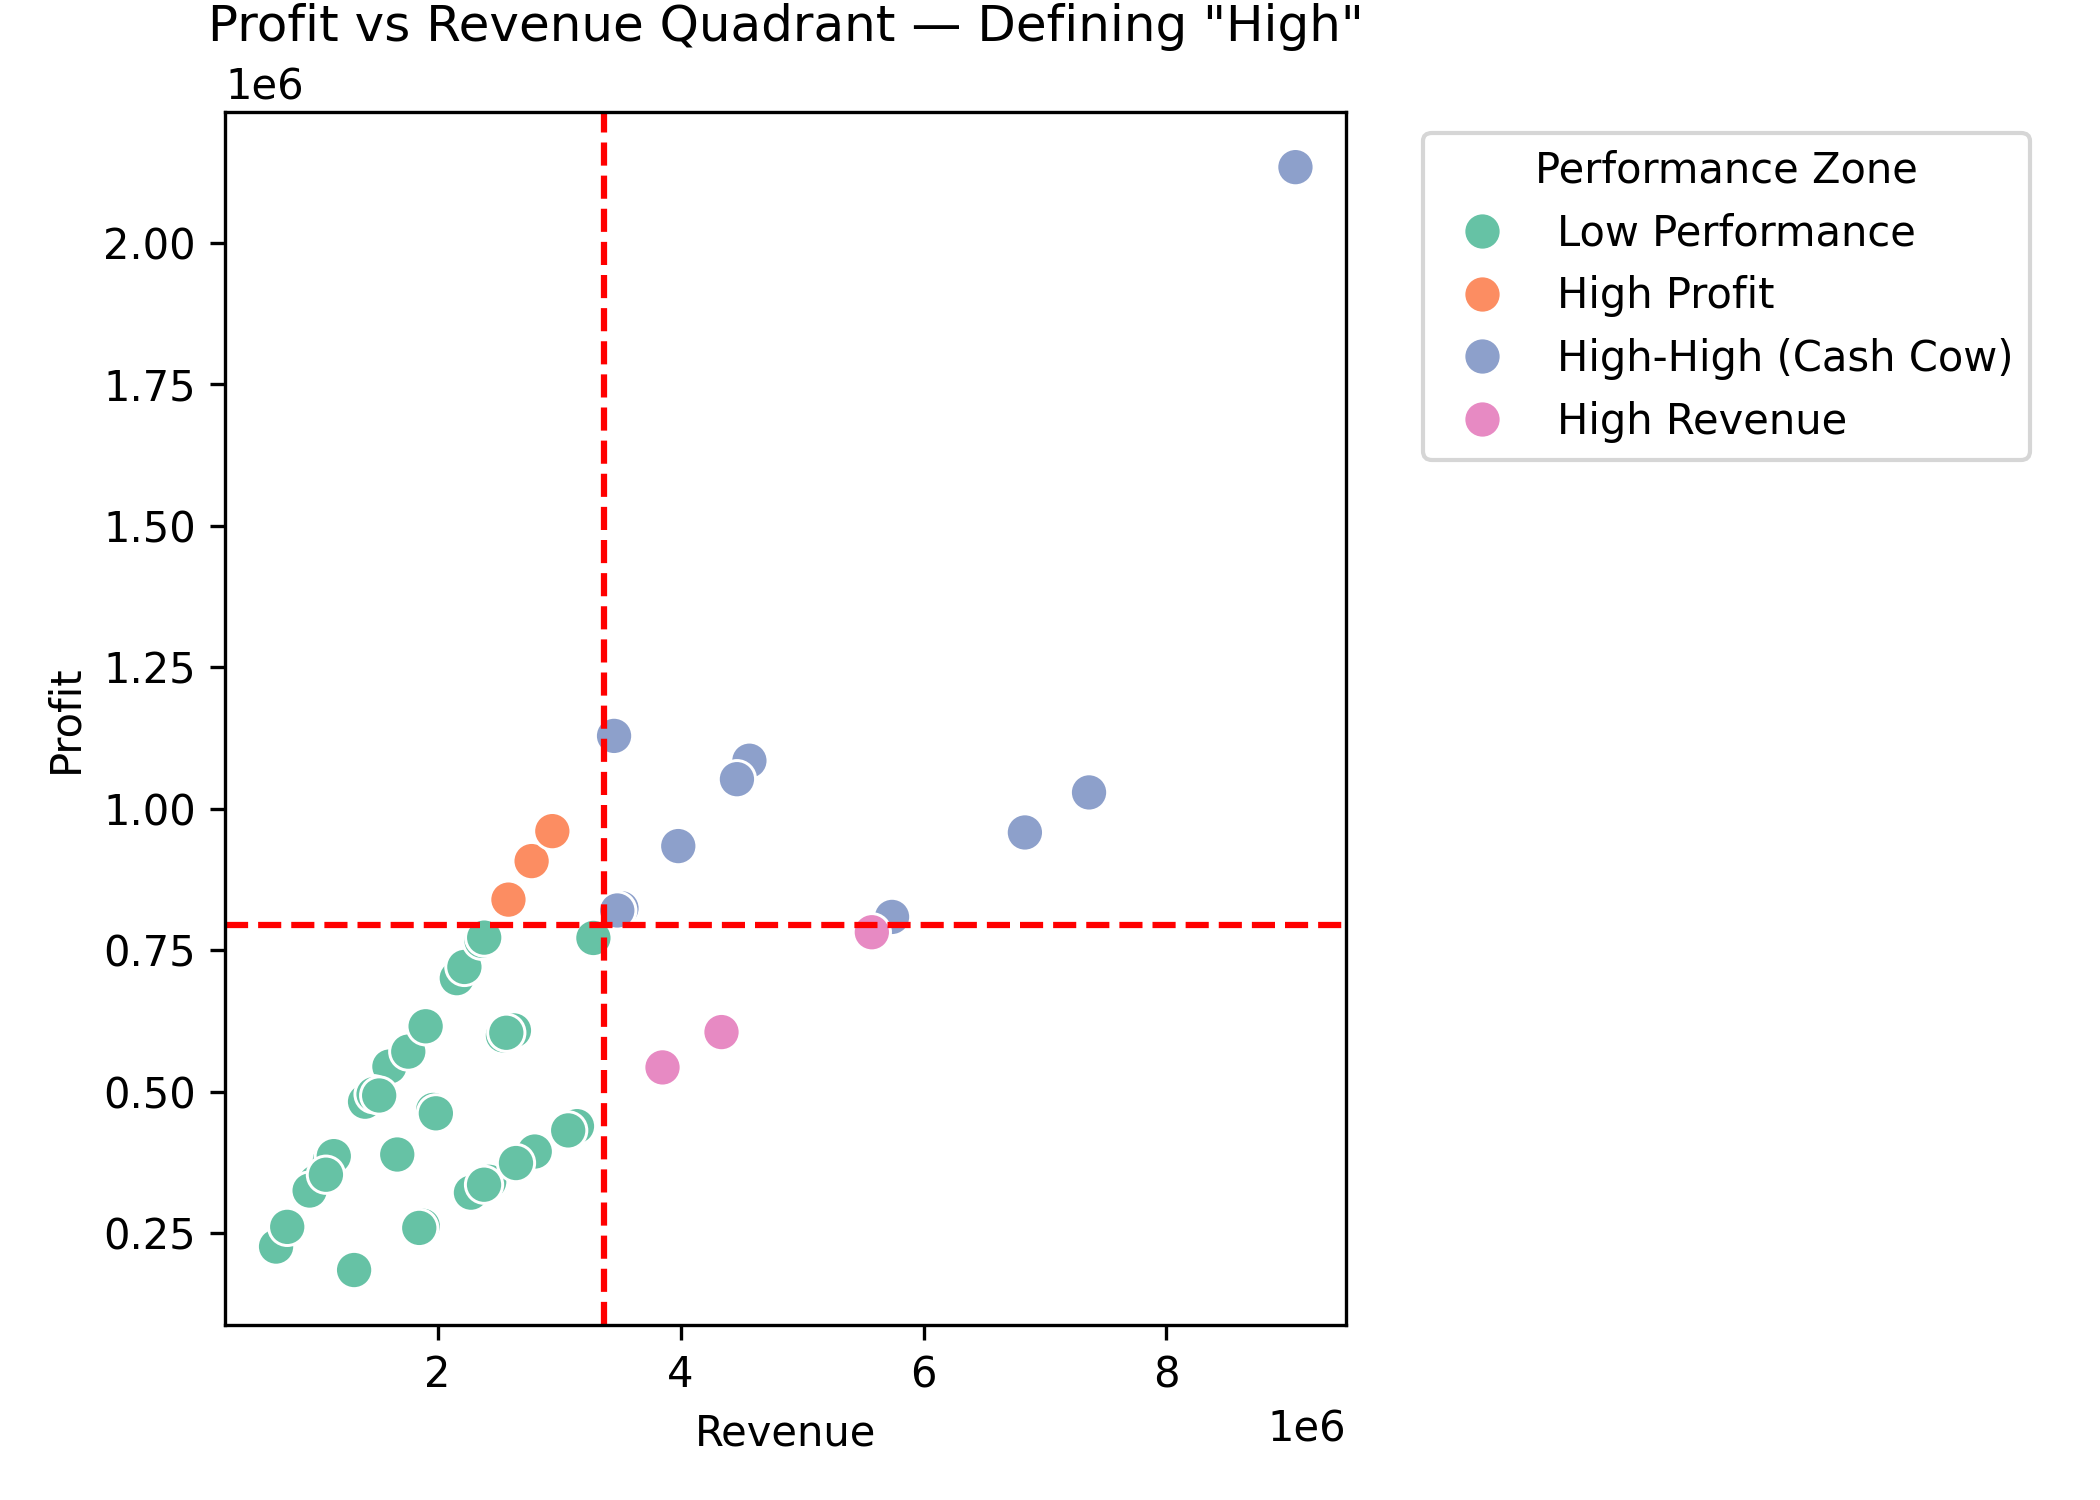
Q3: How can we define "high performance" in a data-driven way?
We define "high" performance using clear, statistical cutoffs rather than guesswork. Products in the top 25% for both revenue (RM5.8M+) and profit (RM800K+) qualify as high performers. This creates a simple quadrant: top-right products are Cash Cows, bottom-right are high-volume but low-margin, top-left are niche profit-strong, and bottom-left are low performers.
This framework replaces subjective judgment with consistent data rules. Managers can instantly see where each product stands and focus on improving those below the benchmark. The quadrant makes performance gaps easy to visualize and compare across teams.
By setting clear standards for "high," every department uses the same measure of success. It turns performance management from opinion-based to fact-based, helping ensure decisions on pricing, stock, and promotions are backed by real numbers.
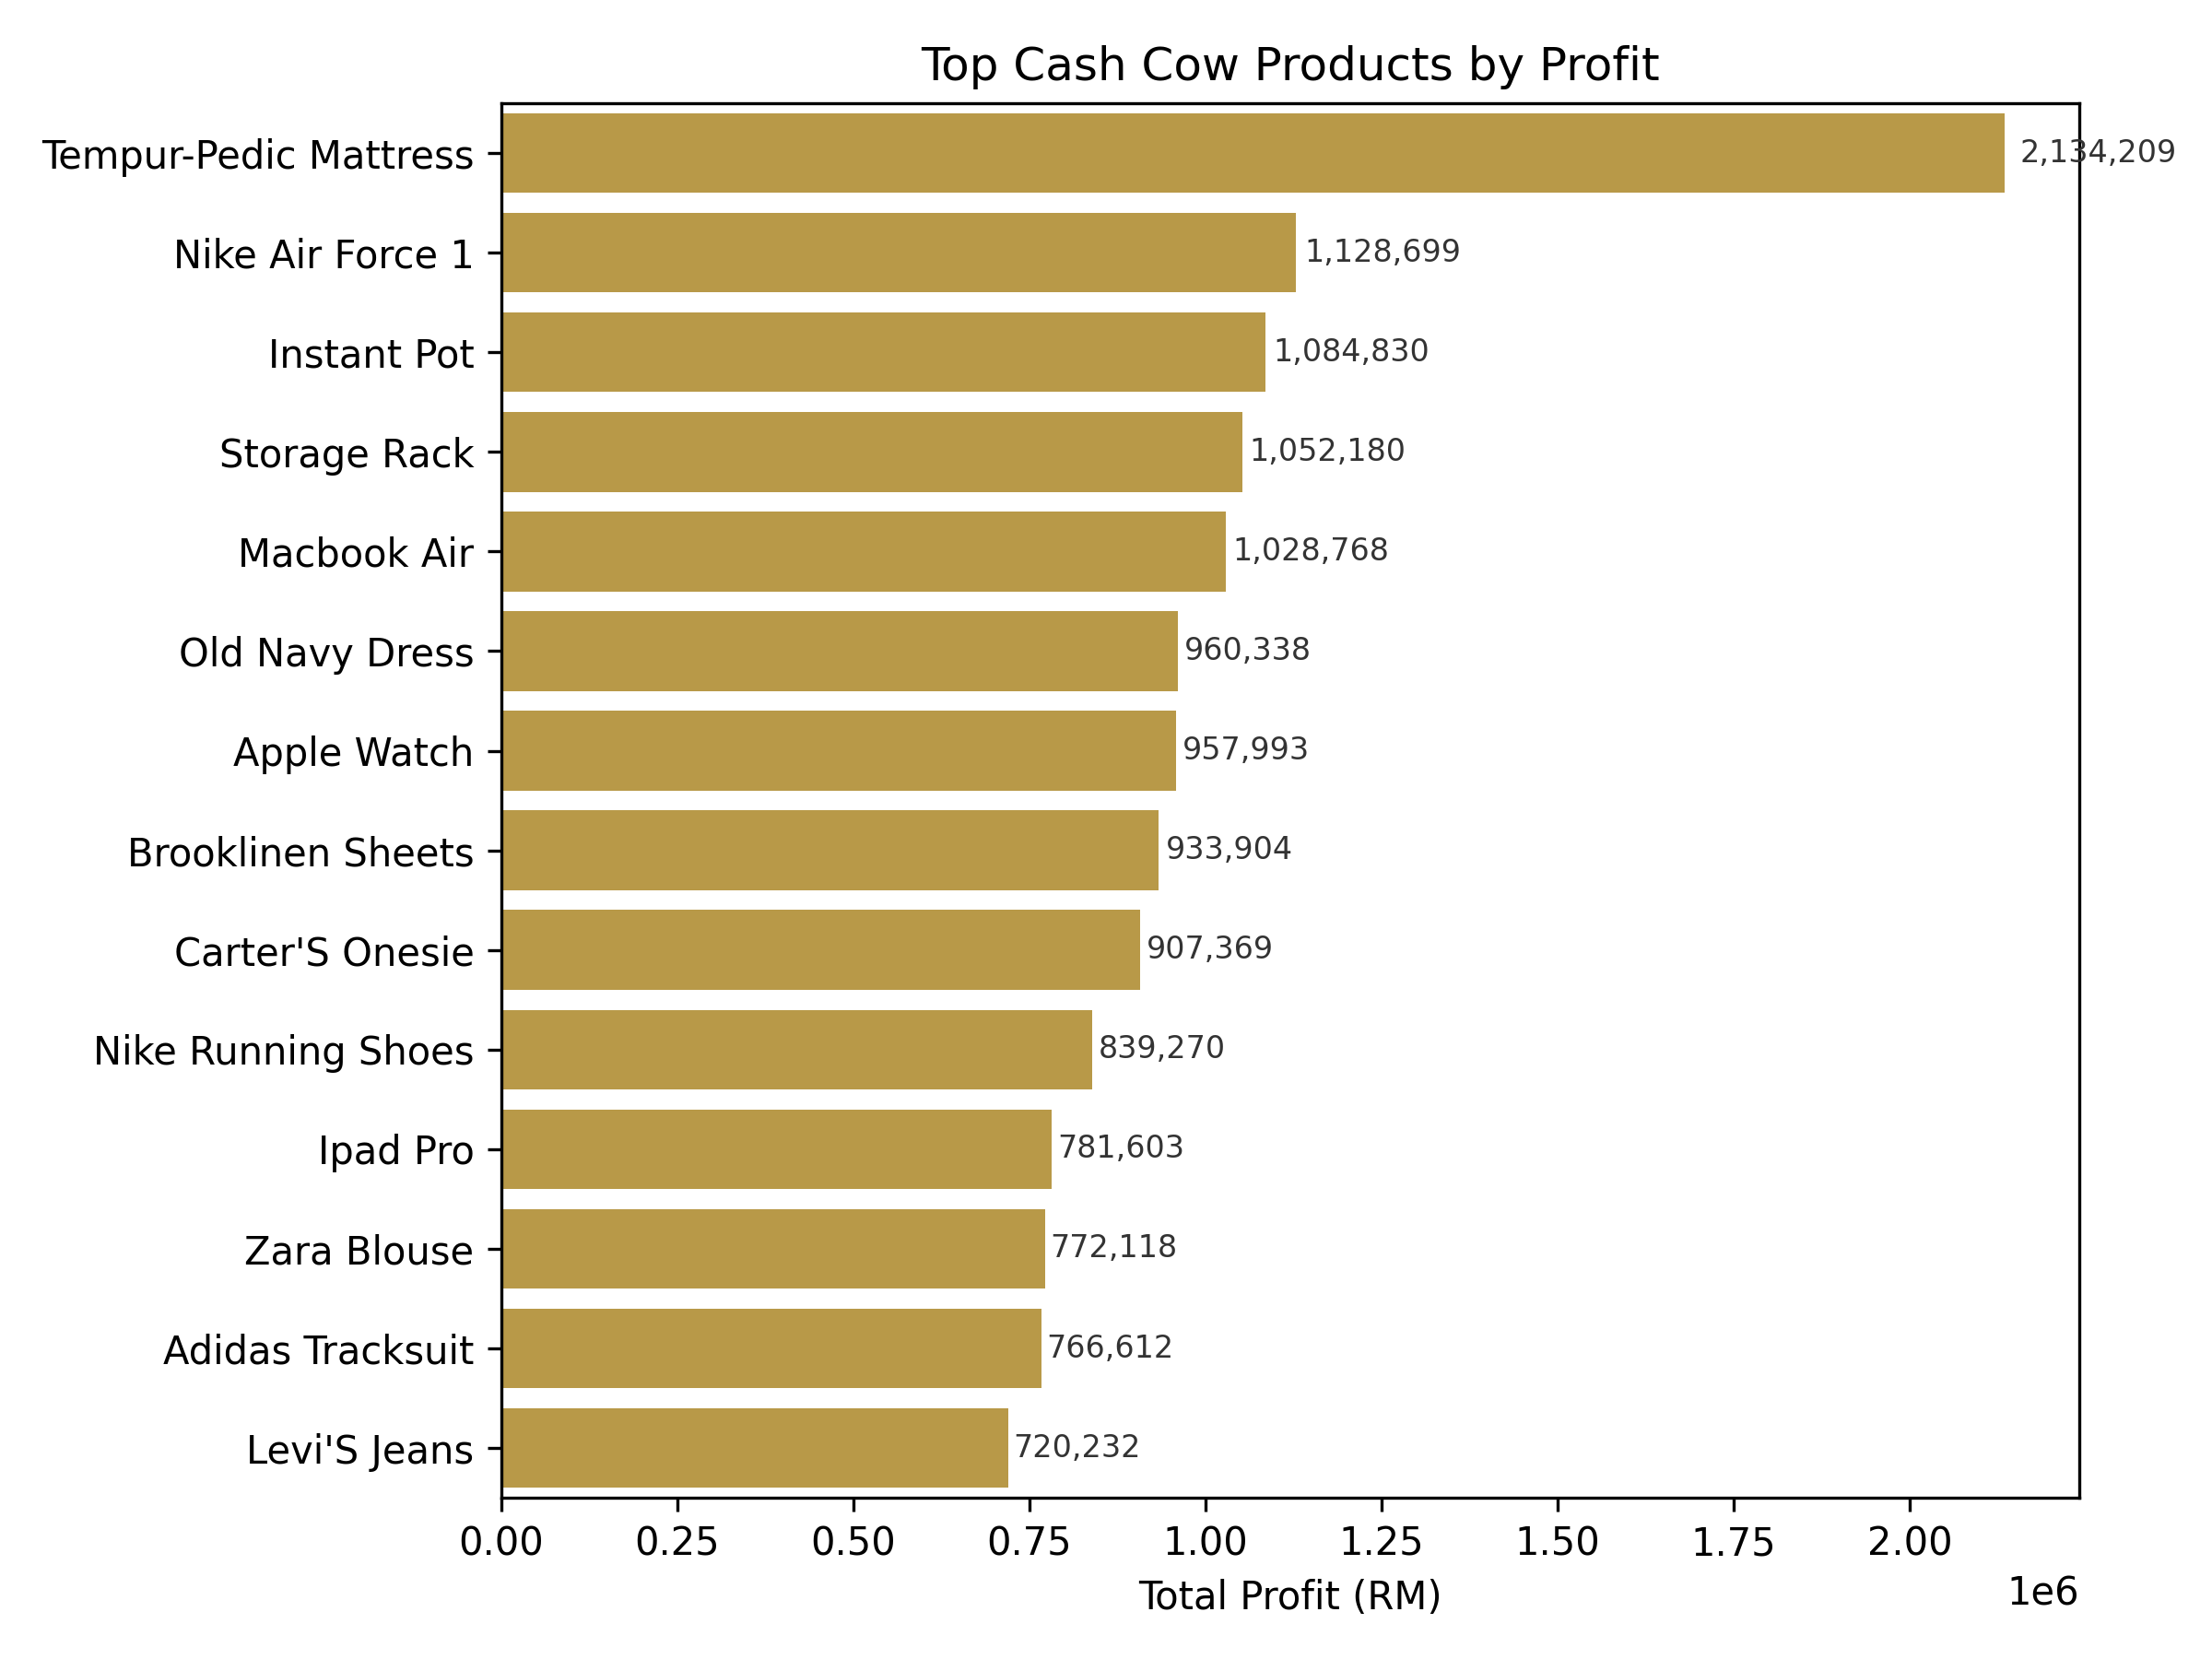
Q4: Which specific products belong to the high-performing clusters, and what is the top performer?
The Cash Cow group includes 14 products that consistently deliver strong profits. Leading the list is the Tempur-Pedic Mattress (RM2.13M profit), followed by Nike Air Force 1, Instant Pot, Storage Rack, MacBook Air, and Apple Watch, all earning between RM950K and RM1.1M. Every product in this cluster earns above RM750K profit, confirming their strong performance.
These products combine high sales with strong margins, showing effective pricing and strong customer demand. They span multiple categories – electronics, home goods, and fashion – spreading risk and showing broad market appeal.
Cash Cows are mature and stable, providing dependable profits. The focus should be on maintaining their strength – protecting market share, managing suppliers, and using them to support new growth products through cross-selling or bundling.
Q5: Which categories contribute most to proven winners?
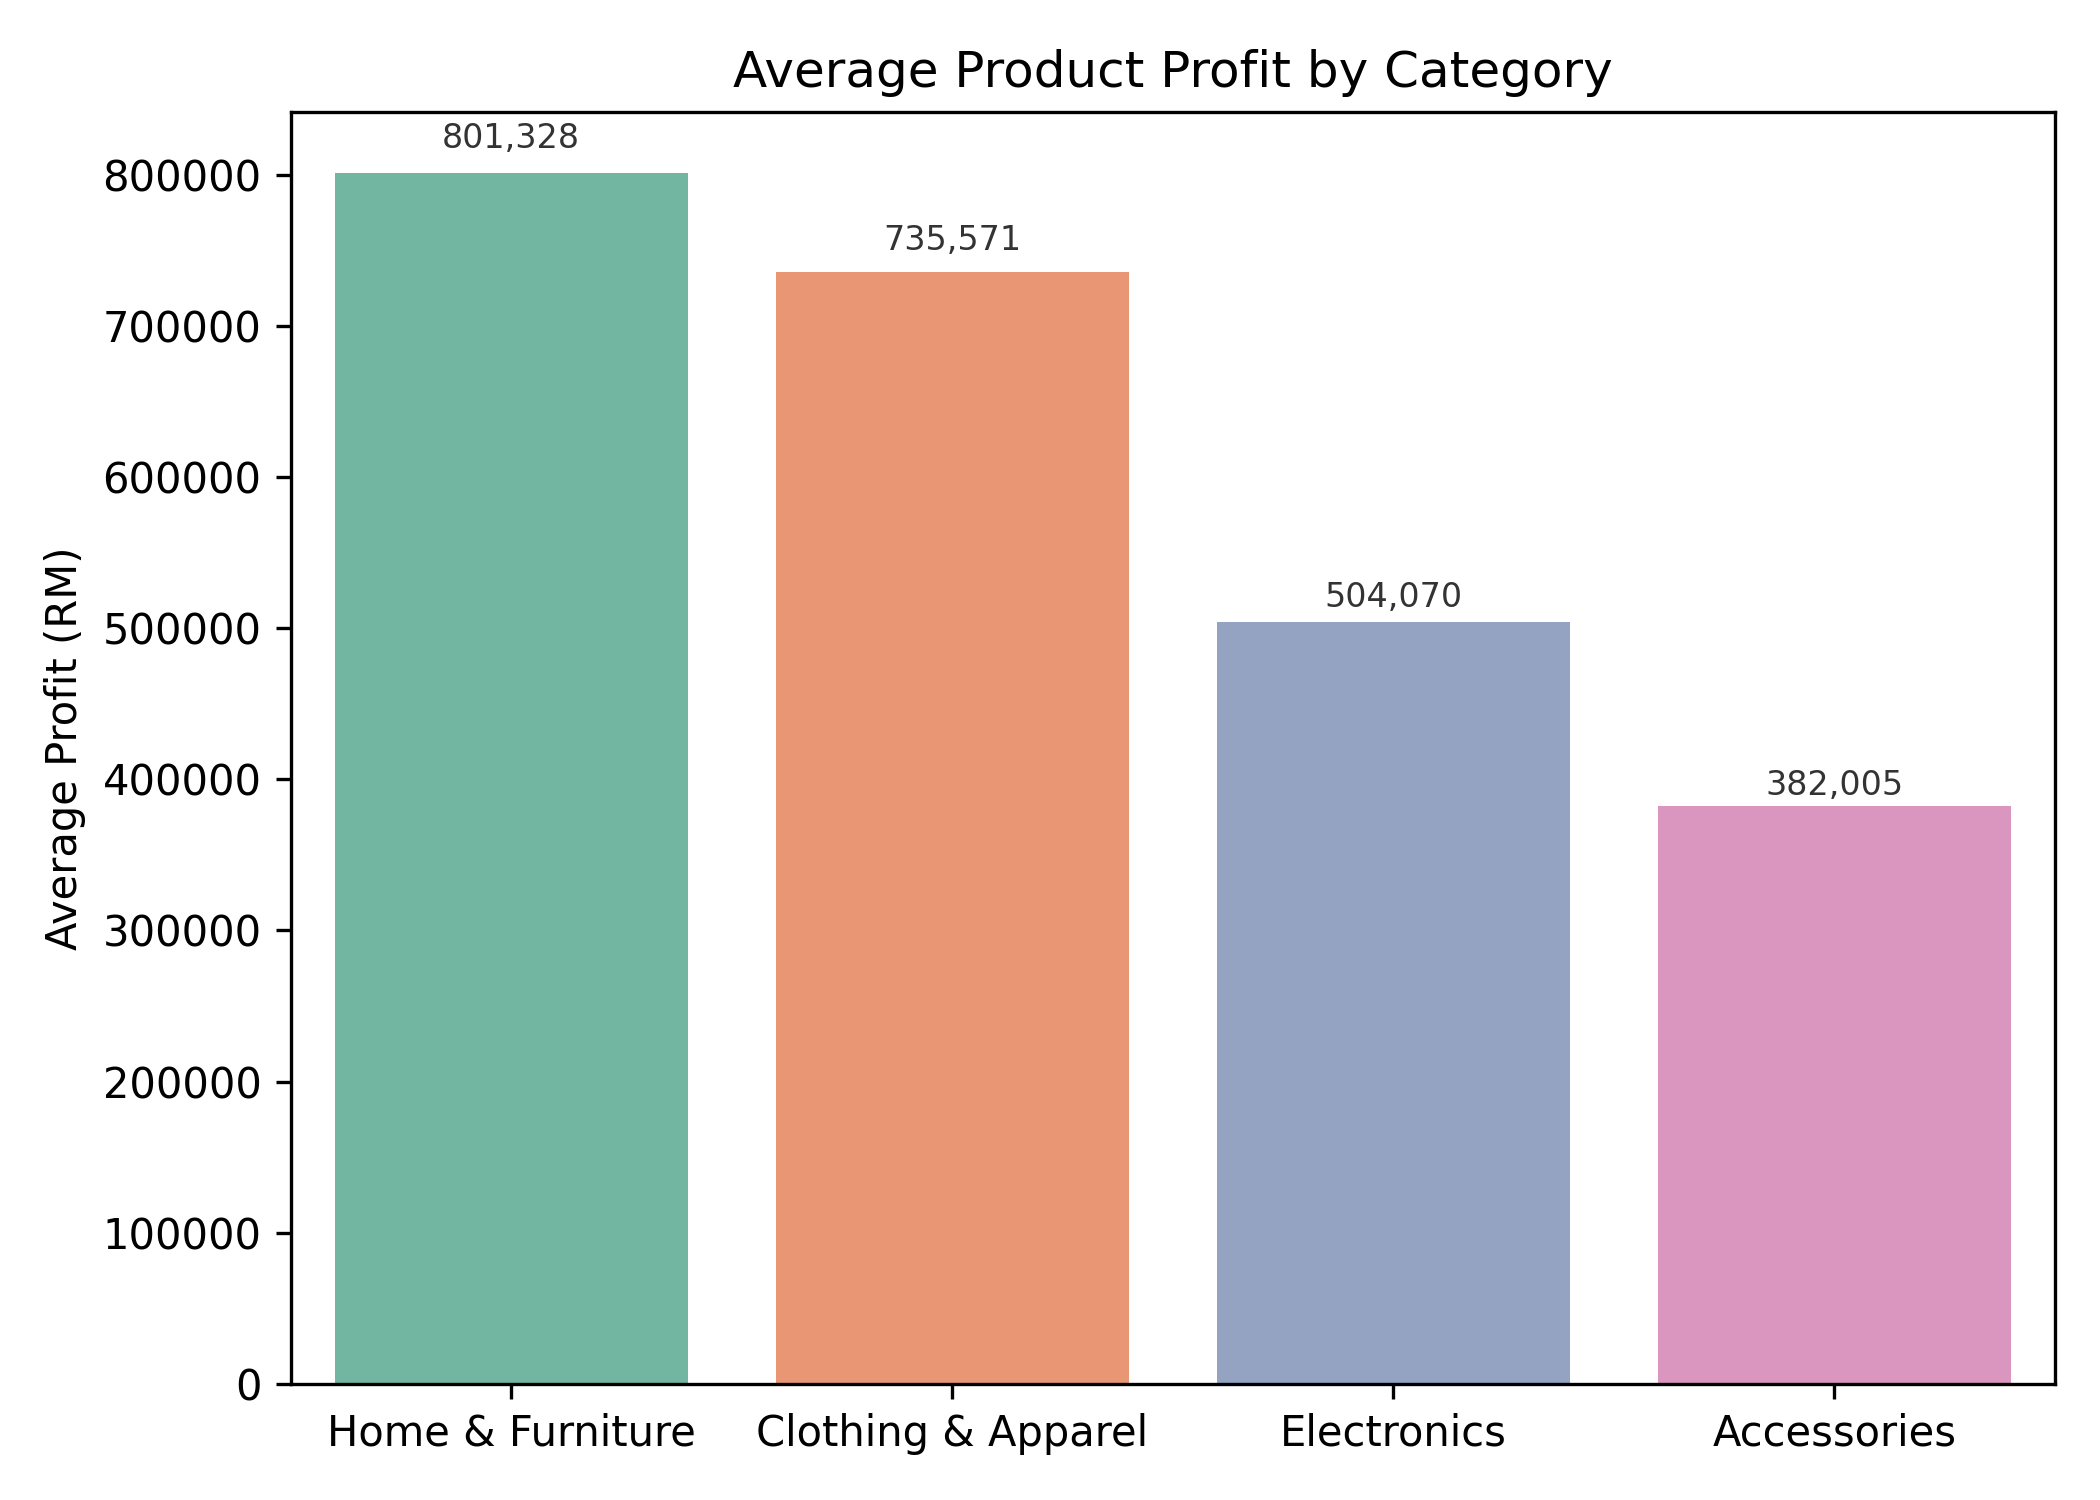
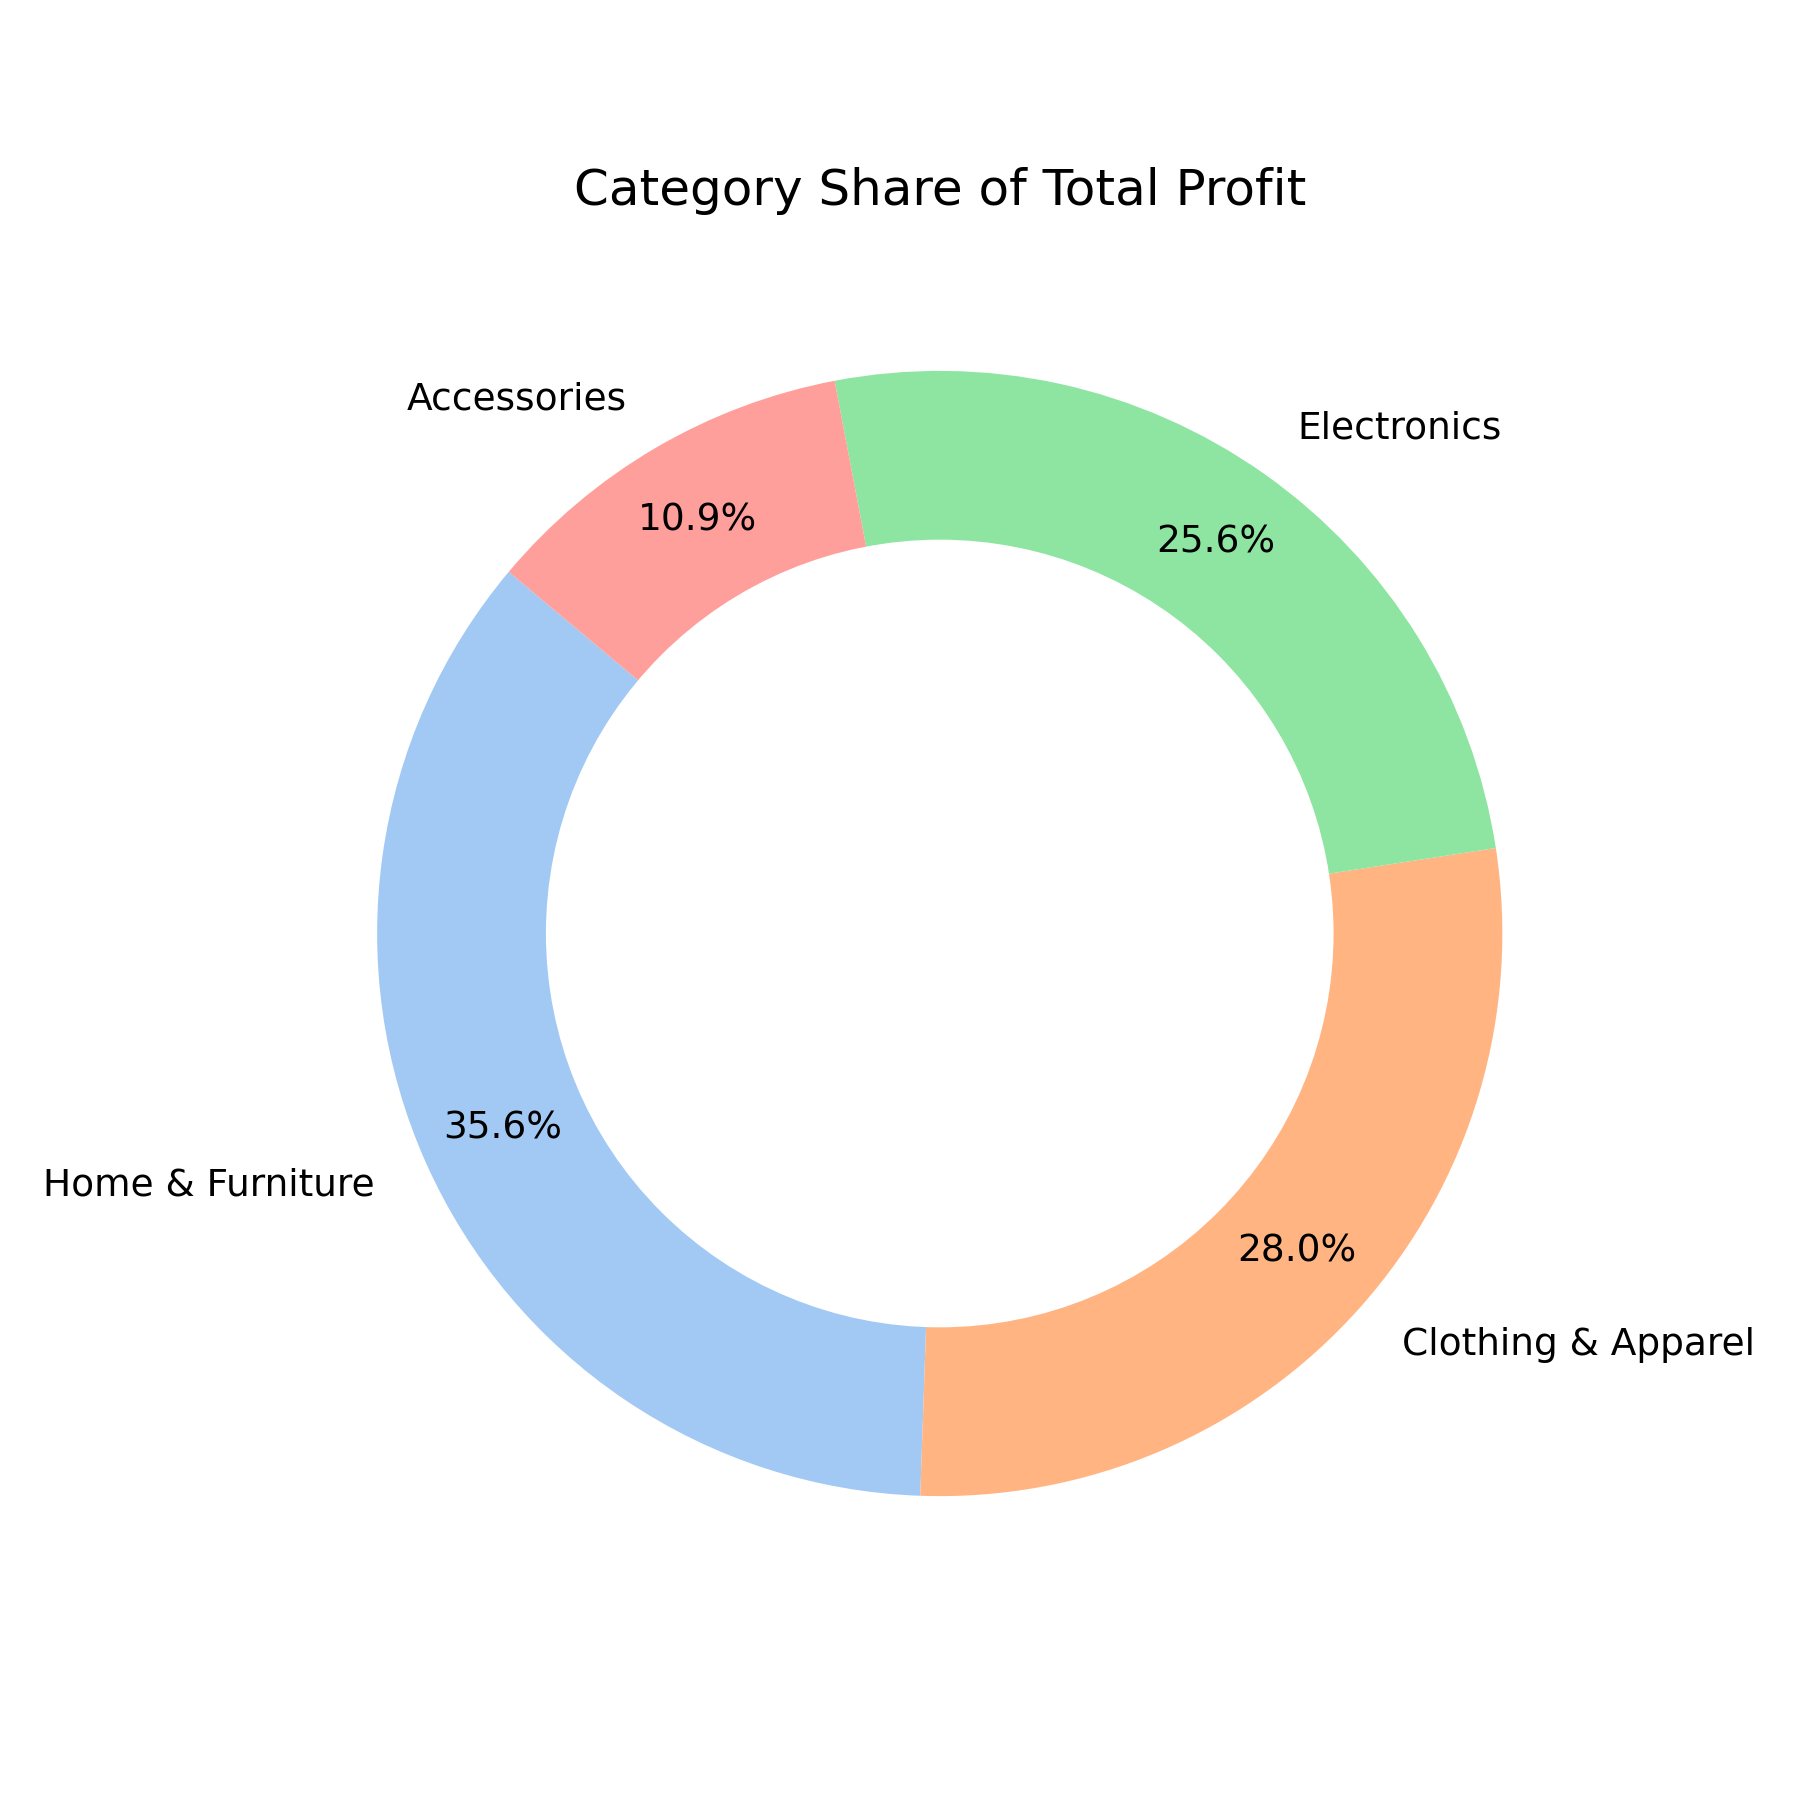
The Home & Furniture and Clothing & Apparel categories are the main profit drivers. Home & Furniture delivers the highest average profit per product (RM801K) and contributes 36% of total profit. Clothing & Apparel follows closely with 28%, while Electronics adds 26% and Accessories just 11%.
For business owners, this means doubling down on Home & Furniture and Clothing & Apparel makes the most sense – these categories combine strong performance with stability. Electronics remains important but should be managed carefully for margin control.
Accessories add less value alone but can support sales through bundling or promotions. The strategy is clear: focus major resources on the top two categories while using Electronics and Accessories tactically to strengthen overall performance.
Q6: Which product category produces the most champion products?
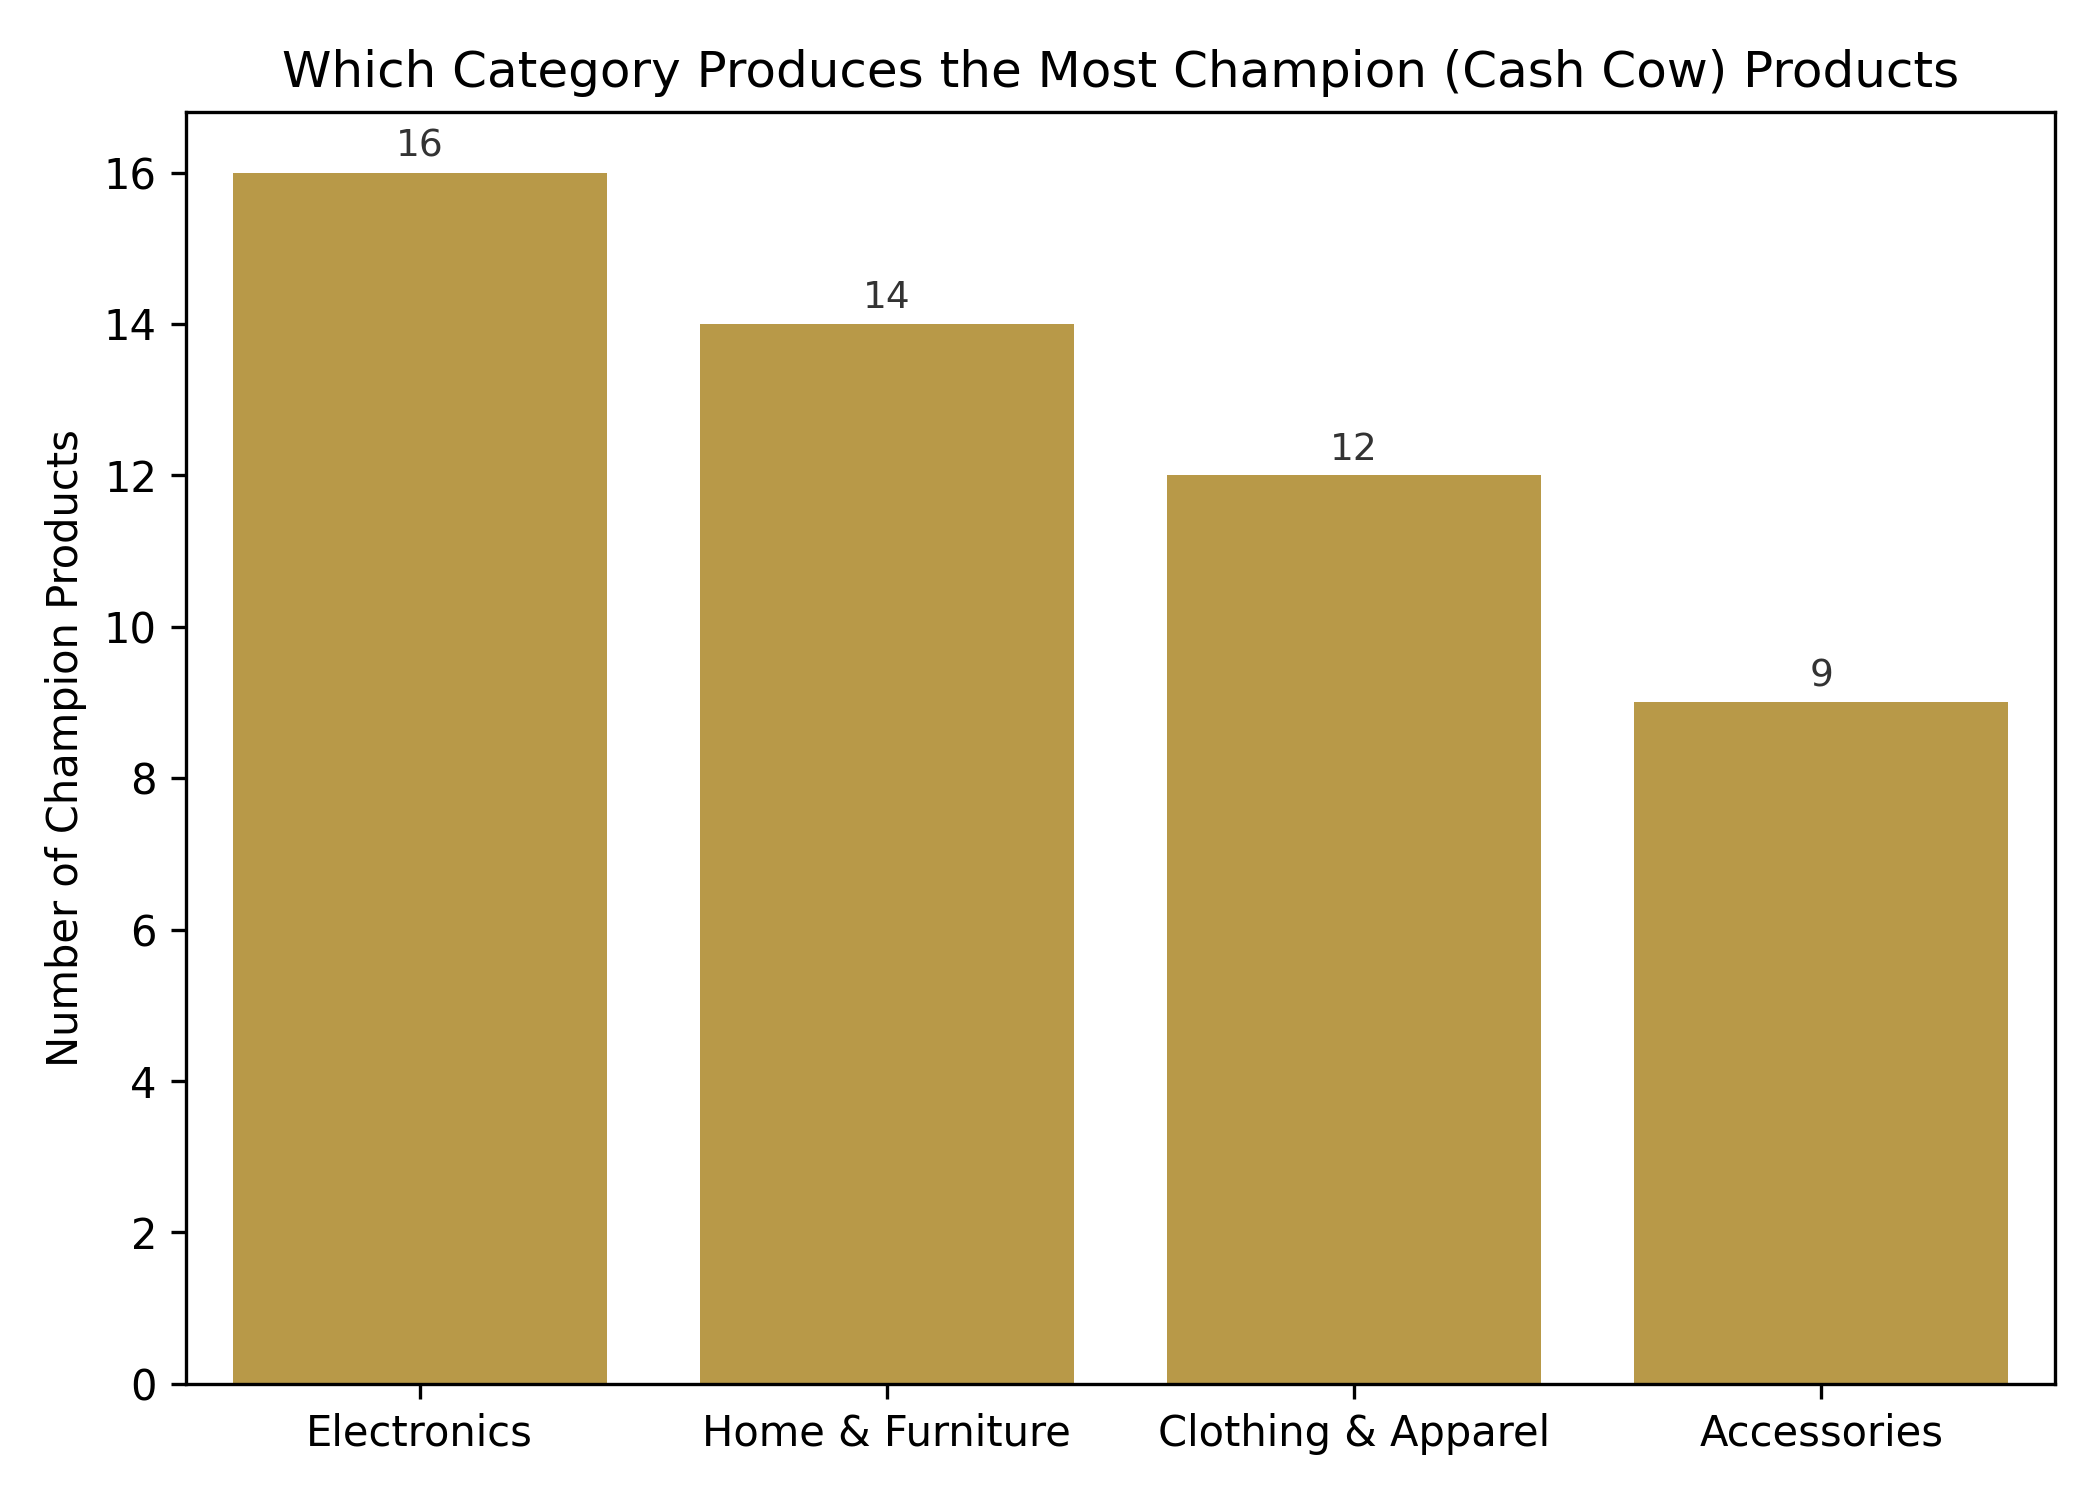
Electronics produces the highest number of champion products – 16 in total – showing it is the most reliable source of high-performing items. Home & Furniture follows with 14, Clothing & Apparel has 12, and Accessories contributes 9.
While Electronics creates more champions, they tend to have smaller profit margins than Home & Furniture, which delivers fewer but more profitable champions. This shows Electronics succeeds through volume, while Home & Furniture wins through higher unit profitability.
Businesses aiming for fast, steady growth should prioritize Electronics for expansion – more chances to find winners with manageable risk. Home & Furniture should focus on deepening profitability from existing champions rather than chasing new ones.
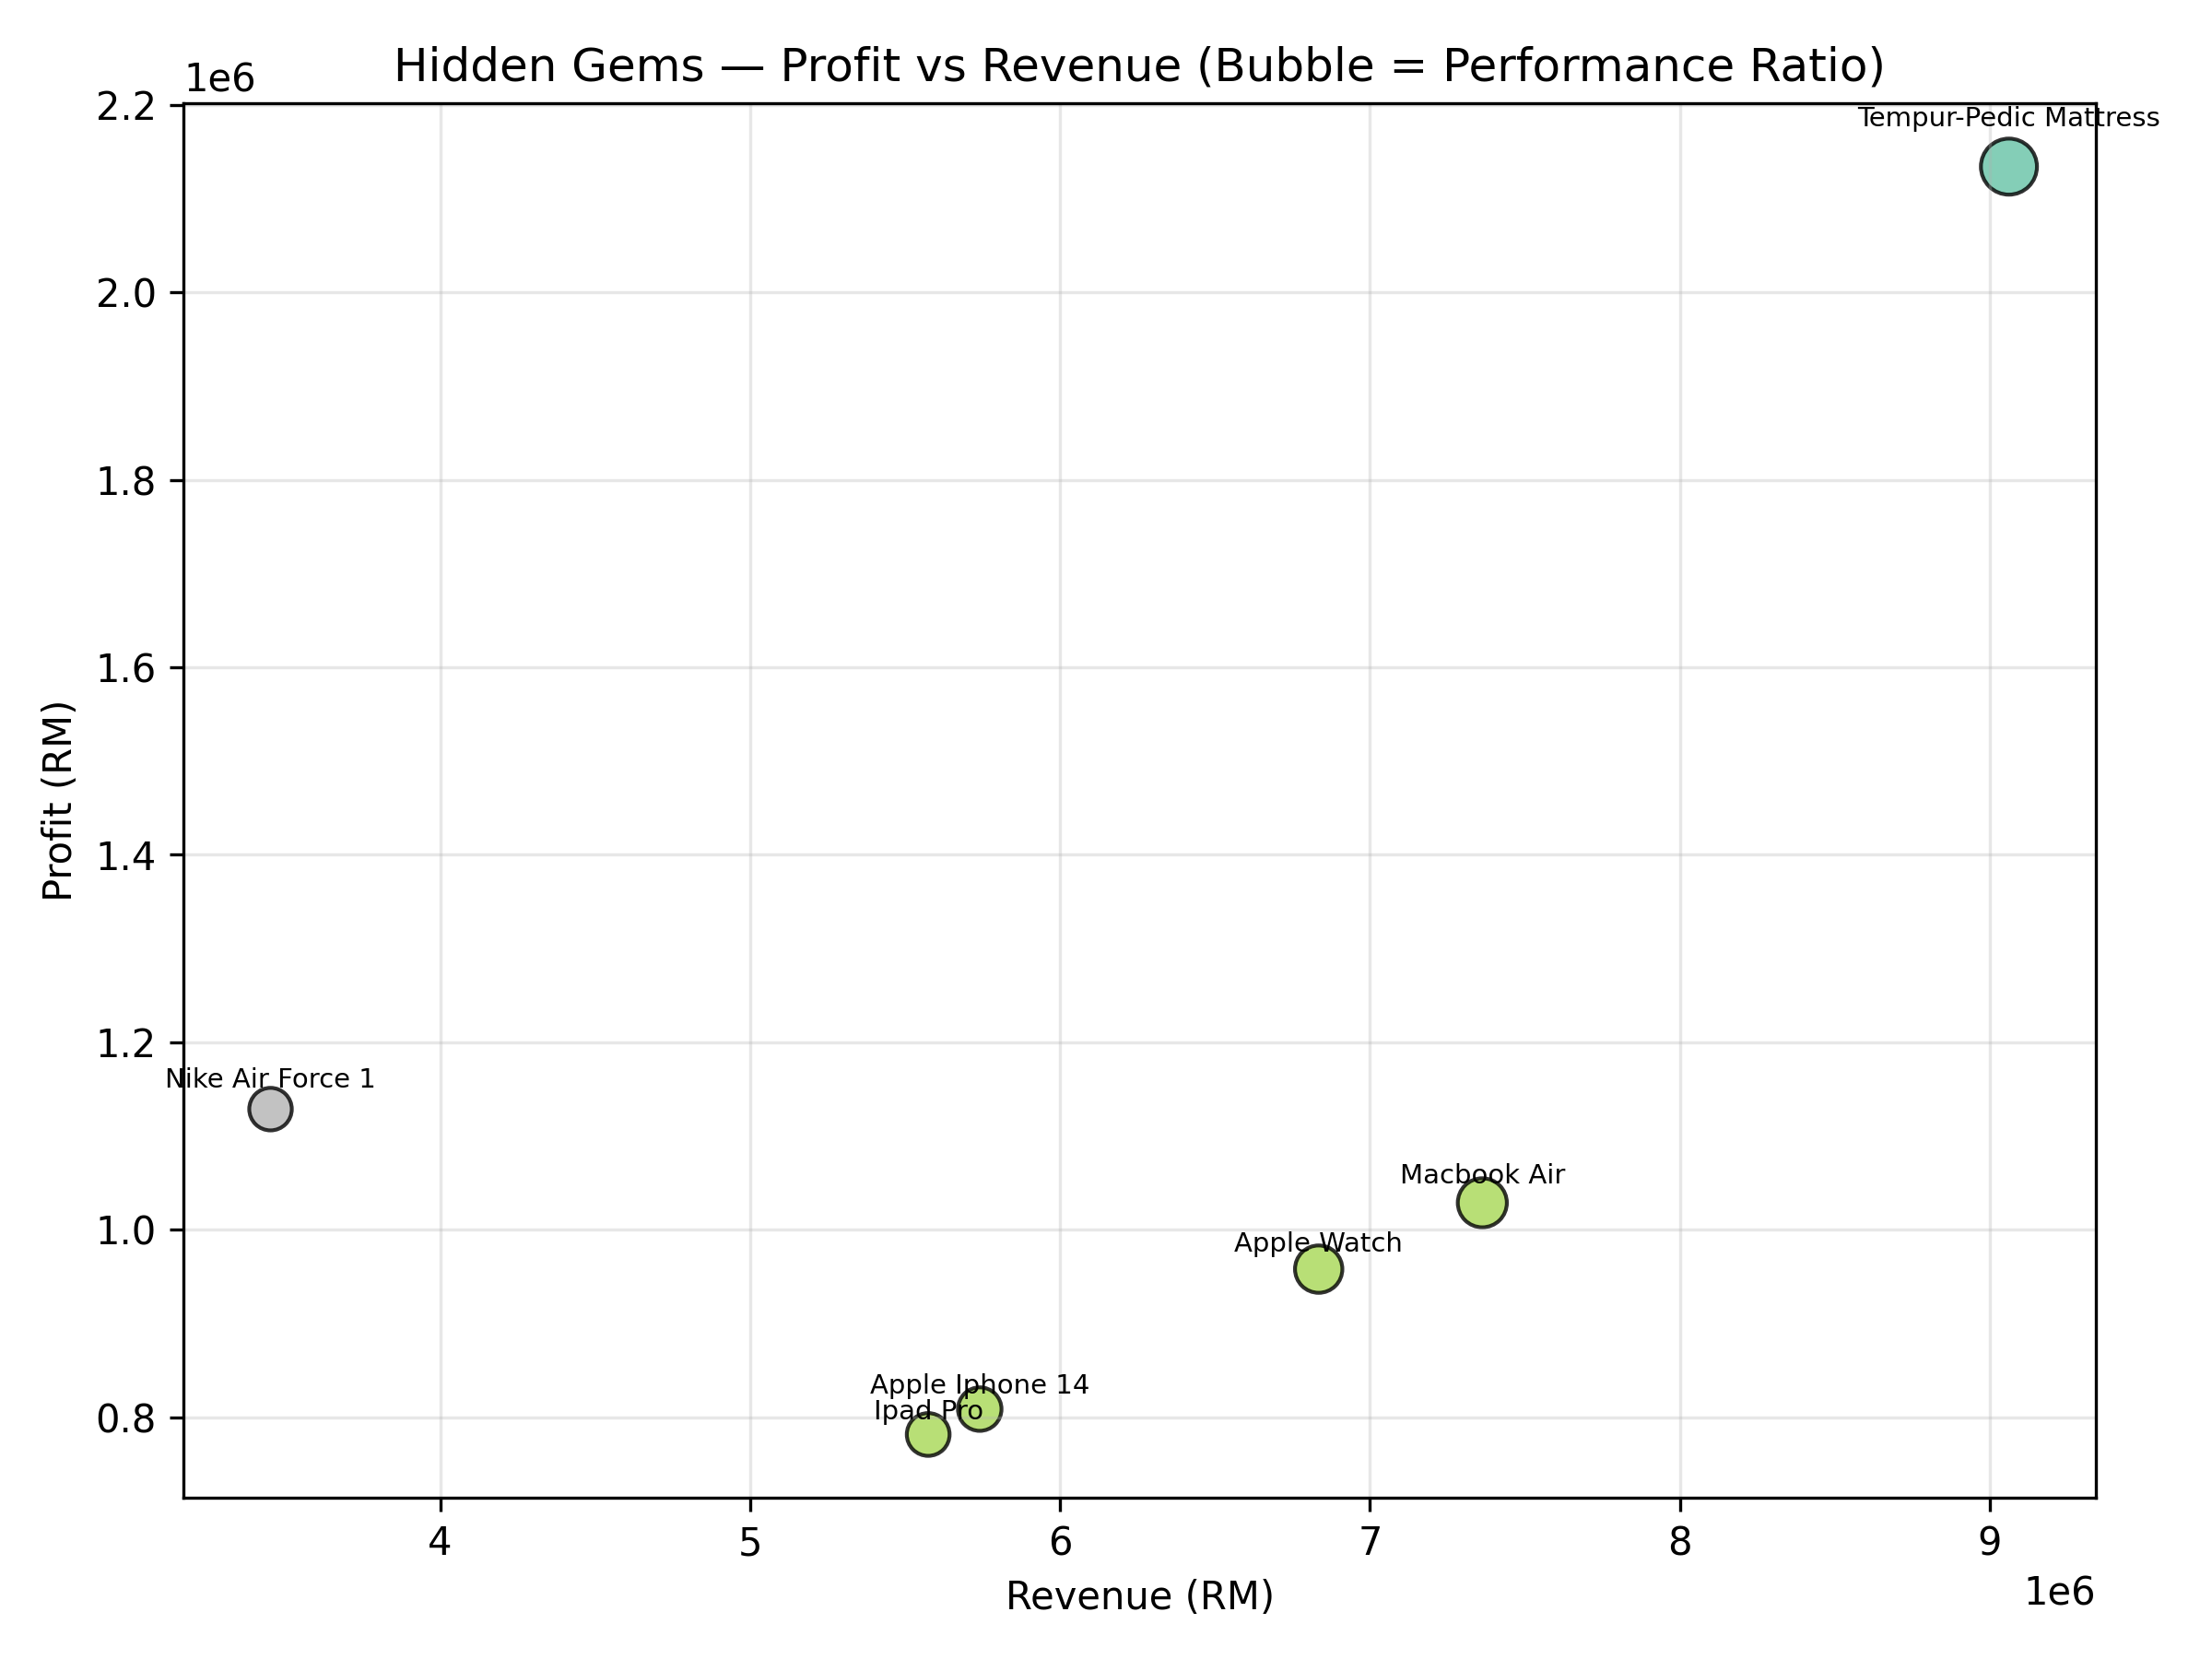
Q7: Are there smaller or lower-profile products that outperform peers in their category?
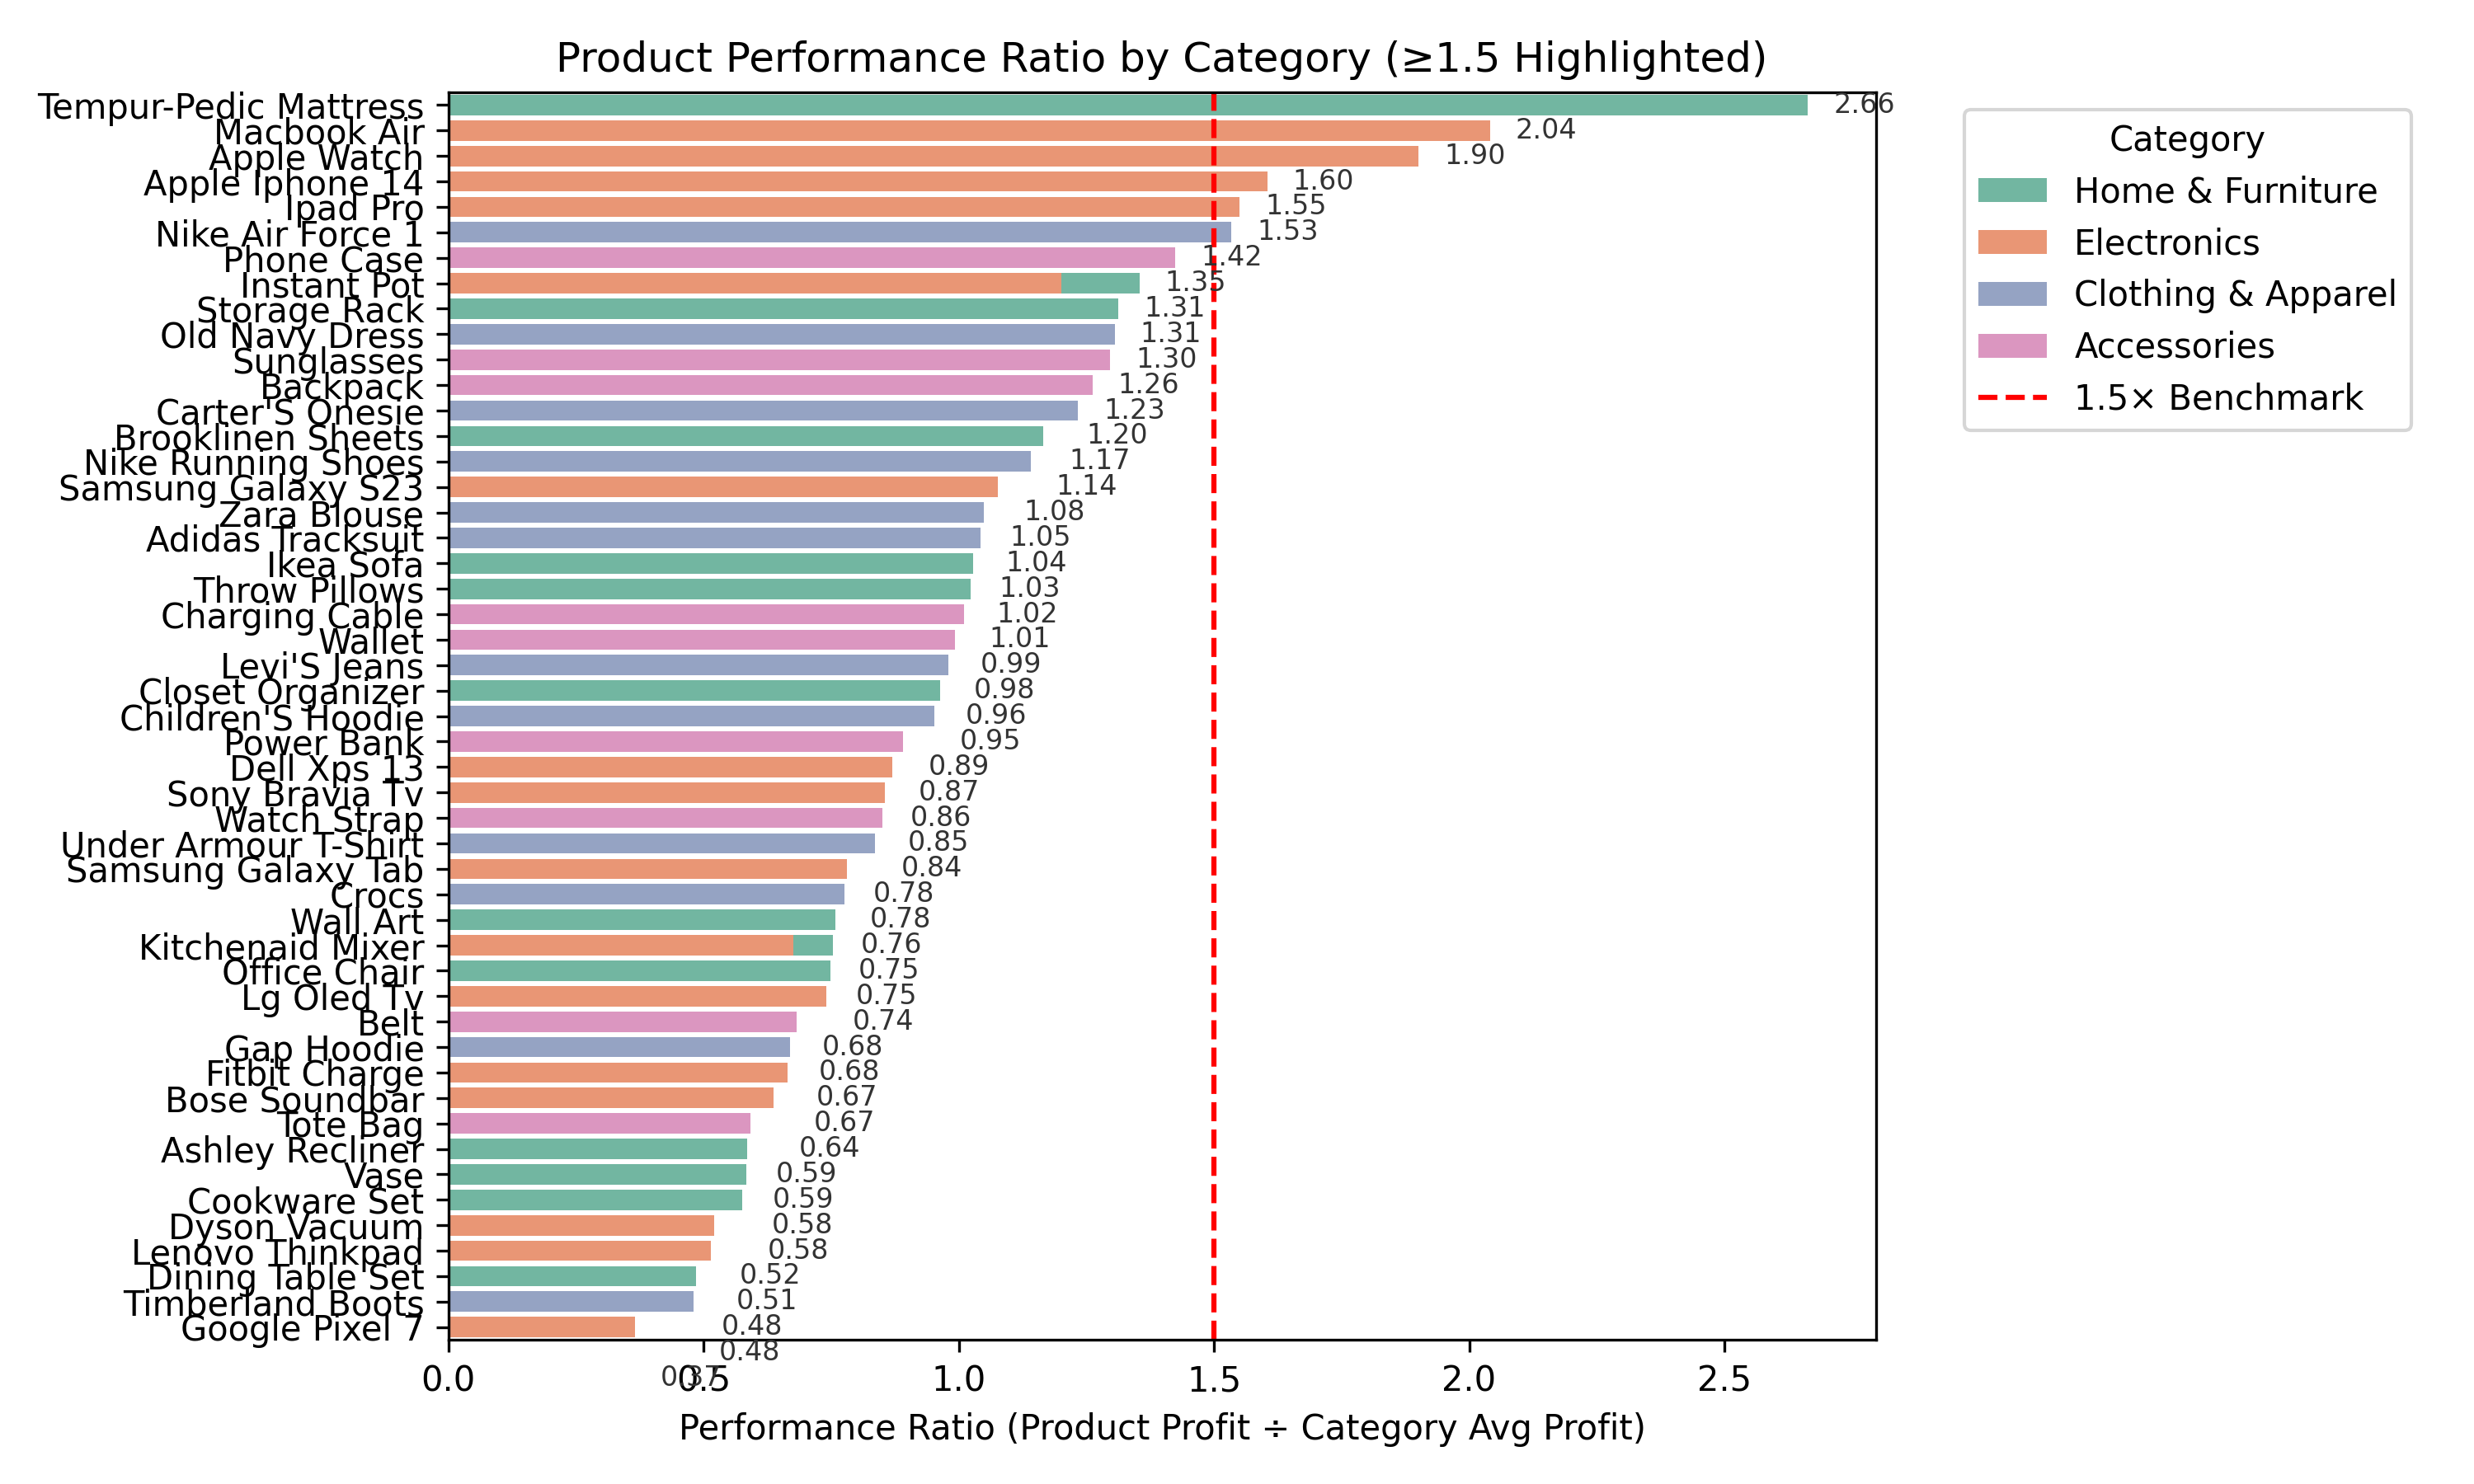
Yes. Several smaller or lower-profile products outperform their category peers by a wide margin. Tempur-Pedic Mattress (2.06×), MacBook Air (2.04×), Apple Watch (1.90×), Apple iPhone 14 (1.60×), and iPad Pro (1.55×) all deliver at least 1.5× more profit than their category averages.
These results reveal that success isn't only about scale. Products like MacBook Air and Apple Watch show higher profit efficiency – each unit sold delivers more profit than competitors'. They deserve more visibility, stock, and marketing push to scale their proven success.
The insight extends beyond sales – understanding why these products succeed (pricing, loyalty, features) can help apply the same strategies to weaker items. Focusing on what makes these outperformers special can lift overall portfolio performance.
Q8: Which smaller-category products show the strongest relative profit advantage?
The Tempur-Pedic Mattress stands out as the top performer, earning RM2.1M profit from RM9M revenue with a 2.66× performance ratio – the highest in the analysis. Nike Air Force 1 follows as the standout small-scale product with RM1.1M profit from RM3.5M revenue.
The Apple lineup – Watch, iPad Pro, and iPhone 14 – also performs well with strong profits and above-average ratios, though their advantage is smaller than the leaders. They're solid and reliable but less likely to see explosive gains.
Investment should follow this pattern: grow Tempur-Pedic Mattress immediately, expand Nike Air Force 1 strategically, and sustain Apple's products for consistent returns. This mix balances quick wins with long-term stability.
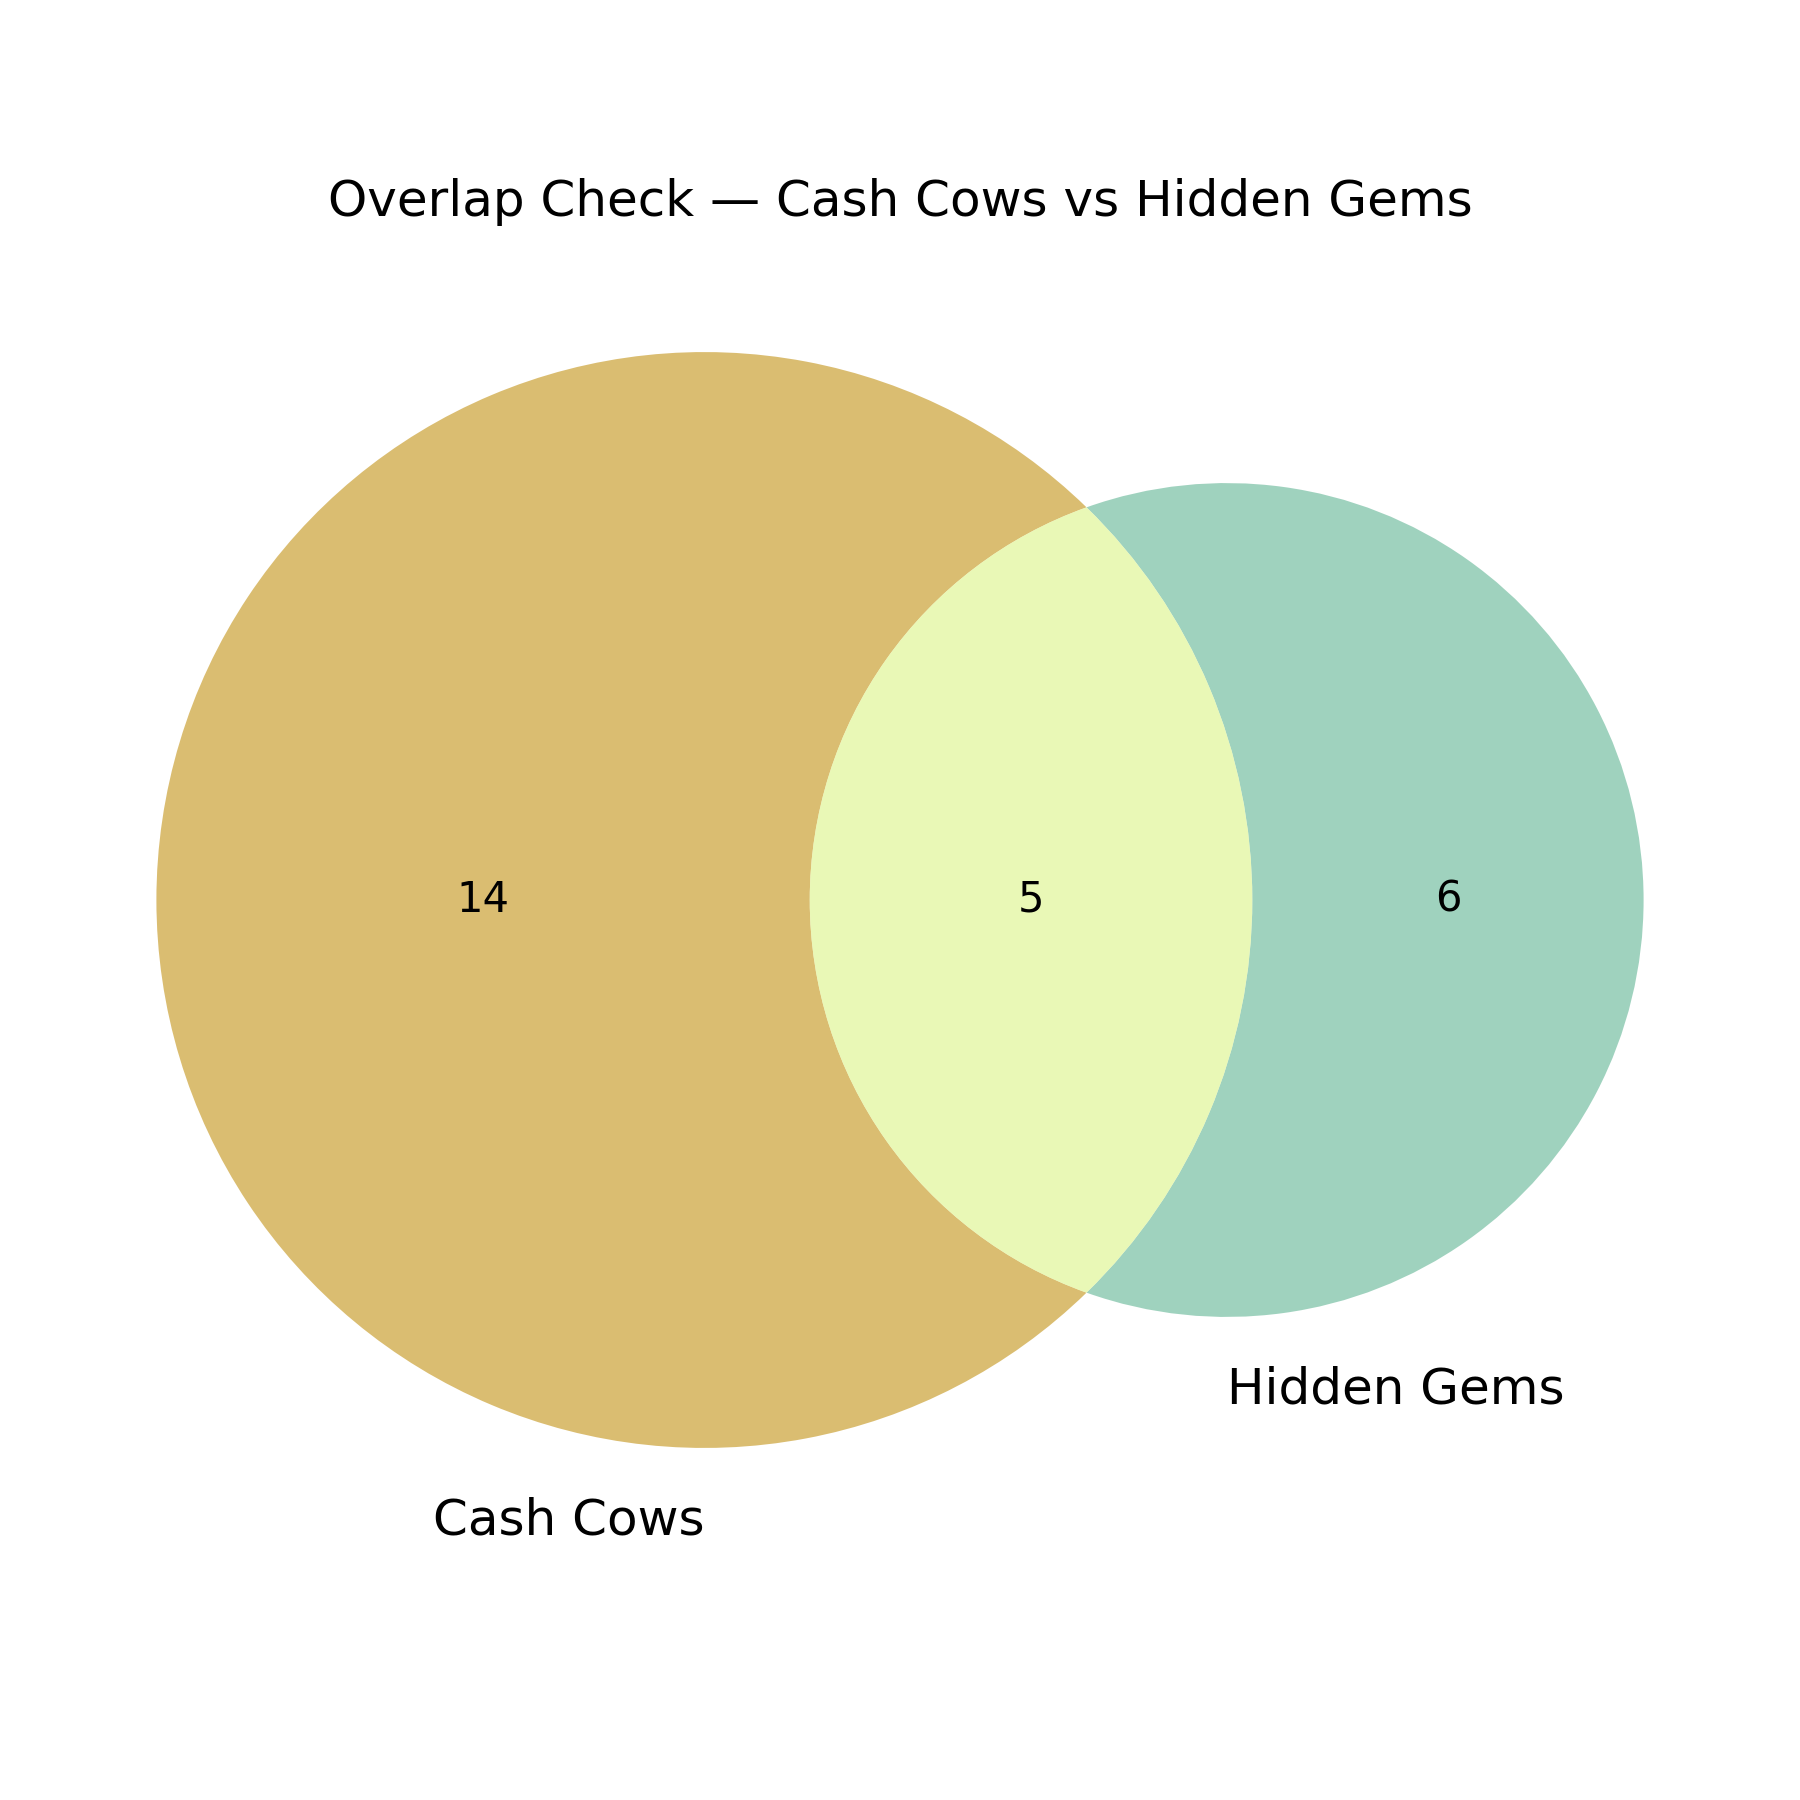
Q9: Which products are Hidden Gems not already in the Cash Cow list, and what qualifies them?
After removing overlaps with Cash Cows, the Apple iPhone 14 is the only true Hidden Gem. It earns RM5.74M in revenue and RM808K in profit, performing 1.6× better than its Electronics category average.
It qualifies as a Hidden Gem because it delivers much stronger profitability than peers, even though it hasn't yet reached the top-tier profit level of Cash Cows. With better marketing, promotion, or inventory availability, it could easily move up.
The iPhone 14 represents a growth opportunity. Unlike mature products that need defending, it benefits from aggressive investment to speed up its rise to Cash Cow status – a clear example of an underappreciated profit engine ready to scale.
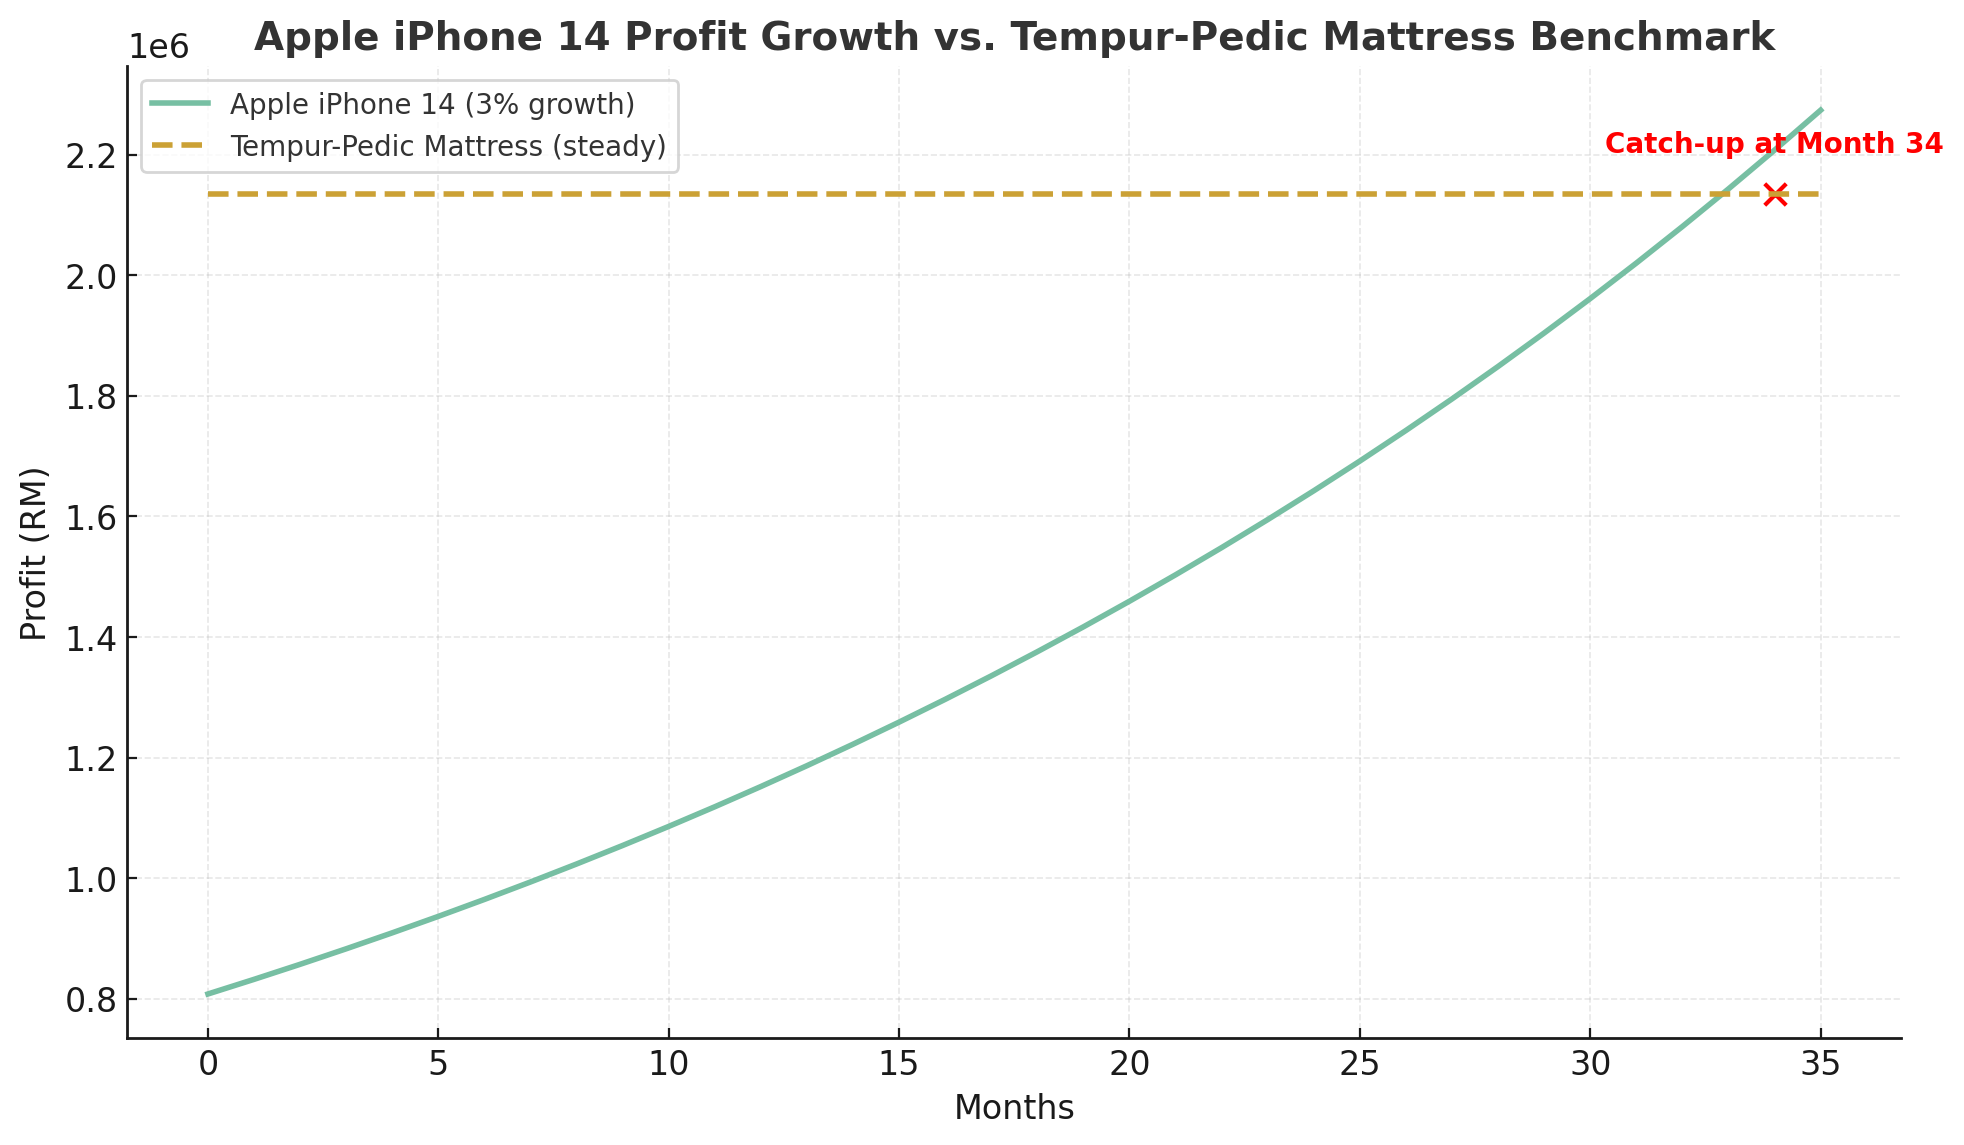
Q10: How long would it take for Apple iPhone 14 to catch up with Tempur-Pedic Mattress?
Assuming the Apple iPhone 14's profit grows by 3% per month, it would take about 34 months (2 years and 10 months) to match Tempur-Pedic Mattress's profit level of RM2.13M, around mid-2028.
This projection assumes steady execution – consistent pricing, marketing, and supply chain performance. Any slowdown in growth would push the timeline further. The point isn't an exact prediction but a signal that turning Hidden Gems into Cash Cows requires time and persistence.
The key takeaway: sustainable growth takes patience and focus. While mature products stabilize the business, products like the iPhone 14 show that consistent, moderate growth over time can transform smaller winners into long-term profit leaders.
Method & data
This analysis is based on 200,000 transaction records covering 49 unique products. The dataset includes key fields such as order date, product name, category, revenue, profit, quantity, and unit price – providing a complete picture of product performance over time.
The study looks at where profits truly come from and which products have the potential to grow. It measures revenue and profit at the product level, profit contribution by category, and performance ratios that show how well each product does compared to its peers. Products are also grouped using cluster analysis to reveal natural performance patterns.
The process followed four stages: finding product clusters, identifying proven profit makers (Cash Cows), spotting emerging high performers (Hidden Gems), and estimating their growth potential over time. The aim is to give business owners a clear, data-based view of which products sustain today's profits and which ones could drive tomorrow's growth.
Conclusion
This analysis turns sales data into a clear roadmap for smarter, profit-driven decisions. By classifying products into Cash Cows, Hidden Gems, and underperformers, it helps business owners focus time, money, and effort where they matter most. The framework makes it easier to decide which products to protect, which to grow, and which to rethink – creating a direct link between data and action.
Operational priorities should begin with protecting and expanding the profit base. Cash Cows like the Tempur-Pedic Mattress, Nike Air Force 1, and Apple's product line must stay well-stocked to avoid missed sales. The strength of Home & Furniture (36% of profit) and Clothing & Apparel (28%) means these categories should get priority in storage space, supplier capacity, and promotional support. Pricing and marketing should reflect each product's performance – Cash Cows can hold premium prices, while moderate performers need smart bundling or promotions to move closer to top-tier profitability.
For growth, focus on defending the leaders while accelerating the next generation of winners. Apple iPhone 14, already 60% more profitable than its category average, shows what happens when a strong product lacks only scale. Targeted marketing and inventory support can help it close that gap faster. Meanwhile, supplier strategies should match performance – invest in long-term partnerships for high-profit categories like Home & Furniture and Clothing & Apparel, while keeping leaner relationships in low-margin segments. Continuous tracking through dashboards ensures this analysis stays alive – helping business owners see which products rise, which plateau, and where new opportunities emerge. Over time, this shifts the company from reacting to results toward shaping them with confidence.