
Predicting Gym Member Drop-Off
How to Spot Members Who Are Losing Motivation Before They Quit
Overview
This analysis helps fitness trainers understand which member habits show that someone may be losing motivation and could soon quit the gym. Instead of relying only on intuition, the report uses data from visit frequency, workout duration, calories burned, and age to highlight the behaviours that matter most. The aim is to give trainers a simple way to spot early warning signs and support members before they drop out.
The key question we answer is: Which workout behaviours can help trainers identify at-risk members, and how should they respond? The findings are written for fitness trainers who need practical guidance—who to check on this week, who may need a lighter or more engaging programme, and who might benefit from encouragement or a follow-up message.
1. Which habits are most strongly linked to quitting, and are any of them too similar?
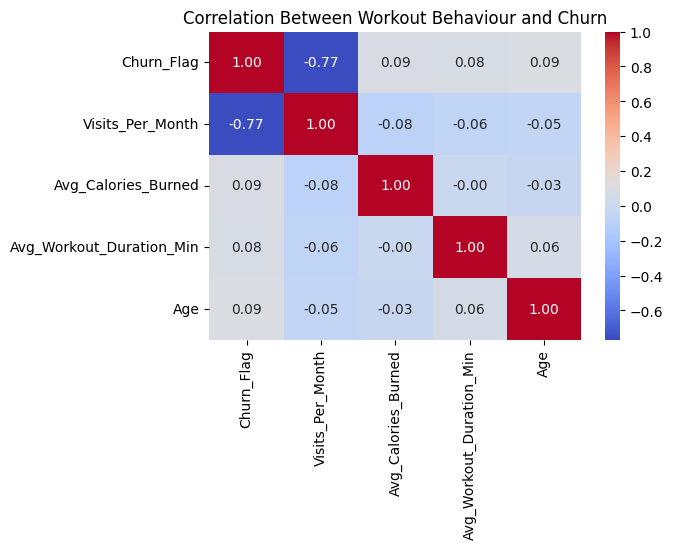
The habit most closely linked to quitting is how often a member visits. Those who come less are far more likely to stop. The other behaviours—workout duration, calories burned, and age—have only very weak relationships with churn, so they are not strong warning signs on their own.
The four behaviours are not "too similar" to each other. Each one captures a different part of a member's training pattern, and none of them overlap. Visit frequency stands out as the most meaningful signal.
What trainers should do:
Watch attendance closely. A steady drop in visits is the clearest and earliest sign that a member is losing motivation.
2. Which behaviours matter based on statistical testing?
In this dataset, none of the behaviours pass the usual statistical significance test. This is not because the behaviours don't matter—it's because the model ran into a technical issue called complete separation. Members with very low visits almost always churn, while those with high visits almost never do, making the model unstable and unable to calculate proper p-values.
The failure of the statistical test is a limitation of the model, not the behaviours. The behavioural patterns in the dataset are still very strong and meaningful.
What trainers should do:
Even without statistical confirmation, the real-world signal is clear: visit frequency matters most. Workout duration and calories burned are secondary indicators of engagement.
3. What combination of behaviours best predicts who might quit?
The most useful combination of behaviours comes from the patterns in the data, not the unstable regression model. The strongest mix includes visit frequency, workout duration, and calories burned. Age adds little predictive value but can still help trainers personalise coaching.
This combination works because it reflects how members behave in real life. Attendance shows commitment, and workout duration and calories burned show how engaged a member is during each visit.
What trainers should do:
Look at both attendance and workout quality. Members who show up less and train with less focus are the ones most likely to drift away.
4. What is the churn risk for each member?
Most members have an extremely low risk of quitting. They visit regularly, spend adequate time training, and put in consistent effort. Their habits are stable, and they are unlikely to leave.
A smaller group shows near-maximum risk. These members rarely visit and have inconsistent workouts. Without early support, they are likely to drop off.
What trainers should do:
Prioritise members with risk scores above 0.50. These individuals need encouragement, guidance, or a simple plan to get back on track.
5. What is the churn risk for members 15, 66, 105, 130 and 150?
Members 66 and 130 are at the highest level of risk. Their visit patterns and overall engagement strongly suggest they are close to quitting. Members 105 and 150 are at extremely low risk and appear steady and consistent.
Member 15 was not found in the output and may require a check in the original dataset.
What trainers should do:
Act quickly with members 66 and 130. A friendly check-in or simple routine may help them regain consistency. Members 105 and 150 are stable; continue supporting them as usual.
6. How much does churn risk rise if a member visits three times less per month?
The effect depends on how often they currently visit. Members who visit frequently see almost no meaningful change. Members who already visit very little remain at high risk because their score is already at the maximum.
The largest increase happens among members who visit moderately—around 8 to 12 times per month. A drop of three visits is a strong sign they are slipping out of routine.
What trainers should do:
Focus on the "middle group." These members are the most sensitive to changes in attendance and can often be saved with timely support.
7. What happens if workout duration drops from 60 to 20 minutes?
For most members, reducing session length does not dramatically change their churn risk because their overall habits are strong. Their motivation remains stable even with shorter workouts.
The picture changes for members who already visit infrequently. For them, shorter sessions are an added sign of disengagement, and their risk rises sharply.
What trainers should do:
A short workout is only a concern when paired with fewer visits. When both happen together, it signals a member who needs early encouragement and a simple, manageable plan.
8. Is churn risk more sensitive to age or to workout behaviours?
Churn risk responds far more to training habits than to age. Visit frequency has the strongest impact—almost 30 times stronger than age. Workout duration and calories burned also matter, but to a much smaller degree.
Age has only a minor effect. It is more useful for tailoring coaching style than predicting who might quit.
What trainers should do:
Base your follow-up decisions on behaviours, not age. Attendance and engagement tell you much more about someone's motivation level.
9. How accurate is the churn model, and can trainers rely on it?
The model achieved perfect accuracy on this dataset—it predicted every case correctly with no false alarms. This is because the behaviour patterns in the dataset are exceptionally clear: members who visit rarely almost always quit, and those who visit regularly almost never do.
While the model is highly reliable for this dataset, real-world performance may be slightly lower because member behaviour is more varied outside controlled data.
What trainers should do:
Use the model as a decision-support tool, especially for monitoring attendance. It gives dependable guidance on who needs early follow-up, but real-life judgement should always complement the predictions.
Conclusion
The analysis shows that how often a member comes to the gym is the strongest warning sign of whether they're losing motivation. When visit frequency drops—or when workouts become shorter or less focused—the risk of quitting rises quickly. Members who stay consistent are generally safe, while those with irregular attendance should be the trainer's first priority.
These insights help trainers decide what kind of support each member needs. Some may benefit from a simpler routine, more variety, or a programme that fits their schedule better. Others may just need a quick check-in or an invitation to a class to help them regain consistency. The goal is to match the coaching style to the member's current motivation.
The model also makes it easier to see who needs encouragement this week. A reminder, a small goal, or a friendly message can help at-risk members stay engaged. By focusing on key behaviour signals—especially visit frequency—trainers can step in early and keep members on track.