Predicting Holiday Peaks
The Best Weeks to Launch Your Christmas Campaigns
Overview
This analysis helps advertisers understand how people's listening habits change across the year, especially during the holiday season. By looking at weekly streaming trends, we identify when interest starts to rise, when it reaches its peak, and how quickly it fades. This shows exactly when audiences are paying attention and when they are not.
The goal is to help campaign teams plan their timing with confidence. The insights make it easier to decide when to launch a campaign, which weeks deserve more budget, and when festive or seasonal content should go live. With a clear view of upcoming high-attention windows, advertisers can schedule promotions at the moments when people are most engaged, improving impact and reducing wasted spend.
Data Sources and Methodology
We worked with several years of weekly streaming data for well-known Christmas songs, covering 2017 to 2025. The dataset included information such as the date, week of the year, season, track, artist, and weekly stream counts. We cleaned and organised the data so each row represented one track in one week, making it easier to see long-term patterns and seasonal changes.
Our goal was to understand when people start paying attention, when interest peaks, and when it drops off. To do this, we used a time-series model that looked at trends, seasons, weeks of the year, and differences between tracks and artists. We also ran checks to make sure the results were reliable and compared peak performance across different years. This approach gives advertisers a clear picture of what drives audience behaviour and helps them plan campaigns at the moments when listeners are most active.
1. Which songs attract the most attention, and which rise consistently throughout the year?
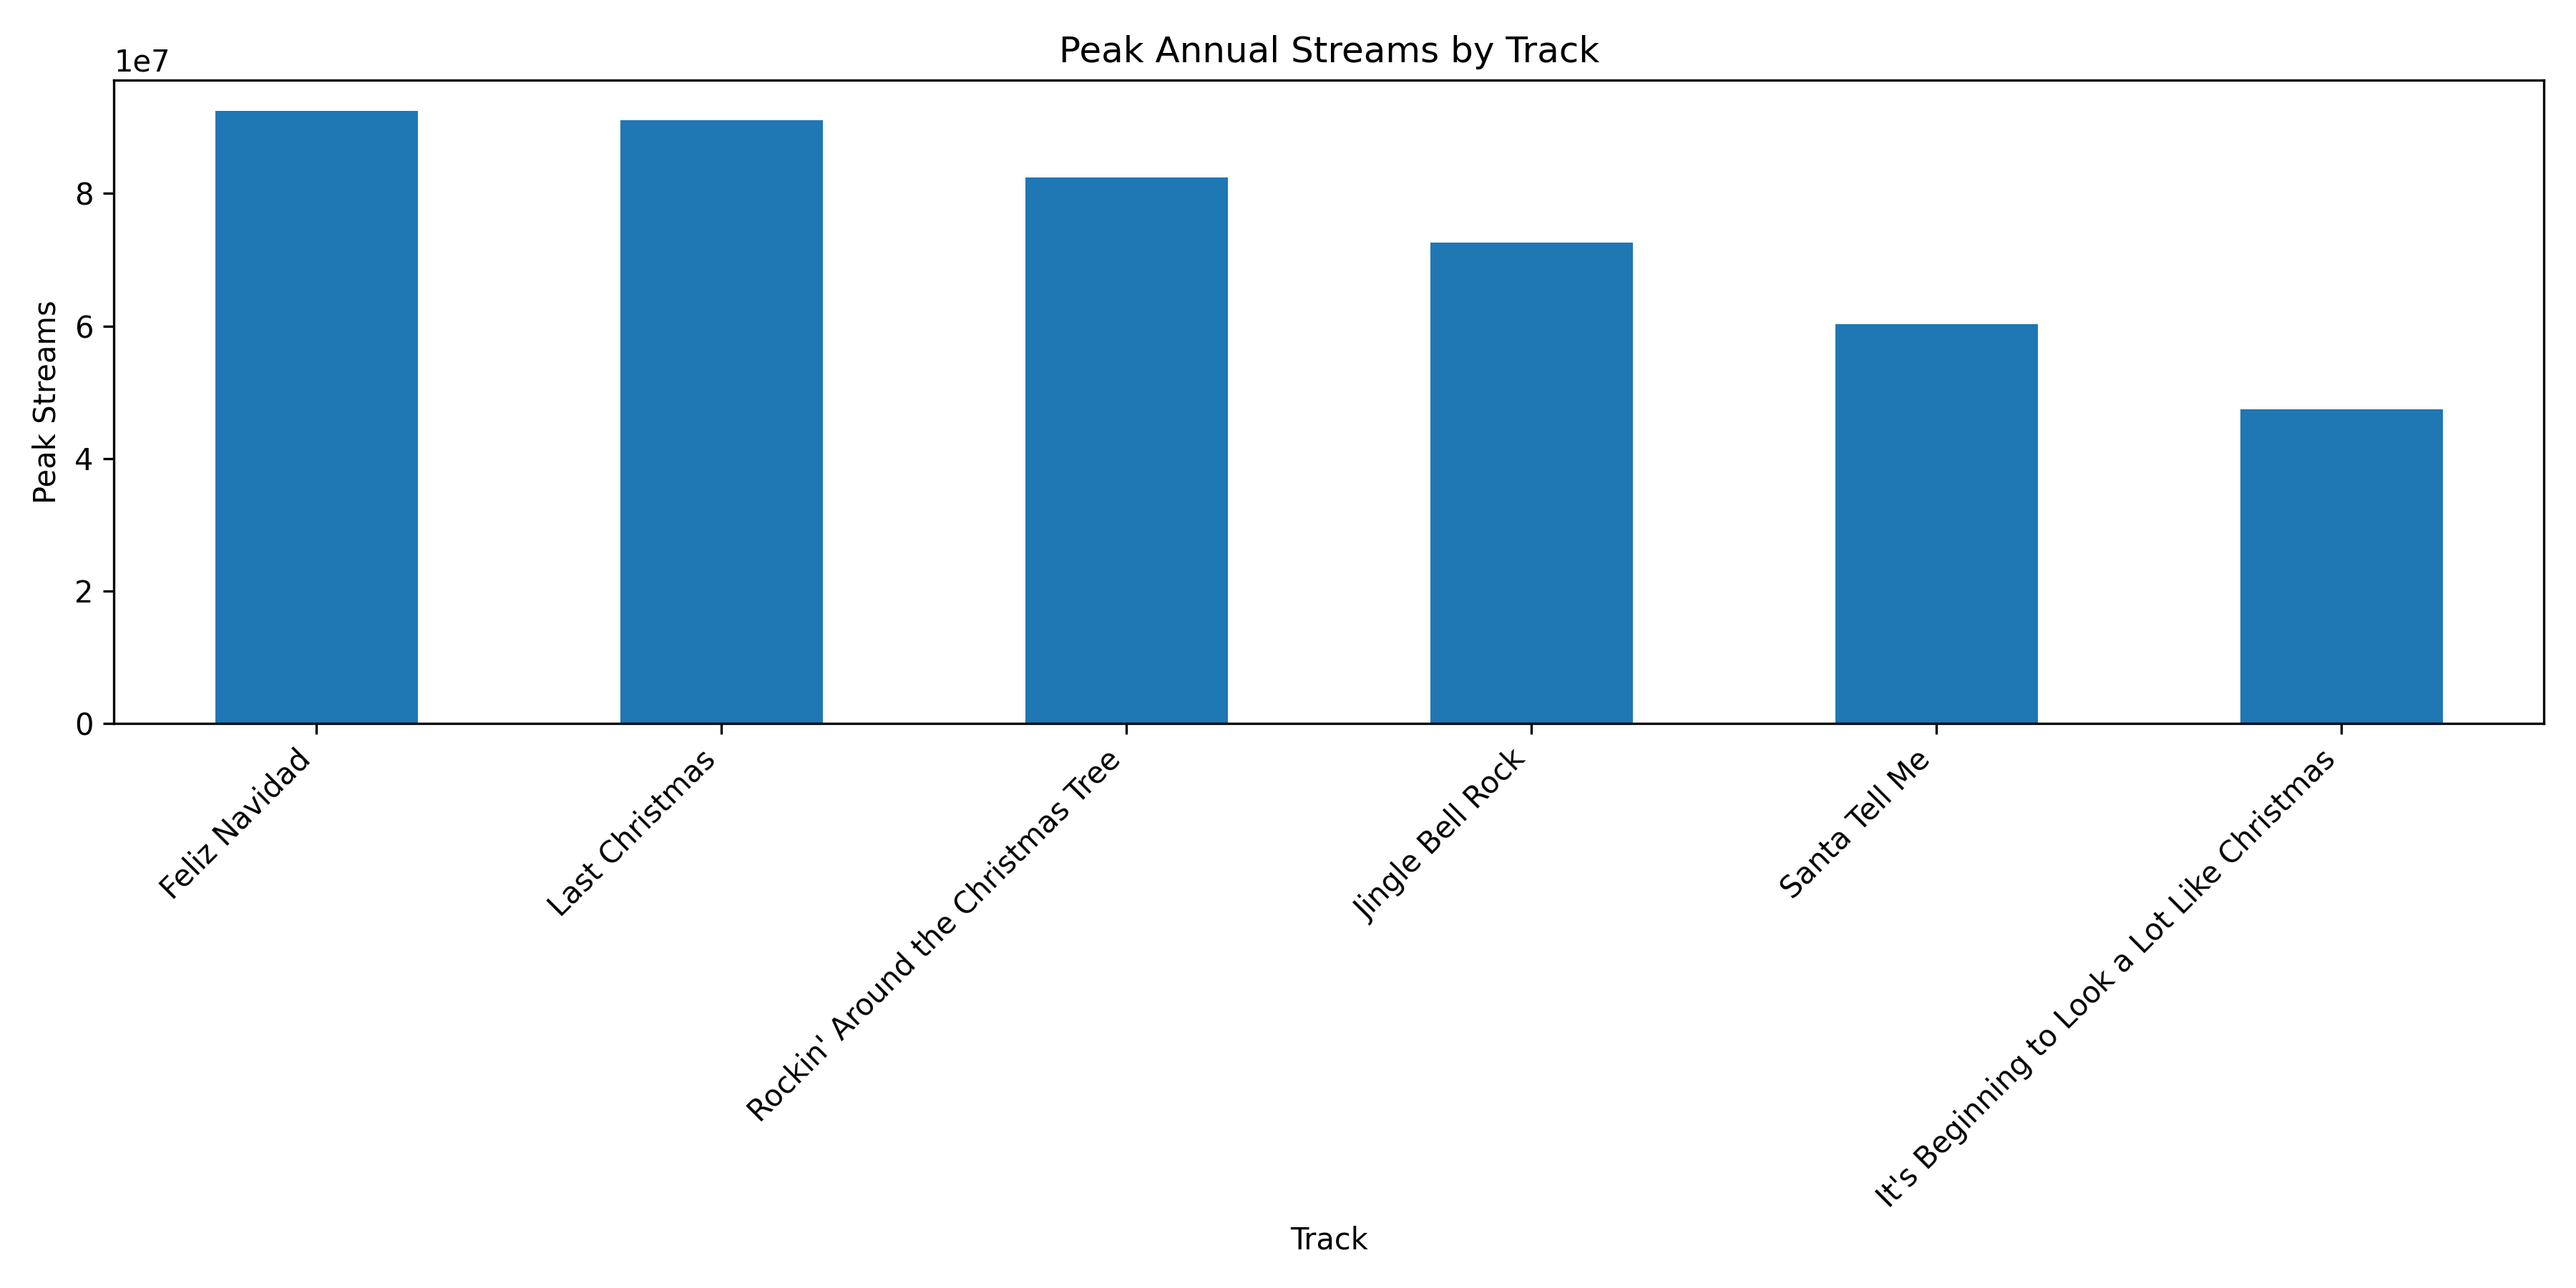
The songs that naturally get the most attention are the classic Christmas hits, such as All I Want for Christmas Is You, Last Christmas, Jingle Bell Rock, and Feliz Navidad. These tracks dominate the charts every holiday season and generate the highest stream counts by a wide margin.
Outside the holiday period, none of these songs steadily grow or maintain momentum. They are highly seasonal, with little to no activity for most of the year. Their popularity appears almost entirely during the late-November to December window.
2. How do weekly listening patterns change across the year, and what shapes these shifts?
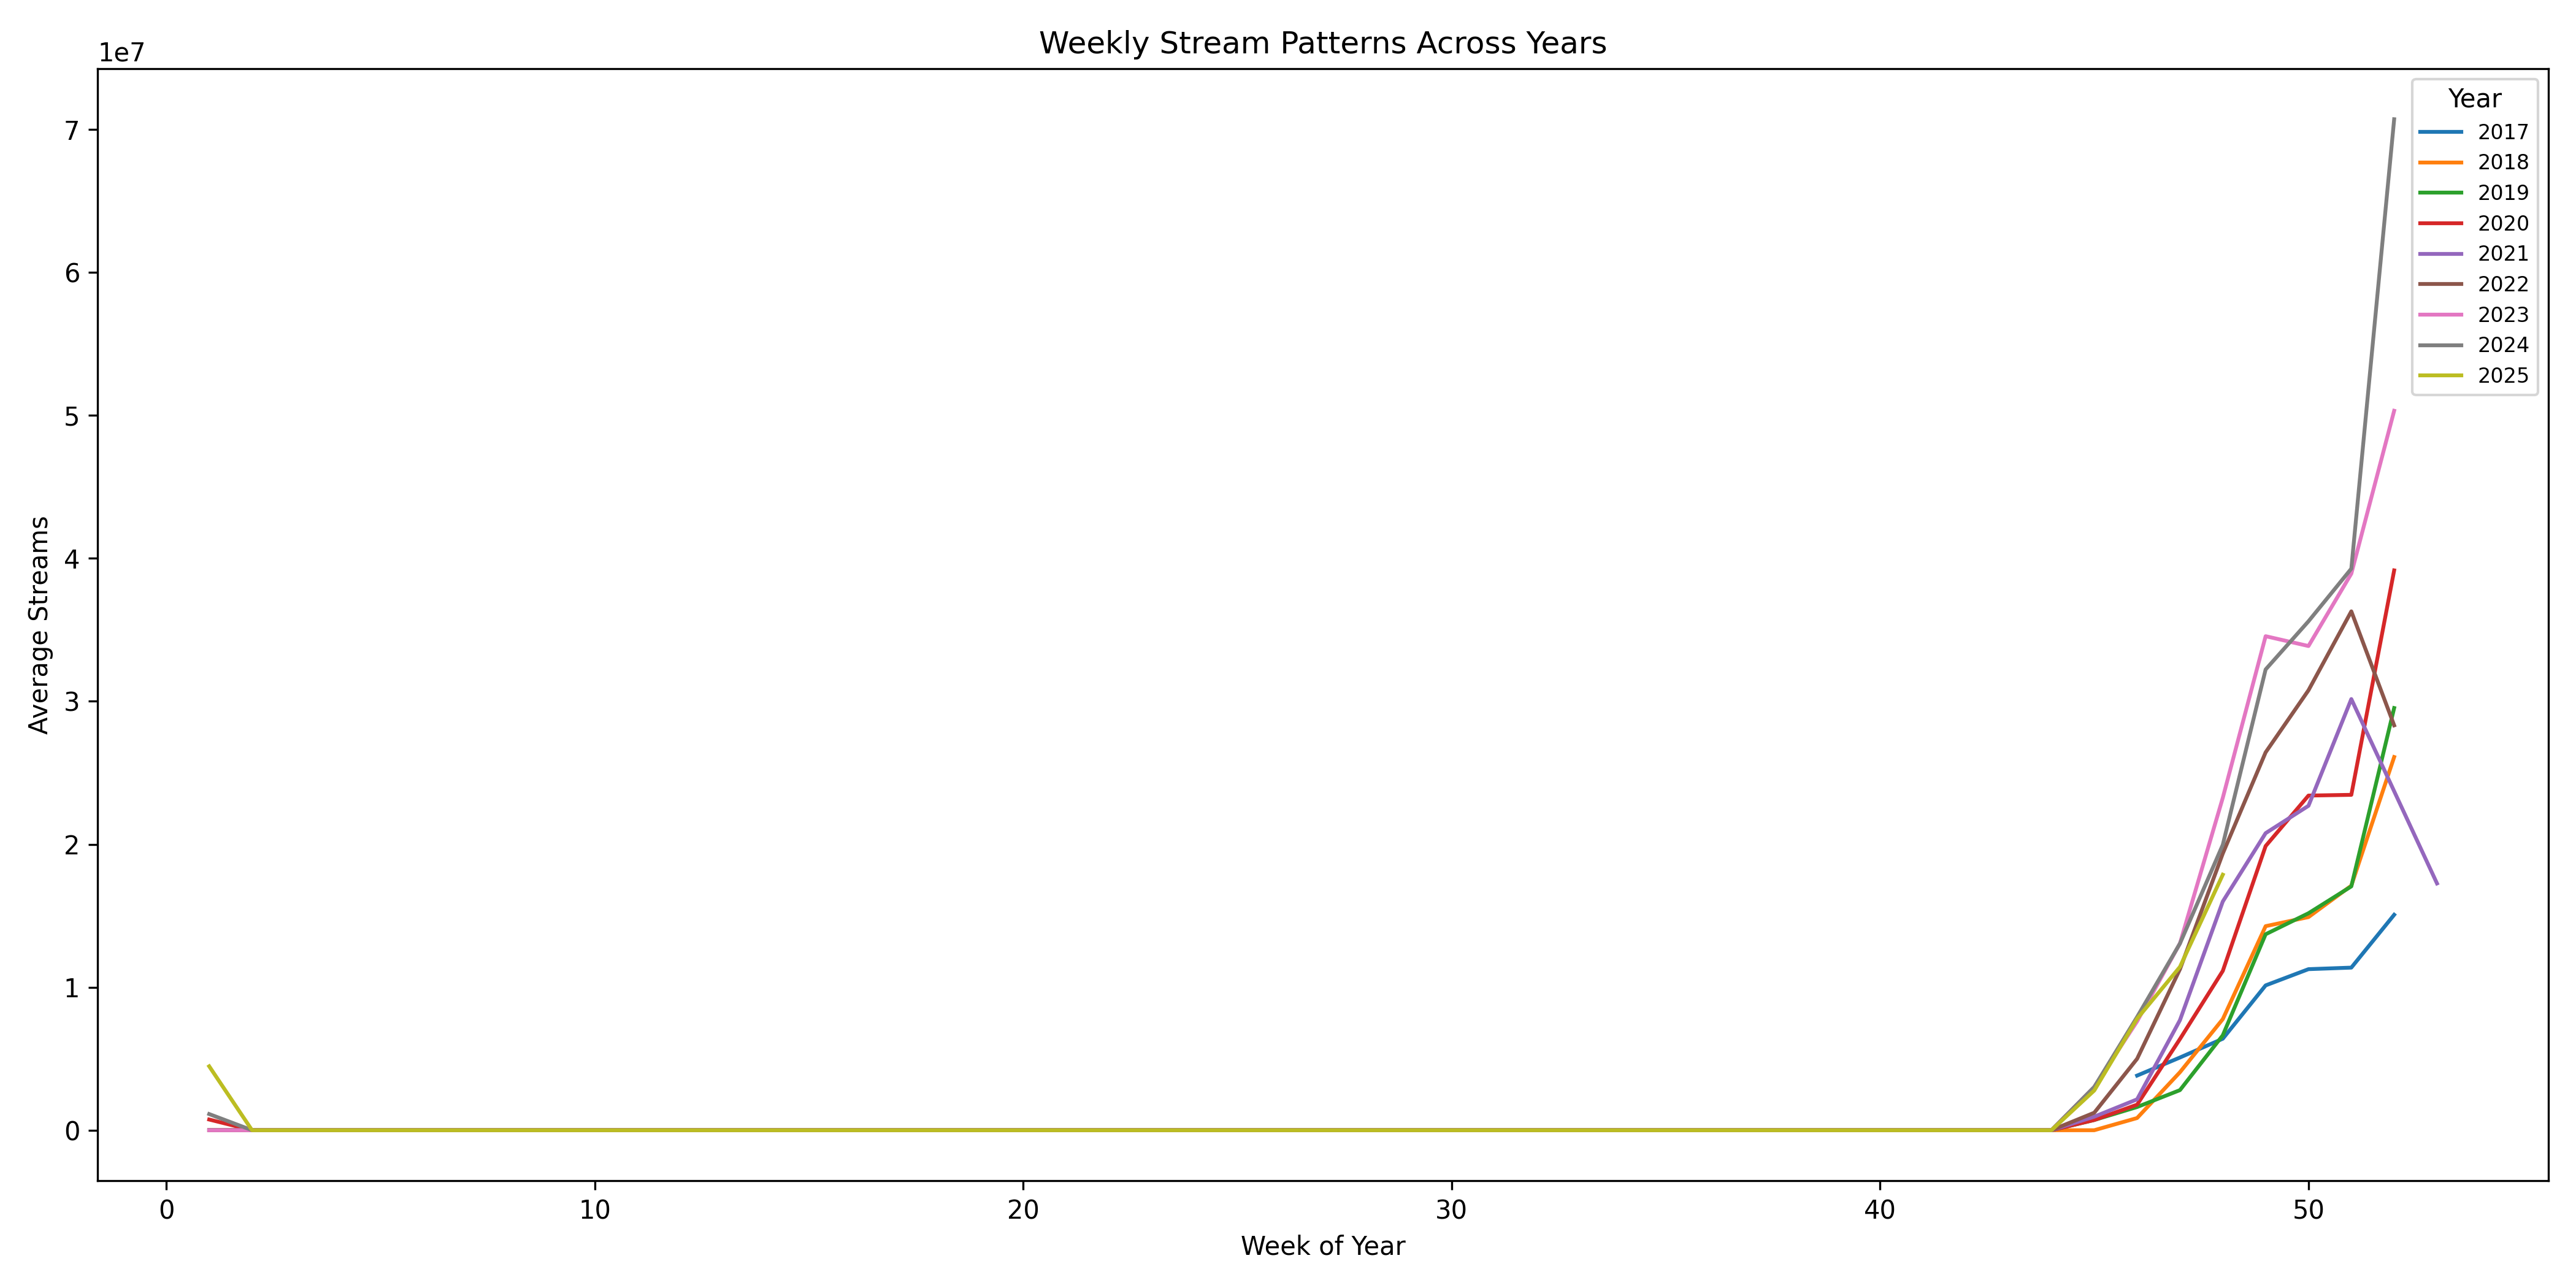
Listening activity is almost completely seasonal. From January to October, streams stay very low or at zero. Interest only starts to rise in mid-November and reaches its peak in the final weeks of December. After New Year's, engagement drops sharply back to near zero.
Over the years, some songs have grown even more popular during their peak season. For example, Mariah Carey's track shows much higher December peaks today than in earlier years. Different songs also peak at different strengths, but all follow the same rise-and-fall holiday pattern.
3. When do popular tracks gain momentum, peak, and taper off?
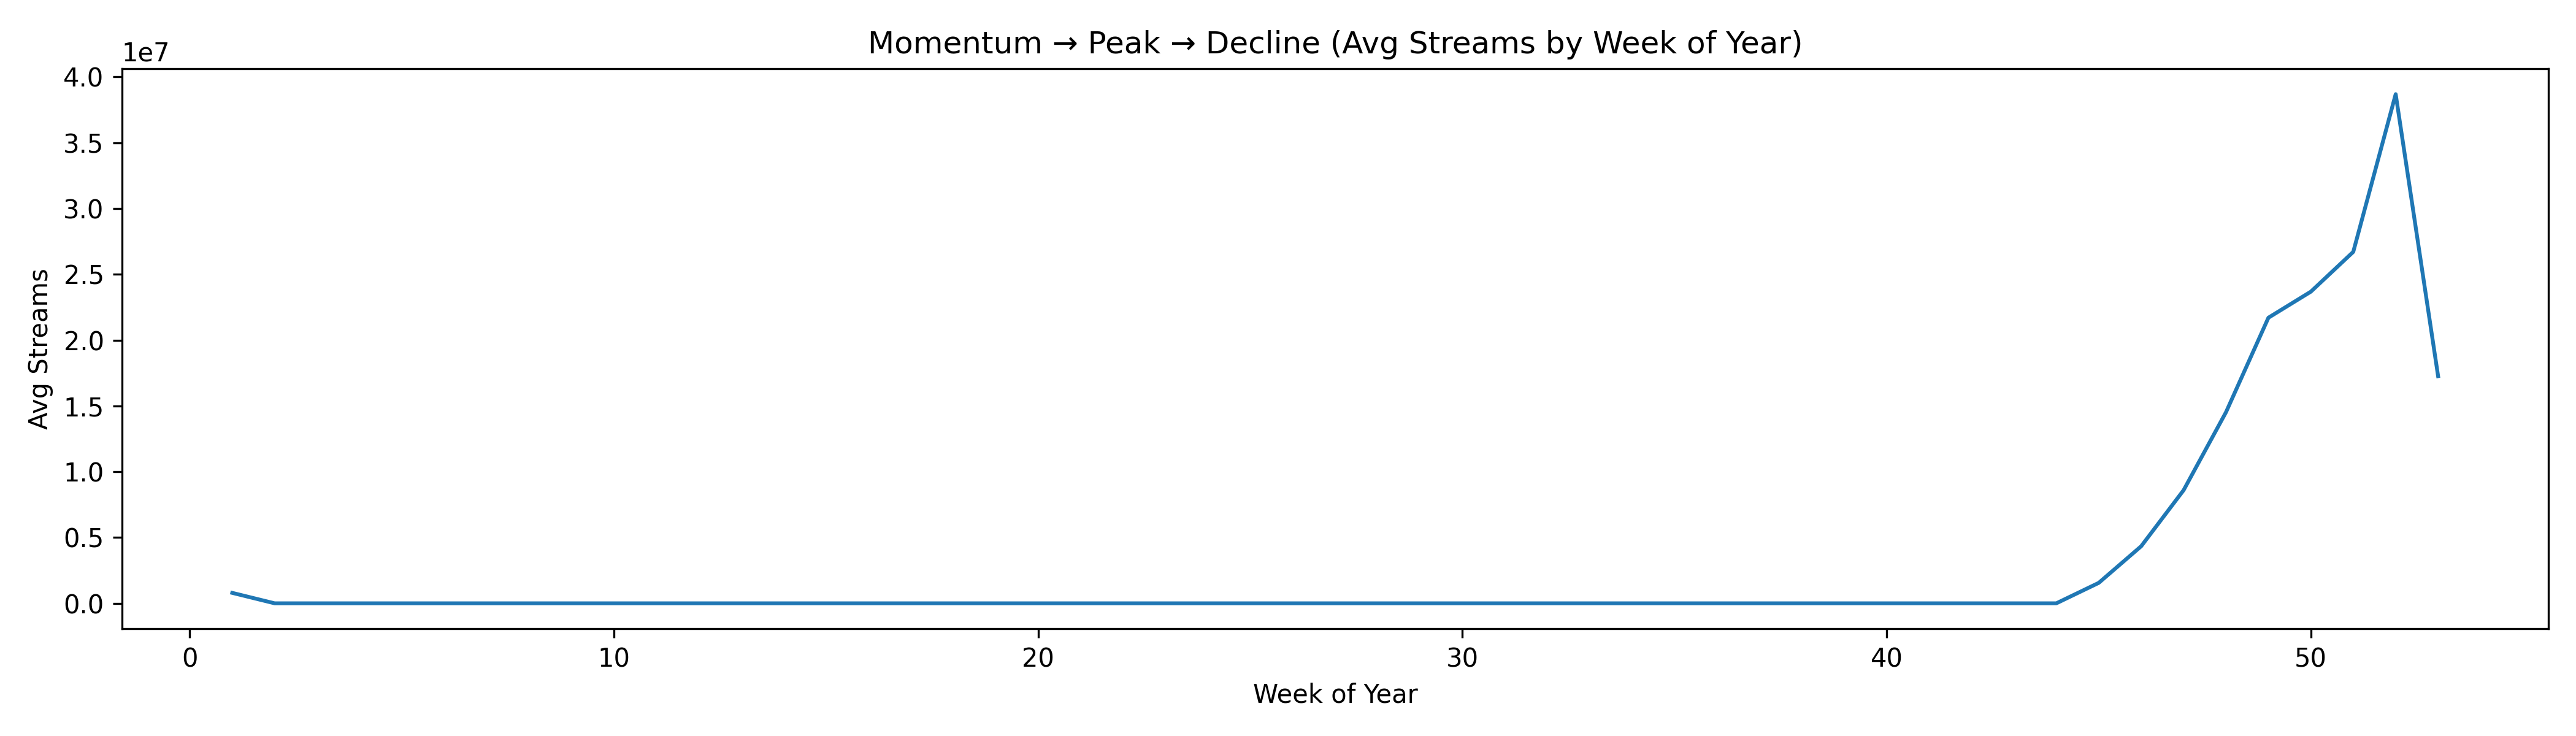
These songs begin gaining momentum in mid-to-late November, when listeners start shifting into the holiday mood. This is the first clear sign of rising weekly attention.
Peak visibility happens in the two to three weeks leading up to Christmas, where engagement reaches its highest point. Right after New Year's, streams drop quickly, often returning to almost zero by the first or second week of January.
4. Do certain days of the week perform better, and can this guide ad timing?
The dataset uses weekly totals, so it does not show day-of-week behaviour. Because of this, we cannot tell which specific days deliver higher engagement or are better for releasing ads or creative.
What the dataset does provide is strong week-by-week guidance. Advertisers can still confidently plan campaign timing by focusing on the weeks where attention rises, peaks, and falls.
5. How can we forecast future high-attention windows for campaigns?
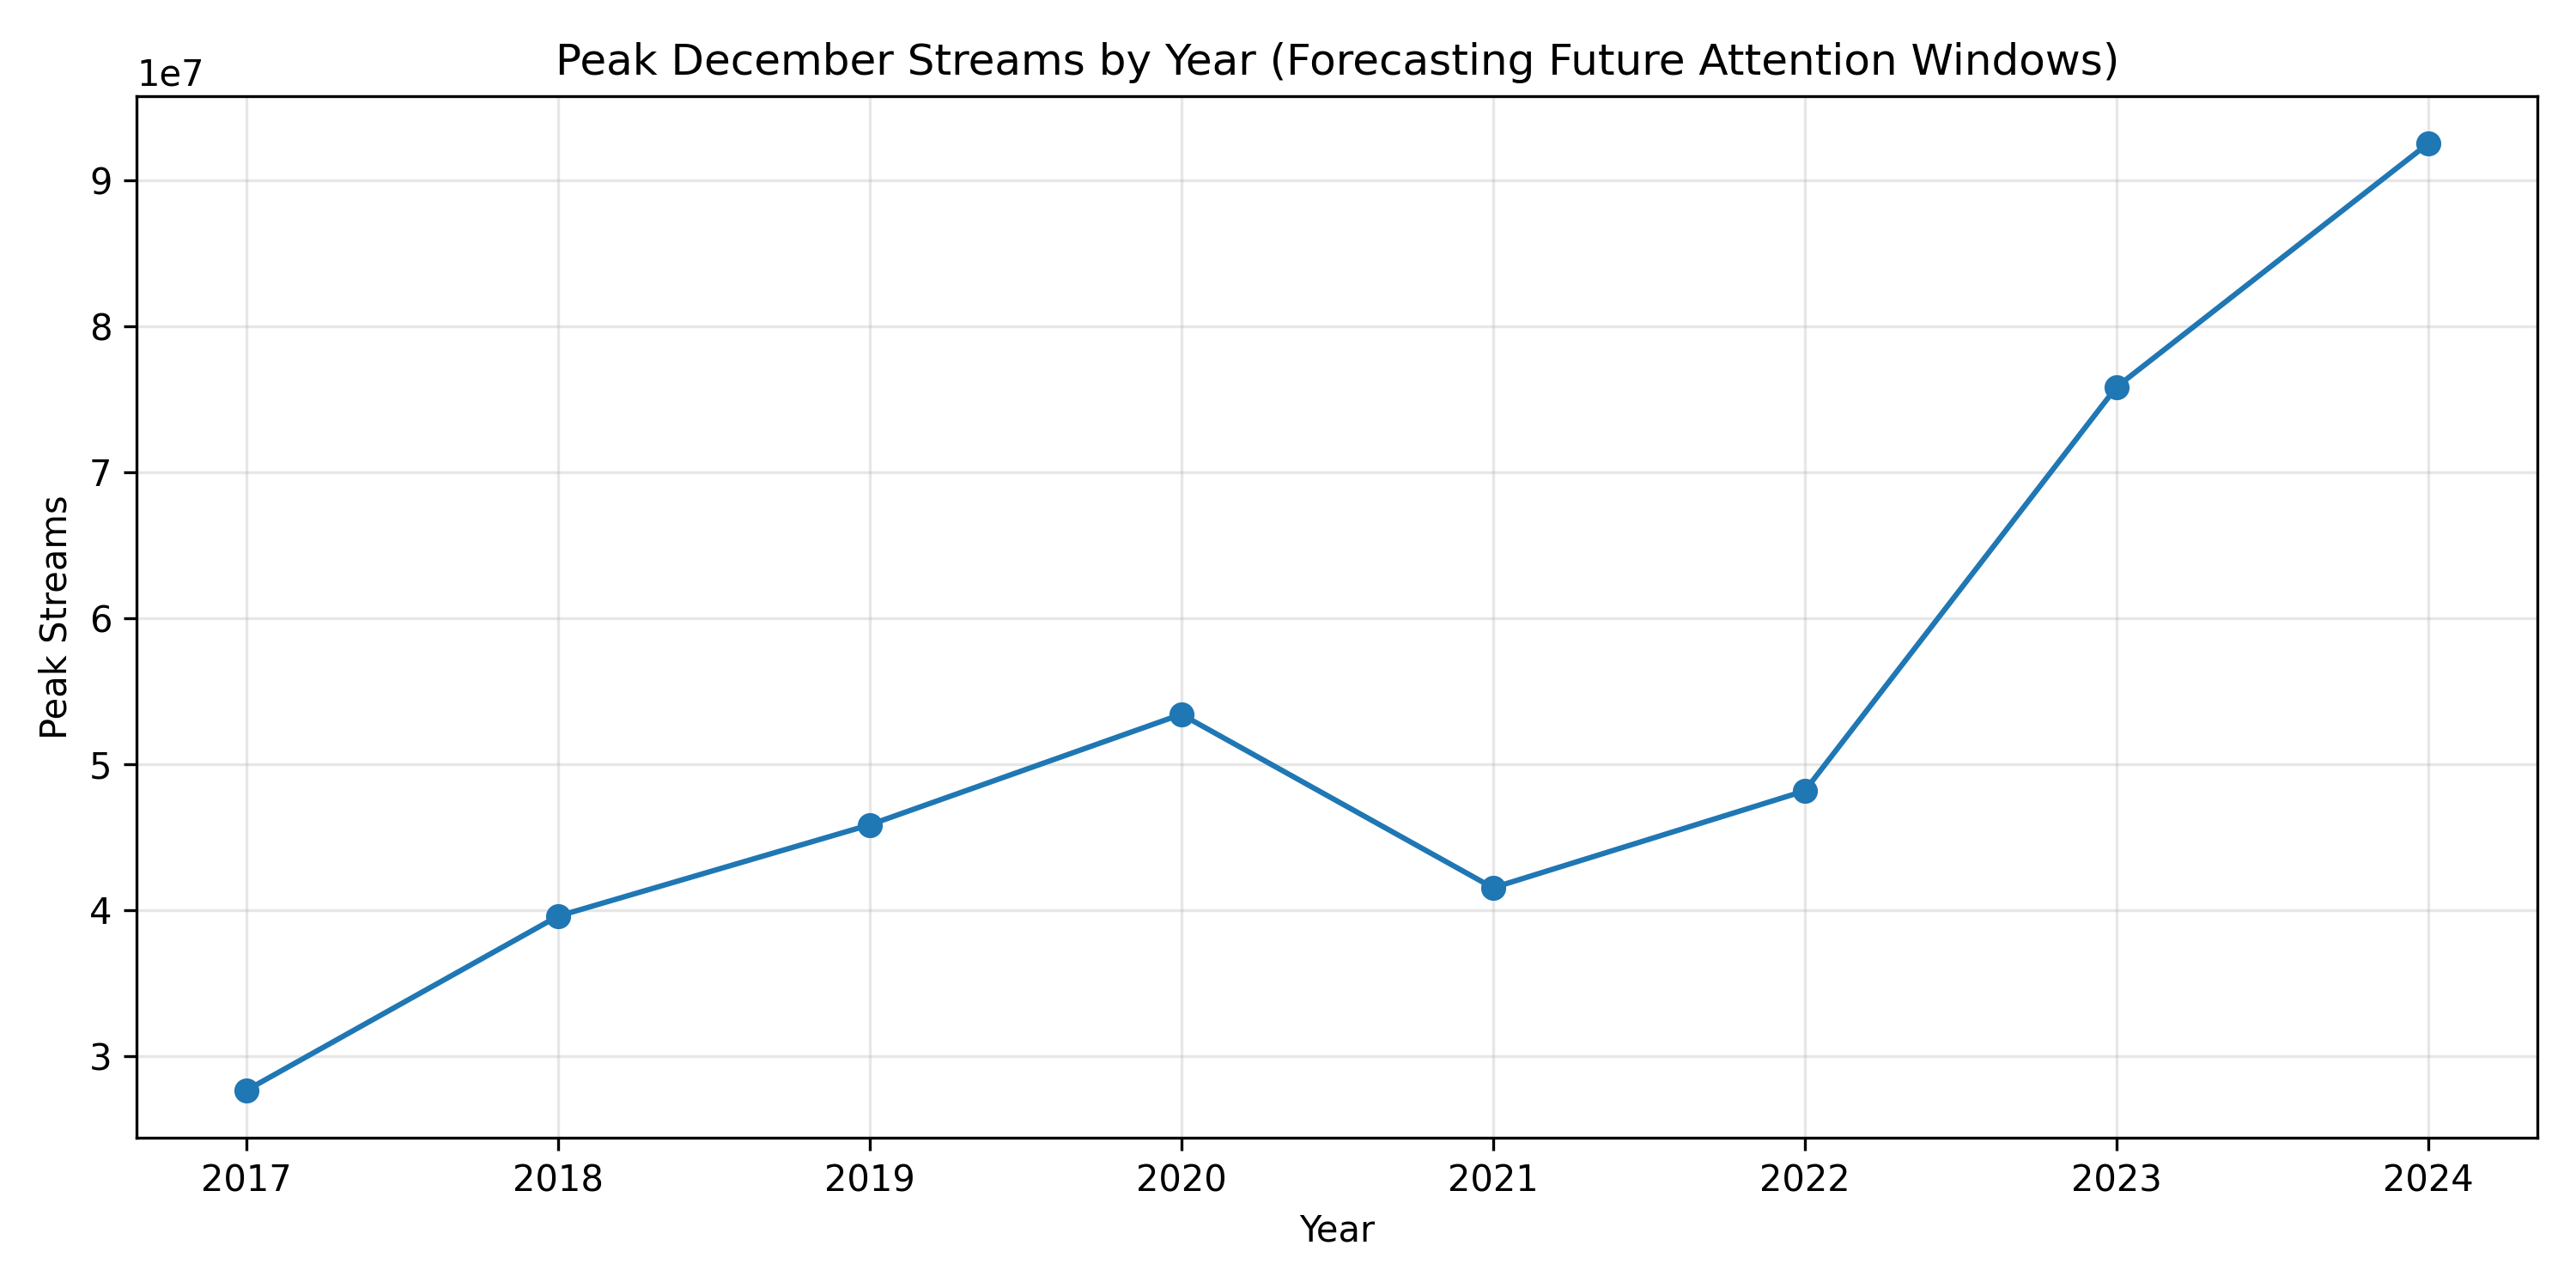
The strongest attention window repeats every year: mid-November through early January. Campaigns should start ramping up as momentum begins, peak spending should happen in the weeks closest to Christmas, and activity should wind down quickly in early January.
Year-over-year patterns also show whether certain tracks are becoming more or less popular during their peak. This helps advertisers know which songs deserve higher investment. Overall, the seasonal pattern is extremely predictable, making it easy to schedule promotions around the weeks where listeners are most active.
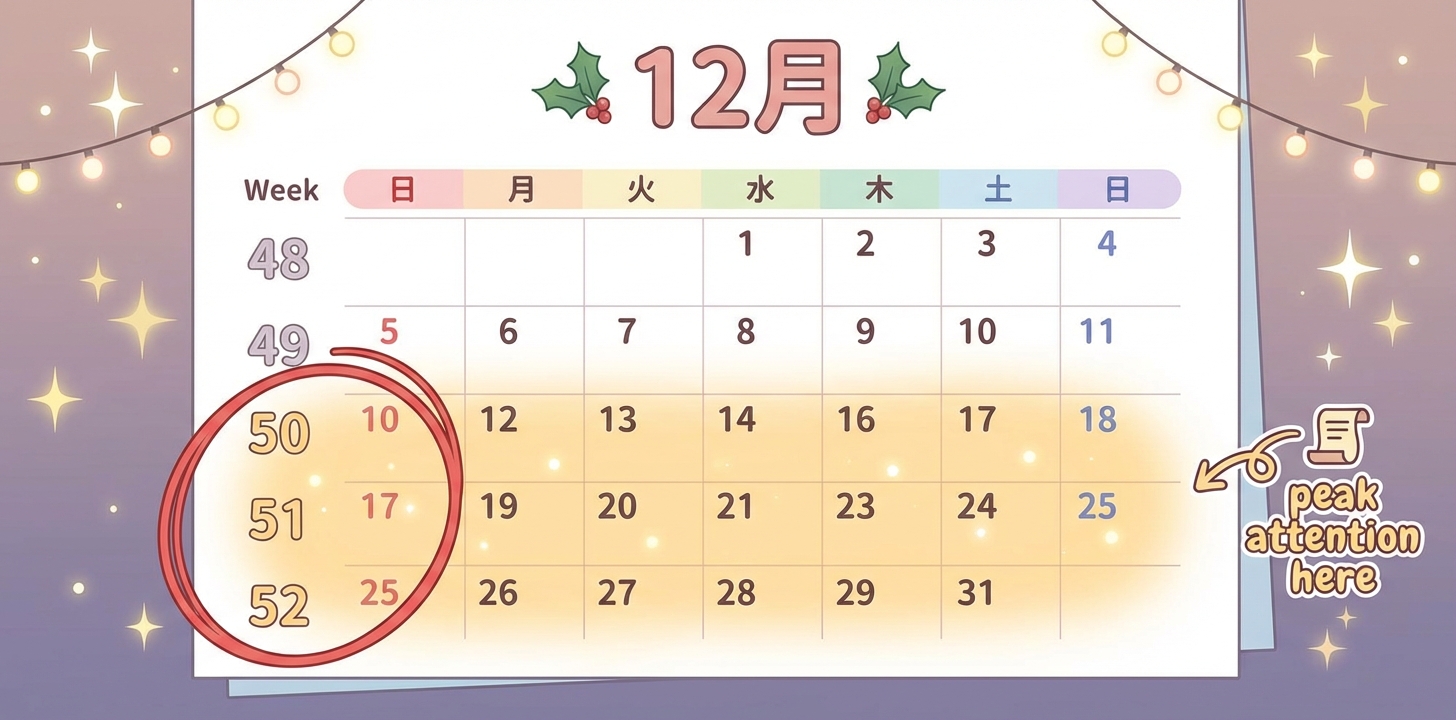
Conclusion
The data shows that Christmas campaigns work best when they start in mid-November, just as listener interest begins to rise. The strongest performance happens in weeks 50–52, so this is where brands should place most of their budget. While the dataset doesn't show which days perform better, it clearly highlights the weeks that matter most. Campaigns should warm up in late November, build through December, and wind down shortly after New Year's when attention drops quickly.
Looking ahead, the peak season is not only predictable but getting stronger for many top tracks. This gives advertisers confidence to schedule promotions early, invest heavily in the final weeks before Christmas, and prioritise the songs that consistently perform best. These insights create a simple, reliable guide for planning seasonal campaigns and making sure budgets follow real audience behaviour.