Predicting Sales Cycles
How e-commerce sellers use data analytics to improve business
Overview
E-commerce sellers often struggle with the ups and downs of weekly sales. Stocking too much during slow weeks ties up money, while running out of stock in peak weeks means lost revenue. These swings also make it harder to plan promotions and manage cash flow with confidence.
This analysis looks at sales patterns over time to show when revenue rises or falls. By identifying peak, normal, and slow weeks—and putting numbers on the differences—it helps sellers plan inventory, marketing, and finances more accurately for the future.
Data Sources and Methodology
We analyzed a dataset of 34,500 transaction records spanning from September 2023 to September 2025 (a two-year period). Each record contained 17 columns of transactional and operational details, with no missing values, ensuring data integrity throughout the analysis.
Our analysis focused on key business performance variables, including:
- Revenue (total_amount)
- Profit margin
- Discounts applied
- Order count
- Delivery time
- Product returns
The transaction dates were converted into a datetime index, which allowed us to explore temporal trends such as seasonality, sales phases, and long-term revenue patterns. By structuring the dataset in this way, we were able to link operational factors (like delivery time and returns) with sales performance, and to identify clear revenue cycles.
The goal of this dataset analysis was to uncover how time and seasonality shape weekly revenue patterns, and to provide insights that e-commerce sellers can use to plan inventory, promotions, and cash flow with greater precision.
Q1: Which part of my business should I track closely if I want to understand sales performance?
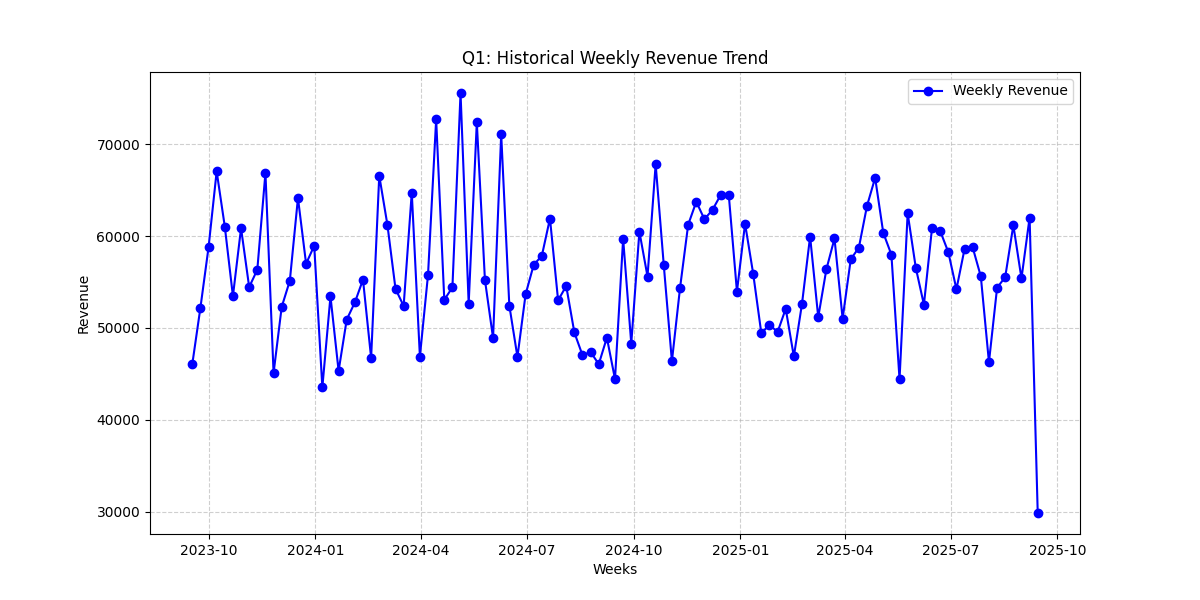
The strongest driver of sales performance is weekly revenue, as it directly reflects the ups and downs of the business. Revenue is highly responsive to seasonal phases, such as peak and slow periods, while the overall time index shows little relationship with sales. This means that tracking weekly revenue gives the clearest view of performance.
The revenue trend highlights noticeable spikes during peak weeks and drops during slow cycles. These repeating patterns confirm that sales are shaped by predictable seasonal cycles rather than random variation. For an e-commerce seller, the focus should be on monitoring weekly revenue trends and seasonal cycles instead of relying only on total orders or average order value. This enables better planning for promotions, inventory, and staffing.
Q2: Do my sales really follow a pattern, or are they just random ups and downs?
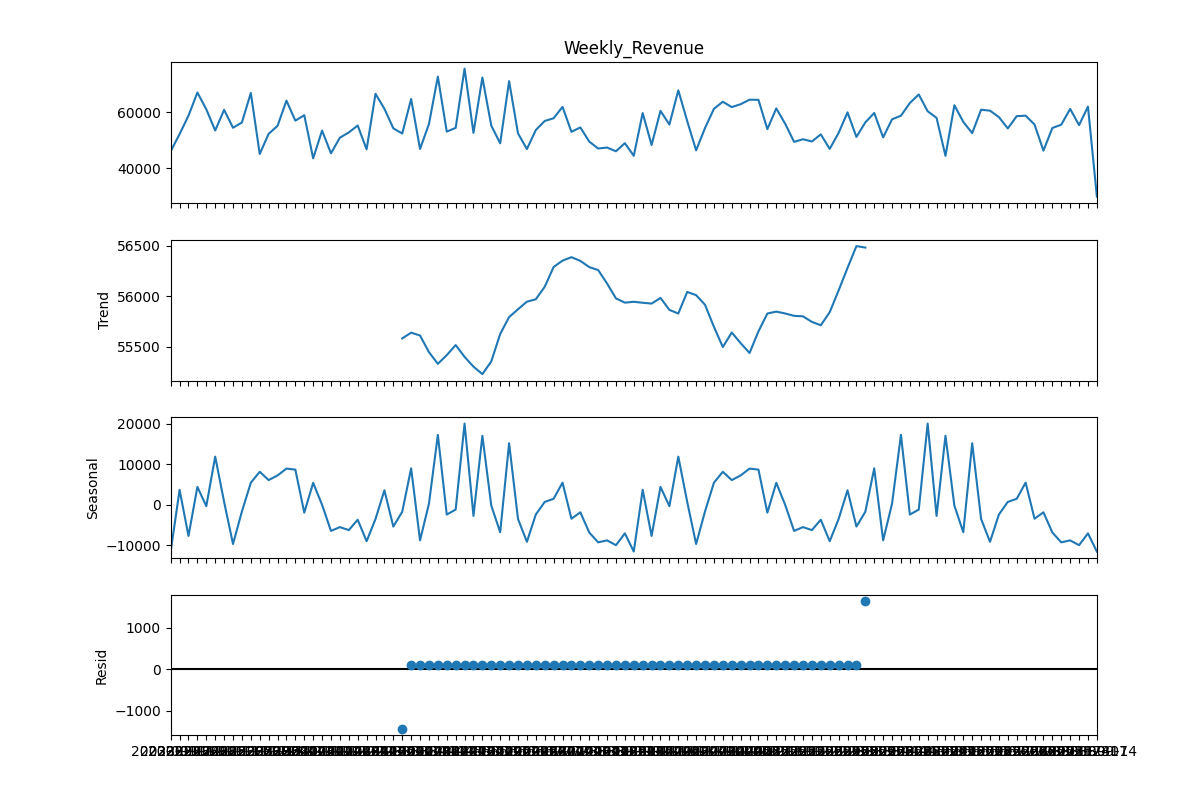
Your sales follow clear and predictable patterns rather than random fluctuations. Seasonal cycles show that festive or peak weeks consistently lift revenue, while quieter weeks pull it down. The trend component remains relatively stable over time, while the seasonal component shows large swings – often several thousand units above or below the baseline.
The residual effect is relatively small, indicating that most of the variation in sales is explained by seasonality and trend, not randomness. This confirms that revenue is shaped by recurring cycles and can be anticipated, giving sellers the confidence to prepare for high and low demand periods instead of being caught off guard.
Q3: Can I group my weeks into high sales, normal sales, and slow sales to plan inventory and promotions?
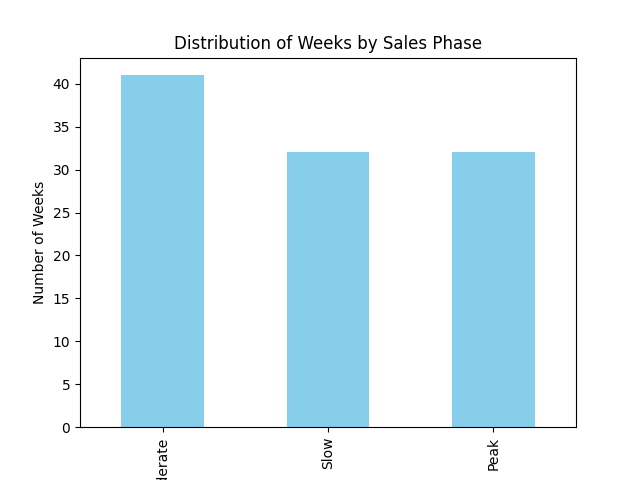
Yes, your sales weeks can be grouped into clear phases that provide useful guidance for planning. Across the two-year dataset, about 41 weeks fall into a Moderate phase, 32 into Slow, and another 32 into Peak. This shows that revenue naturally falls into three categories that can be planned around.
This classification turns raw fluctuations into actionable sales cycles. For an e-commerce seller, this means promotions and stock-ups can be concentrated in Peak weeks, steady operations maintained in Moderate weeks, and cost-saving or targeted campaigns used in Slow weeks. Such grouping provides a structured way to align marketing and inventory strategies with actual demand cycles.
Q4: Which factors really move my revenue up or down?
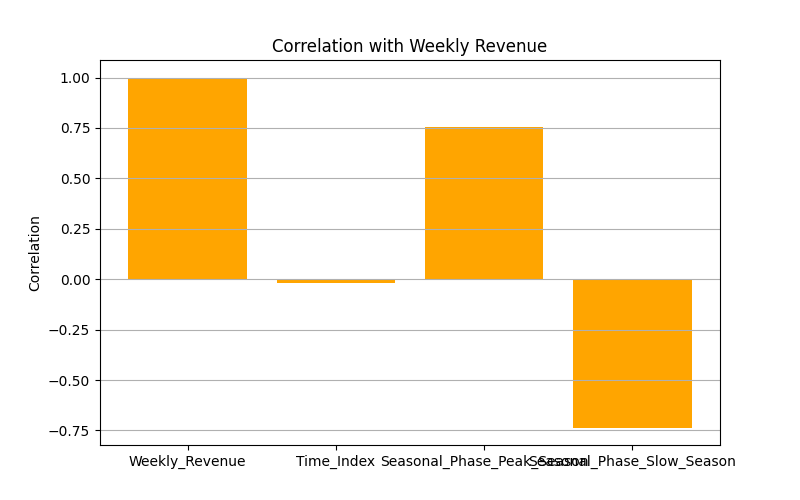
The analysis shows that seasonality is the strongest factor affecting revenue. Peak Season weeks are strongly associated with higher revenue, while Slow Season weeks are linked with lower revenue. By comparison, the passage of time itself has almost no effect, showing that sales do not simply increase or decrease without seasonal influences.
For e-commerce sellers, this means the most reliable lever for revenue planning is seasonal timing. Preparing for peak weeks with promotions and inventory, while mitigating losses in slow weeks, is the most effective way to manage revenue fluctuations.
Q5: How do I know if these patterns will hold in the future, not just in the past?
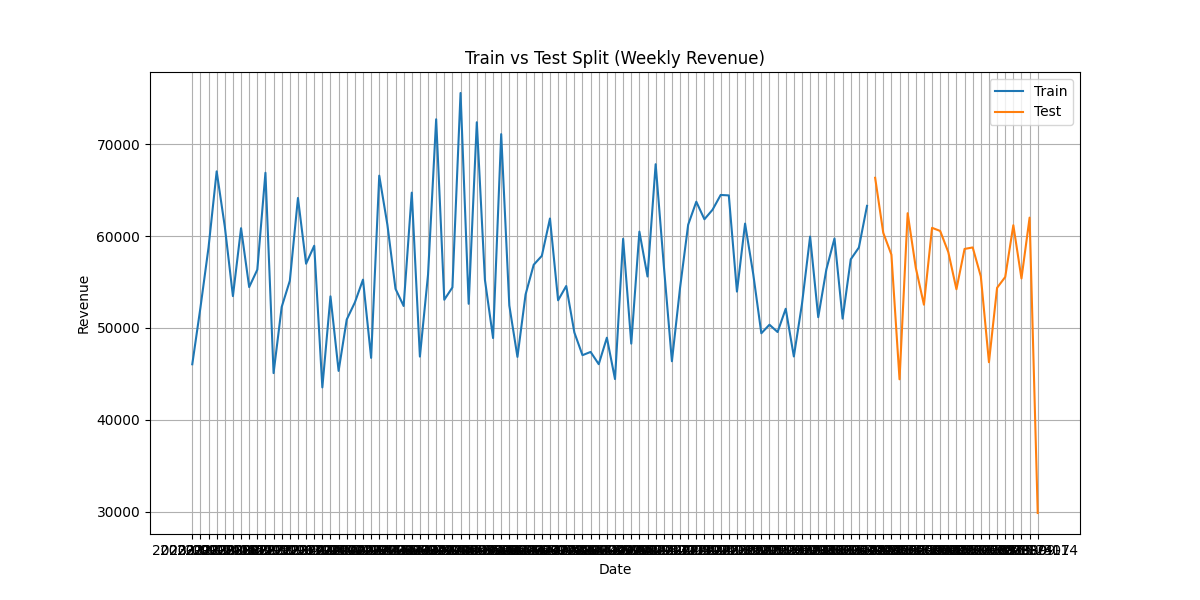
The dataset was split chronologically, with the first 80% of weeks used for training and the last 20% reserved for testing. This ensures the model is validated on unseen data, mimicking how it would perform in real forecasting.
The test period covered about 21 weeks, which was long enough to confirm that seasonal cycles persist beyond the training period. The model's ability to capture peak and slow patterns in this test window proves that these cycles are not only historical but also predictive of future weeks. For sellers, this provides confidence that seasonal planning will remain valid going forward.
Q6: Can I put numbers on how much more I earn in peak season, and how much I lose in slow season?
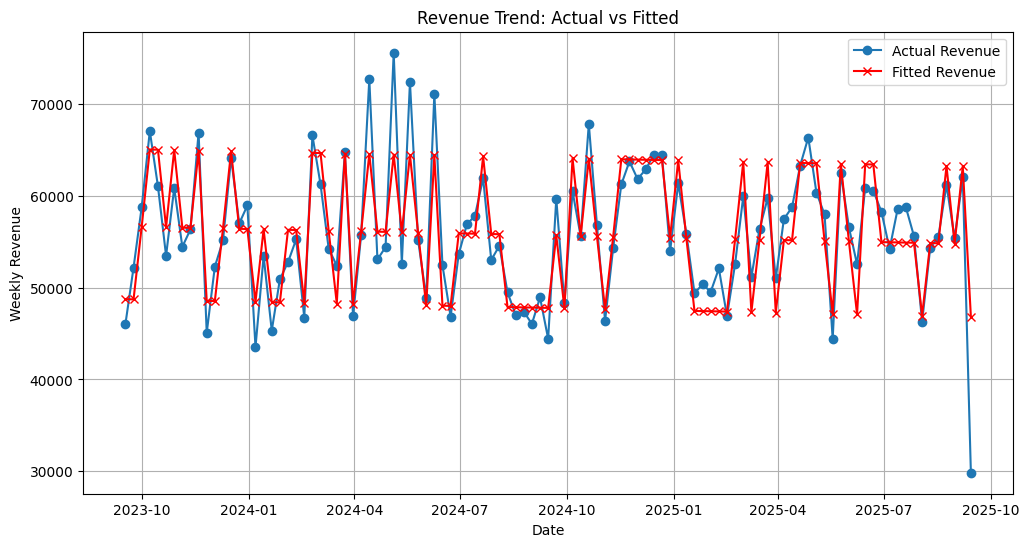
Yes – the regression results quantify the seasonal effects. On average, Peak Season weeks increase revenue by about RM8,430 compared to Moderate weeks, while Slow Season weeks reduce revenue by around RM7,914. These values are statistically significant and show the real financial impact of seasonal phases.
The fitted results closely track actual revenue, rising during peak weeks and dipping in slow weeks. For sellers, this provides concrete numbers: expect roughly RM8k more in strong periods and RM8k less in weak ones. This enables realistic target setting, advertising planning, and inventory alignment with expected demand.
Q7: Can this model really predict my sales accurately enough to plan my business?
The regression evaluation shows that the model is accurate enough for practical planning. It explains about 78% of weekly revenue variation, meaning most sales ups and downs are captured by the seasonal patterns it identifies. Both Peak and Slow Season effects are statistically significant, while the time trend is weak and not meaningful.
This proves that seasonality is the true driver of revenue, and the model consistently captures it. For e-commerce sellers, the model provides a reliable tool for forecasting and planning – not for exact week-to-week precision, but as a strong guide to when sales will rise or fall.
Prediction 1: What will my weekly sales look like over the next three months if nothing changes?
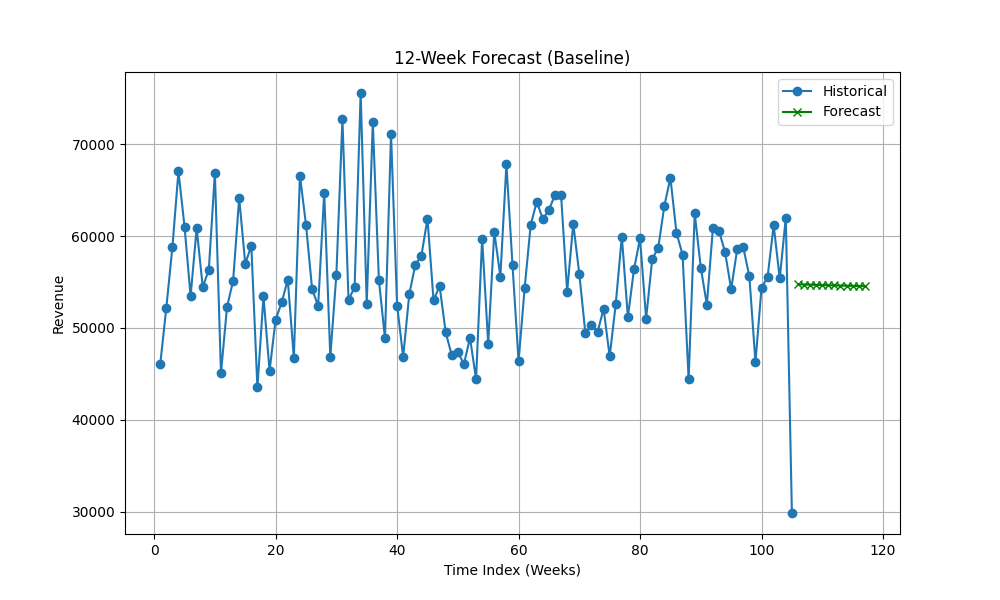
The baseline forecast shows that if pricing, seasonal cycles, and customer behavior stay the same, weekly sales will remain stable at around RM54k–55k over the next 12 weeks. Historical fluctuations show peaks and troughs, but the forecast levels into a steady trend.
These stable projections provide a reliable baseline for managing cash flow and promotions while being ready to capitalize when seasonal spikes occur.
Prediction 2: How much more can I earn if I turn a slow week into a normal week with promotions?
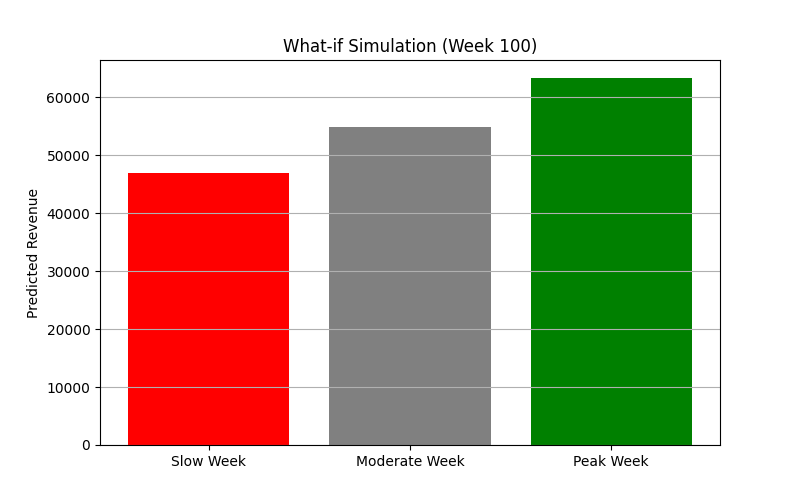
The what-if simulation quantifies the value of promotions. A slow week averages about RM47k, a moderate week RM55k, and a peak week RM63k. Shifting just one week from slow to moderate adds roughly RM8k, and moving two weeks adds around RM16k.
For an e-commerce seller, this shows that well-timed promotions during slow weeks can deliver meaningful revenue gains and make sales patterns more predictable, provided promotional costs are managed effectively.
Prediction 3: Can I trust this model to match my past sales closely enough to guide my decisions?
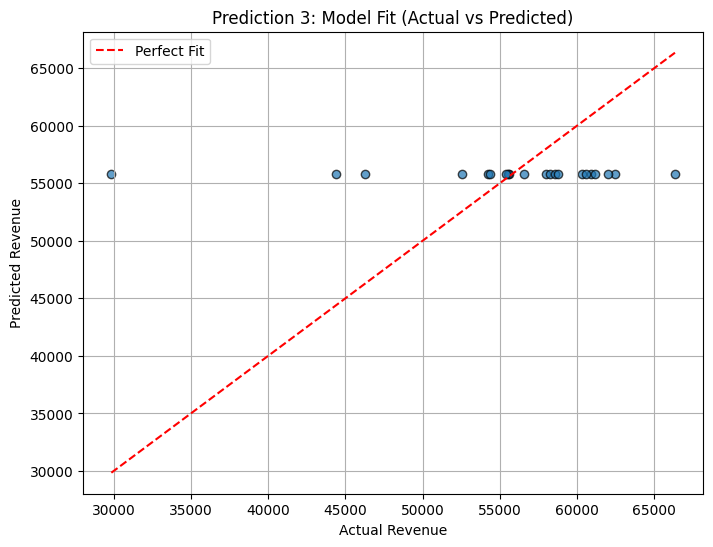
Comparing actual versus predicted revenue shows that the model captures the general average but smooths over sharp peaks and troughs. Most predictions cluster around RM55k–57k, while actual sales range more widely from RM30k to RM65k.
This means the model is useful as a baseline for average revenue but less precise in extreme weeks. It works best for planning broad trends rather than exact week-to-week sales.
Prediction 4: How much did a past event, like a policy change or promotion, really affect my sales?
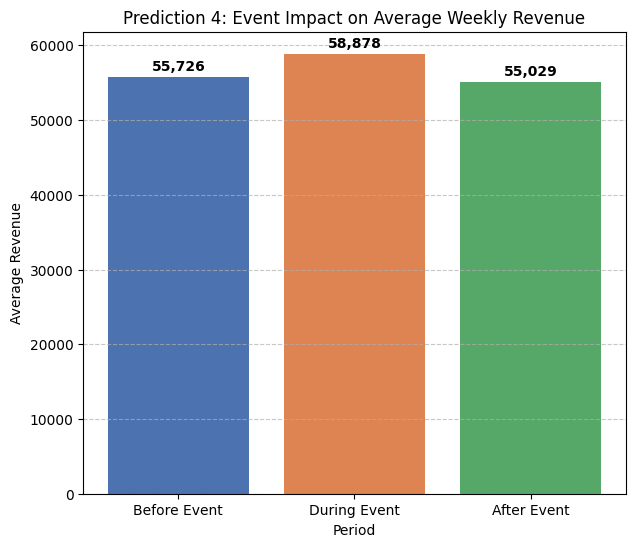
The event analysis reveals a temporary sales boost during the event period. Average weekly revenue rose to RM58,878 during the event, compared with RM55,726 before and RM55,029 after. This shows an uplift of around RM3,000 linked to the event.
For sellers, this demonstrates that events such as government subsidies, policy changes, or platform promotions can temporarily raise revenue but do not sustain long-term growth. These events should be treated as tactical opportunities, supported by stock-ups or marketing pushes, while maintaining strategies to manage sales once the boost ends.
Conclusion
The analysis confirms that your sales follow clear seasonal cycles, giving you a predictable structure to plan around. Peak Season weeks consistently add about RM8,400 in revenue, while Slow Season weeks reduce sales by roughly RM7,900 compared to normal weeks. These numbers provide a reliable benchmark to guide how you manage stock, campaigns, and cash flow.
For inventory planning, the best time to stock up is ahead of Peak weeks, when demand reliably surges. Being cautious during Slow weeks prevents excess stock and tied-up capital. Promotions also work best in Peak weeks, where the return is strongest, while smaller targeted campaigns in Slow weeks help smooth out revenue dips without overspending.
The forecasting model explains around 78% of sales variation, offering both a solid baseline (about RM54k–55k per week under current conditions) and the ability to test what-if scenarios. This means you can plan not just for typical cycles but also simulate how promotions or events might change outcomes. In short, aligning stock, marketing, and finances with these seasonal patterns gives sellers a practical way to run the business with greater confidence and control.