A busy sales team, and the few products worth their time.Illustration · Data Stories Lab
Sales & product mix
Selling the Right Products
Focus selling on the few products that profit
Data Stories LabAnalyst reportProduct portfolio · Pareto
Sales teams are busy, but not all sales effort leads to good results. With many products to sell, it is easy for time and attention to be spread across items that do not truly drive profit. This makes it difficult for sales managers to know where the team should focus.
This analysis helps sales managers see which products truly matter, which products look busy but add little value, and where sales effort should be reduced. The goal is to improve results by focusing on the right products, not by asking the team to work harder or sell everything.
The numbers
Pareto
profit pattern
Mountain-200
hero products
Few
drive profit
Mix
beats effort
“The main opportunity is to improve product mix, not sales execution.”
What the data shows
1. Do a small number of products generate most of our revenue and profit?
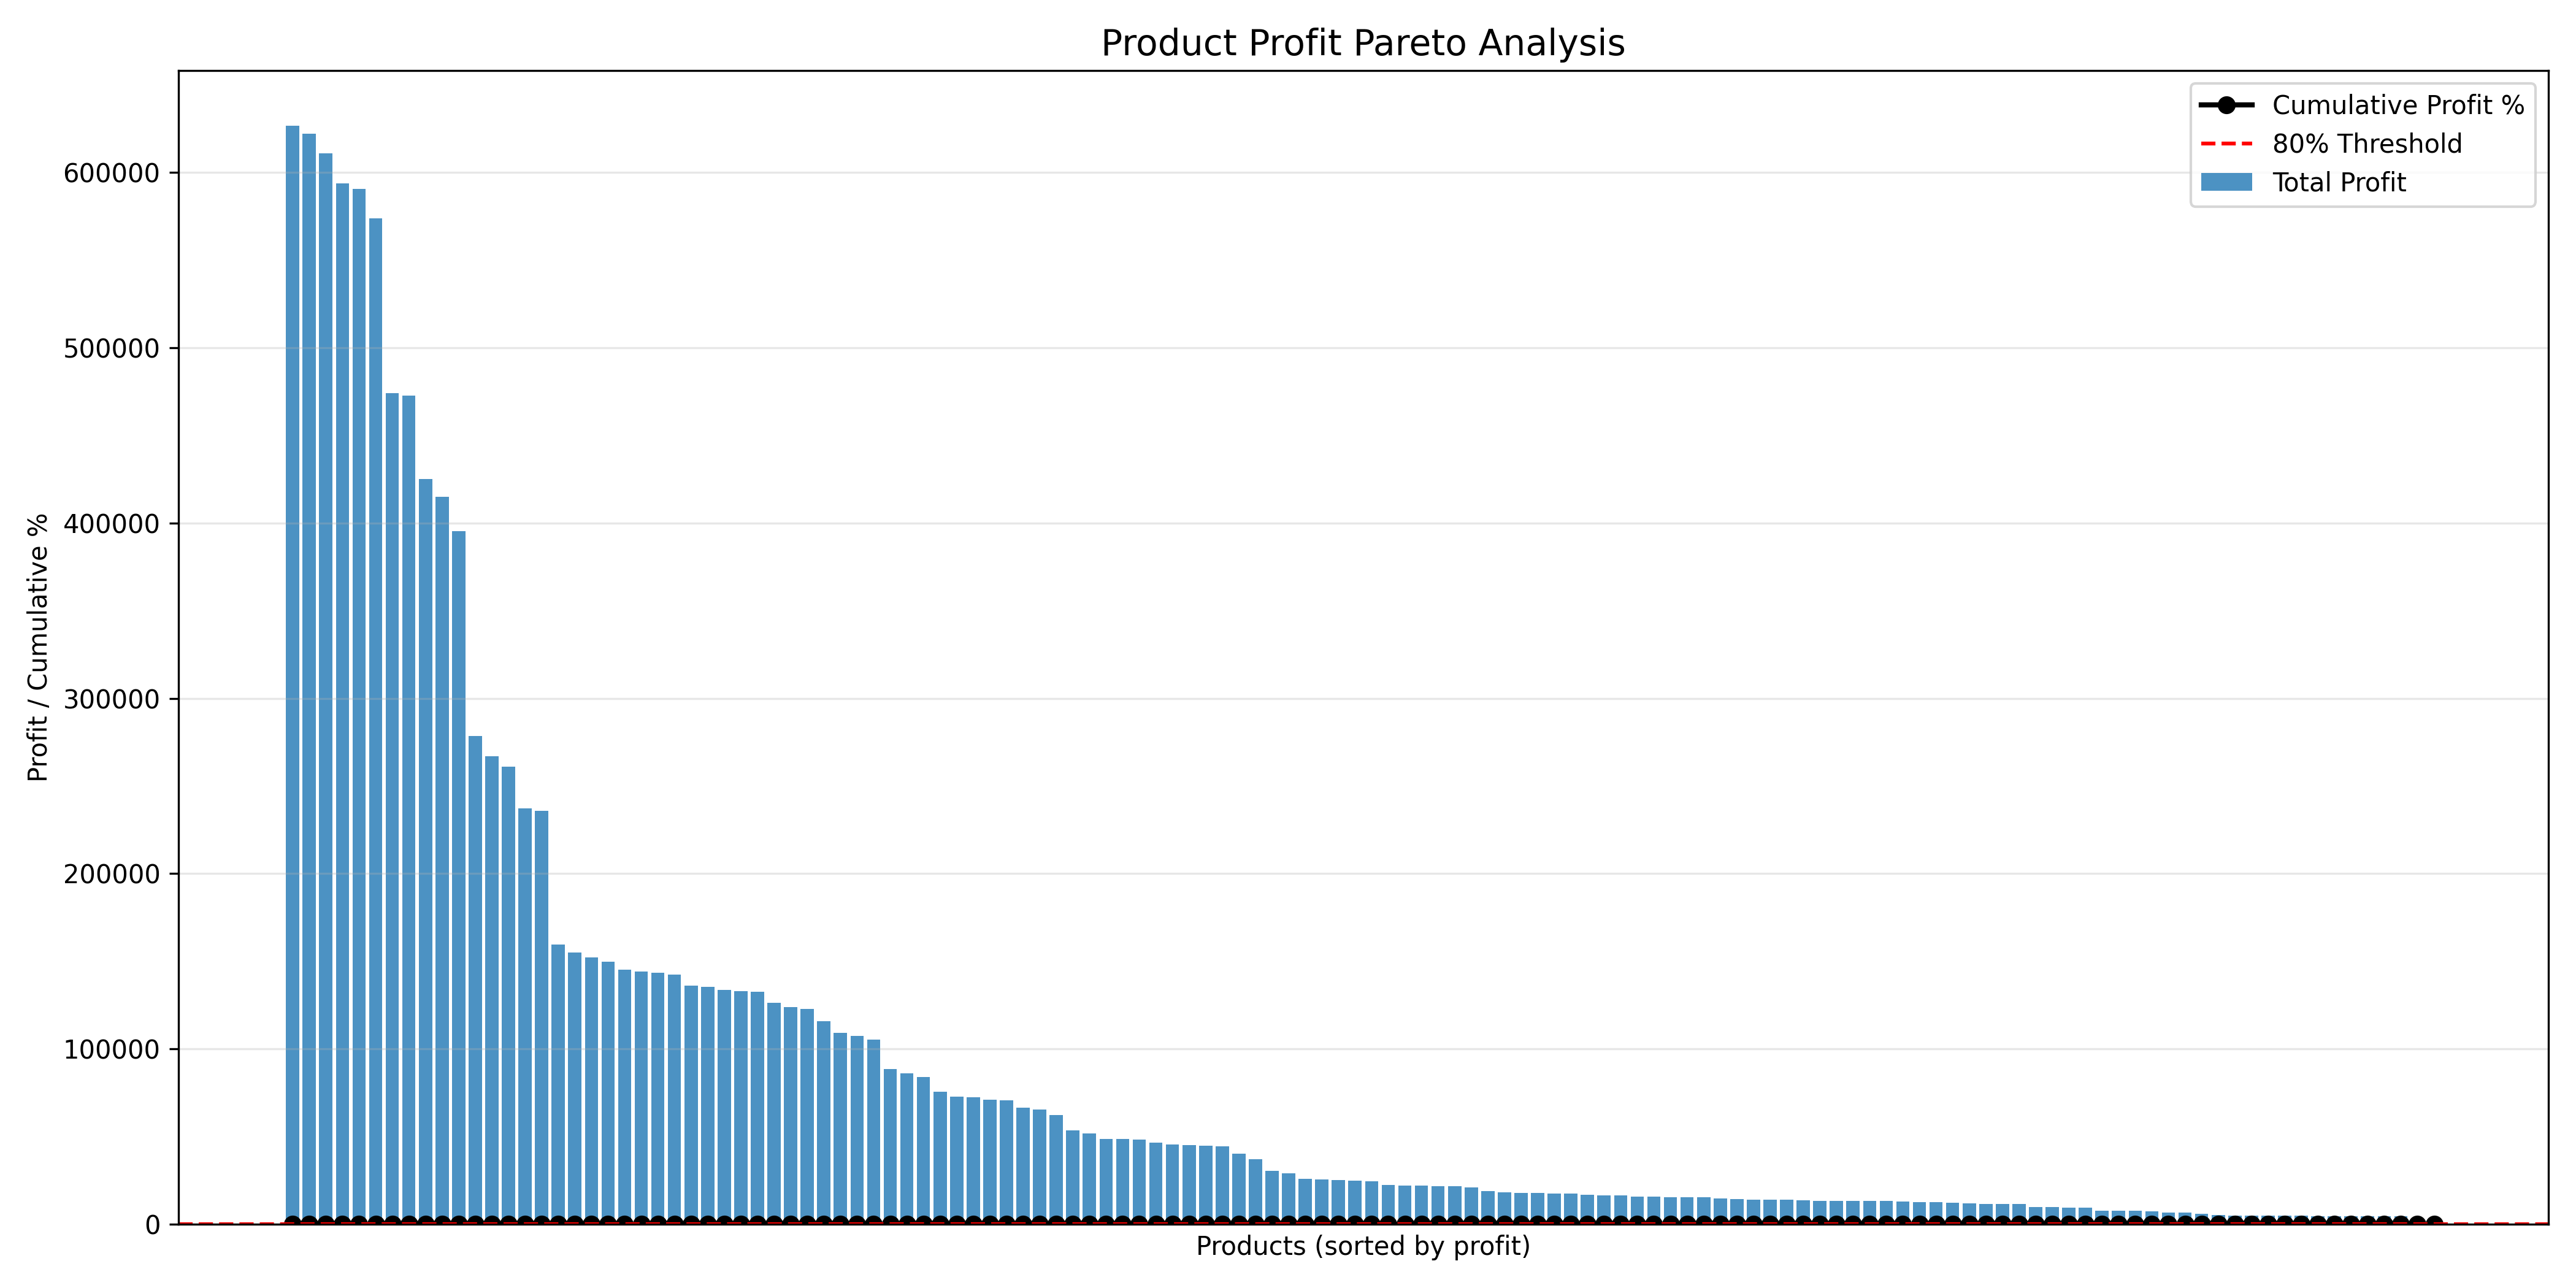
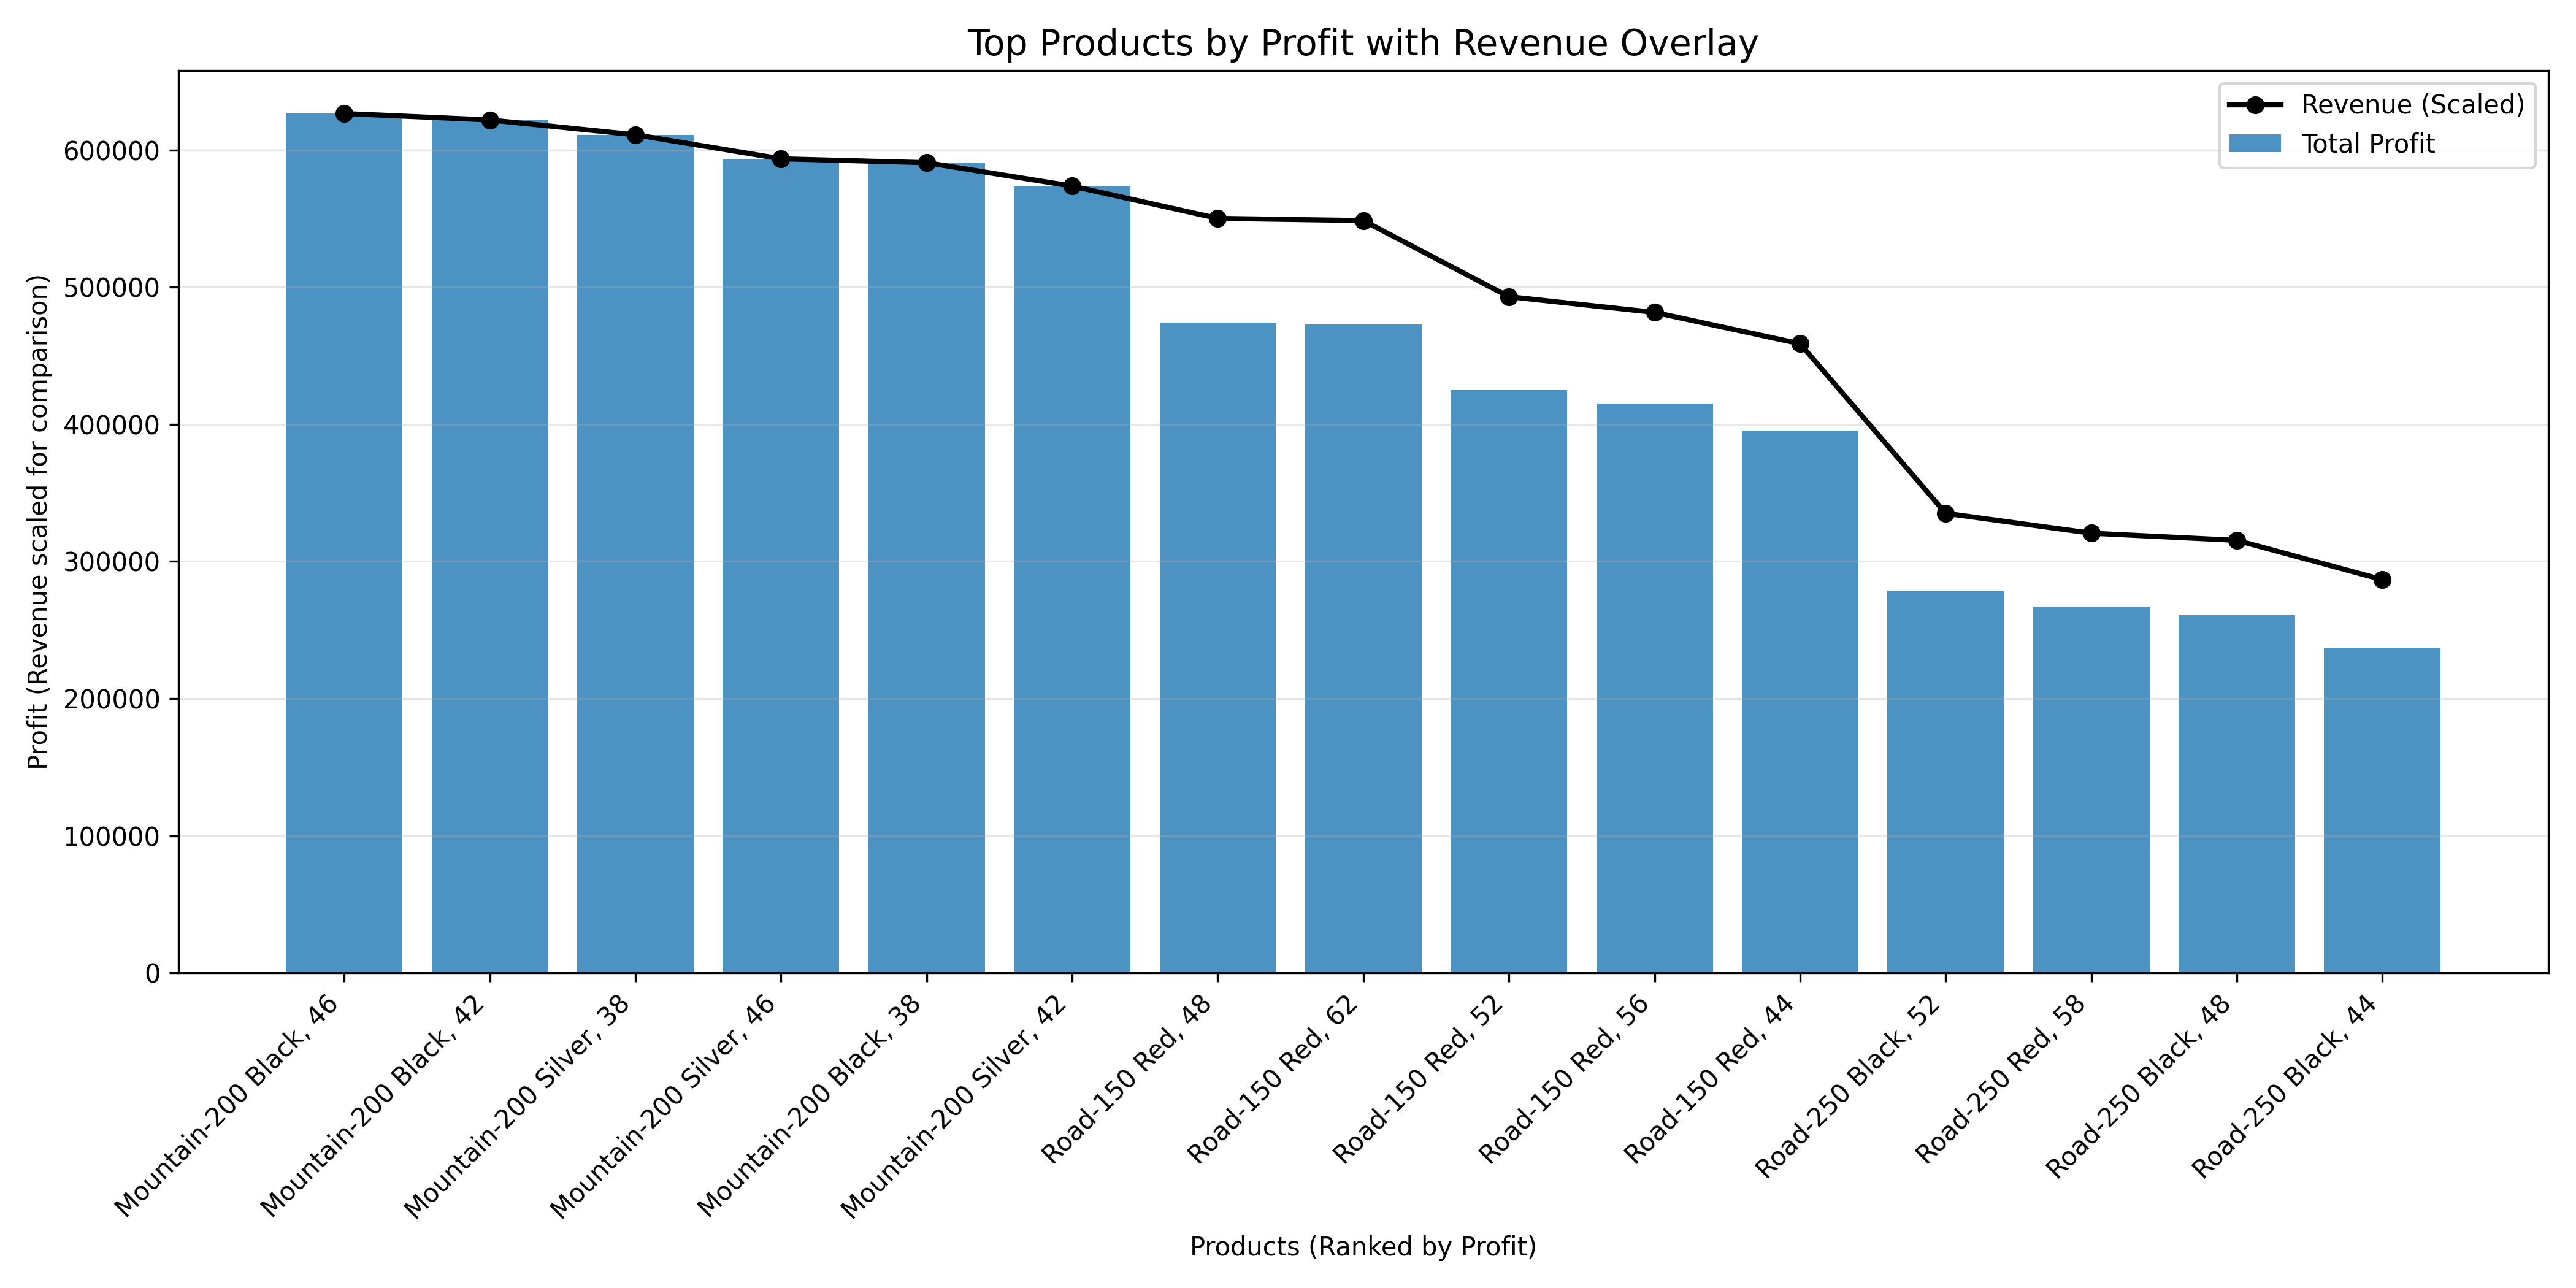
Yes, very clearly. The analysis confirms a strong Pareto pattern in the product portfolio. A small group of products contributes a disproportionate share of total profit, while most products contribute only marginally.
Profit drops sharply after the top products, with cumulative profit reaching 80% well before the midpoint of the product list. This shows that profit is highly concentrated rather than evenly distributed. Only a limited number of top-ranked products are needed to generate most of the profit, while the rest form a long tail with very small contributions.
In simple business terms, the company does not make money evenly across products. Most profit comes from a small group, and treating all products as equally important would dilute focus. Sales attention and management decisions must start with the products that actually carry the business.
2. Which specific products are our true hero products?
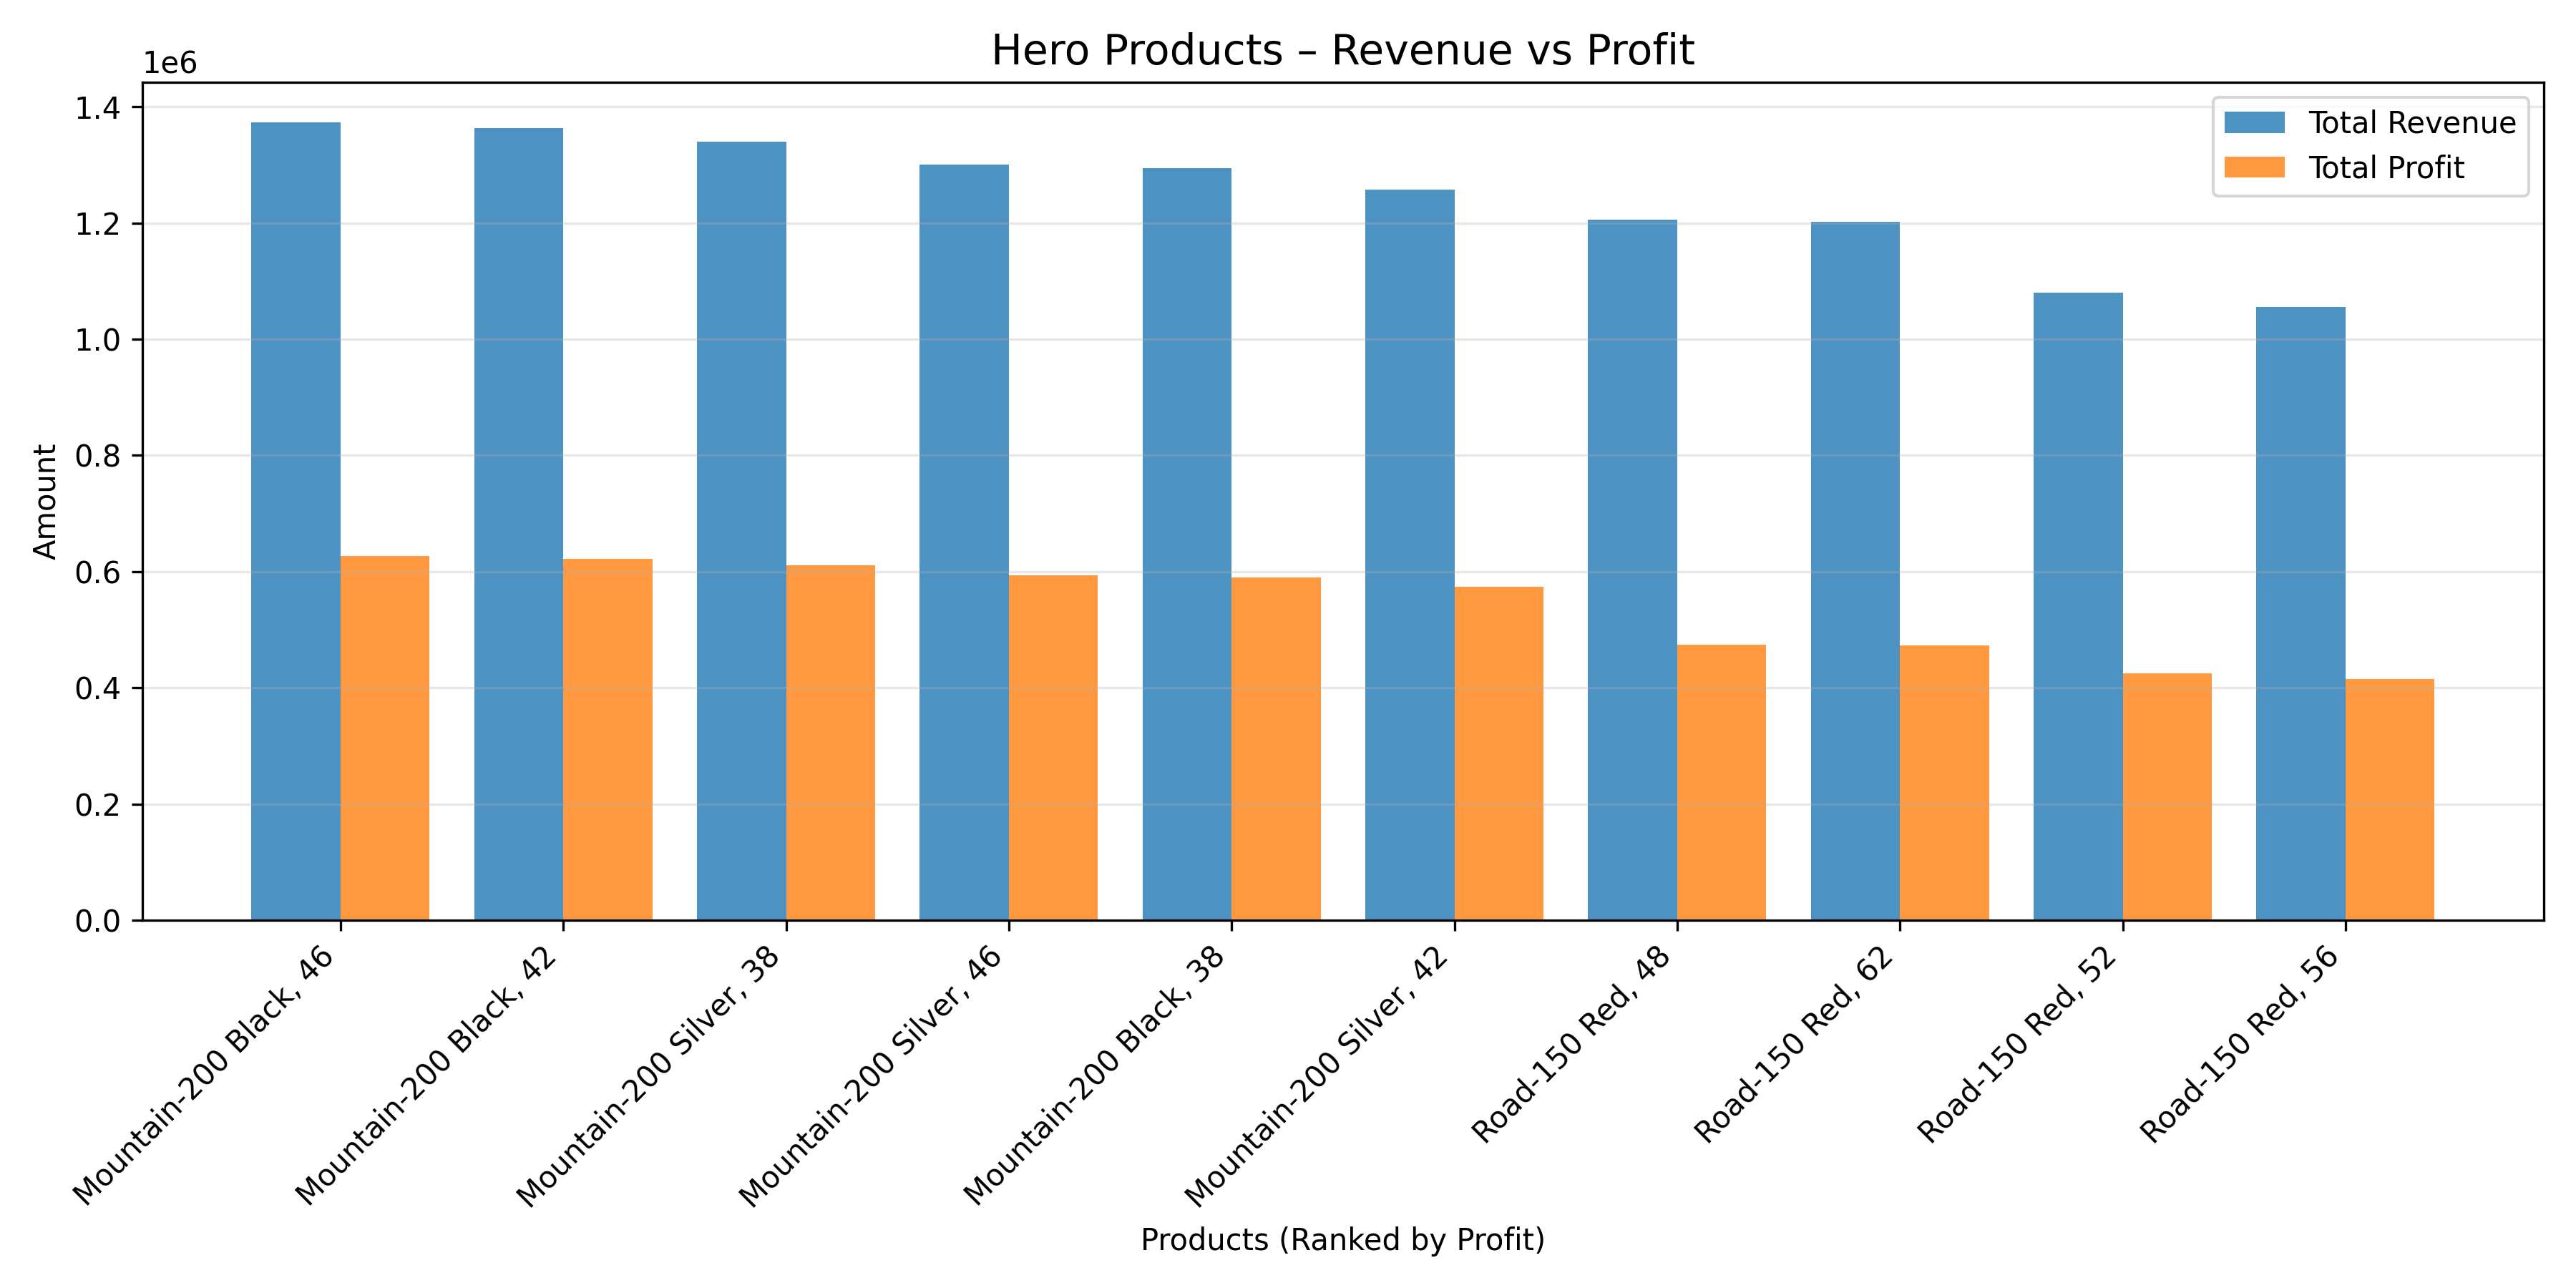
The Mountain-200 series, across both Black and Silver variants and multiple sizes, are the clear hero products. They consistently rank at the top for both revenue and profit, which is the defining trait of a true hero product.
These products generate very high revenue (around 1.3-1.4 million per product) and very high profit (around 0.58-0.63 million), with revenue and profit moving together. They appear repeatedly across sizes, showing consistency and depth rather than one-off success.
In business terms, these products carry the company's results. They deserve priority sales attention, strong availability, and clear positioning in sales conversations. Any sales strategy that does not start with these products is leaving money on the table.
3. Which products appear busy but contribute little profit?
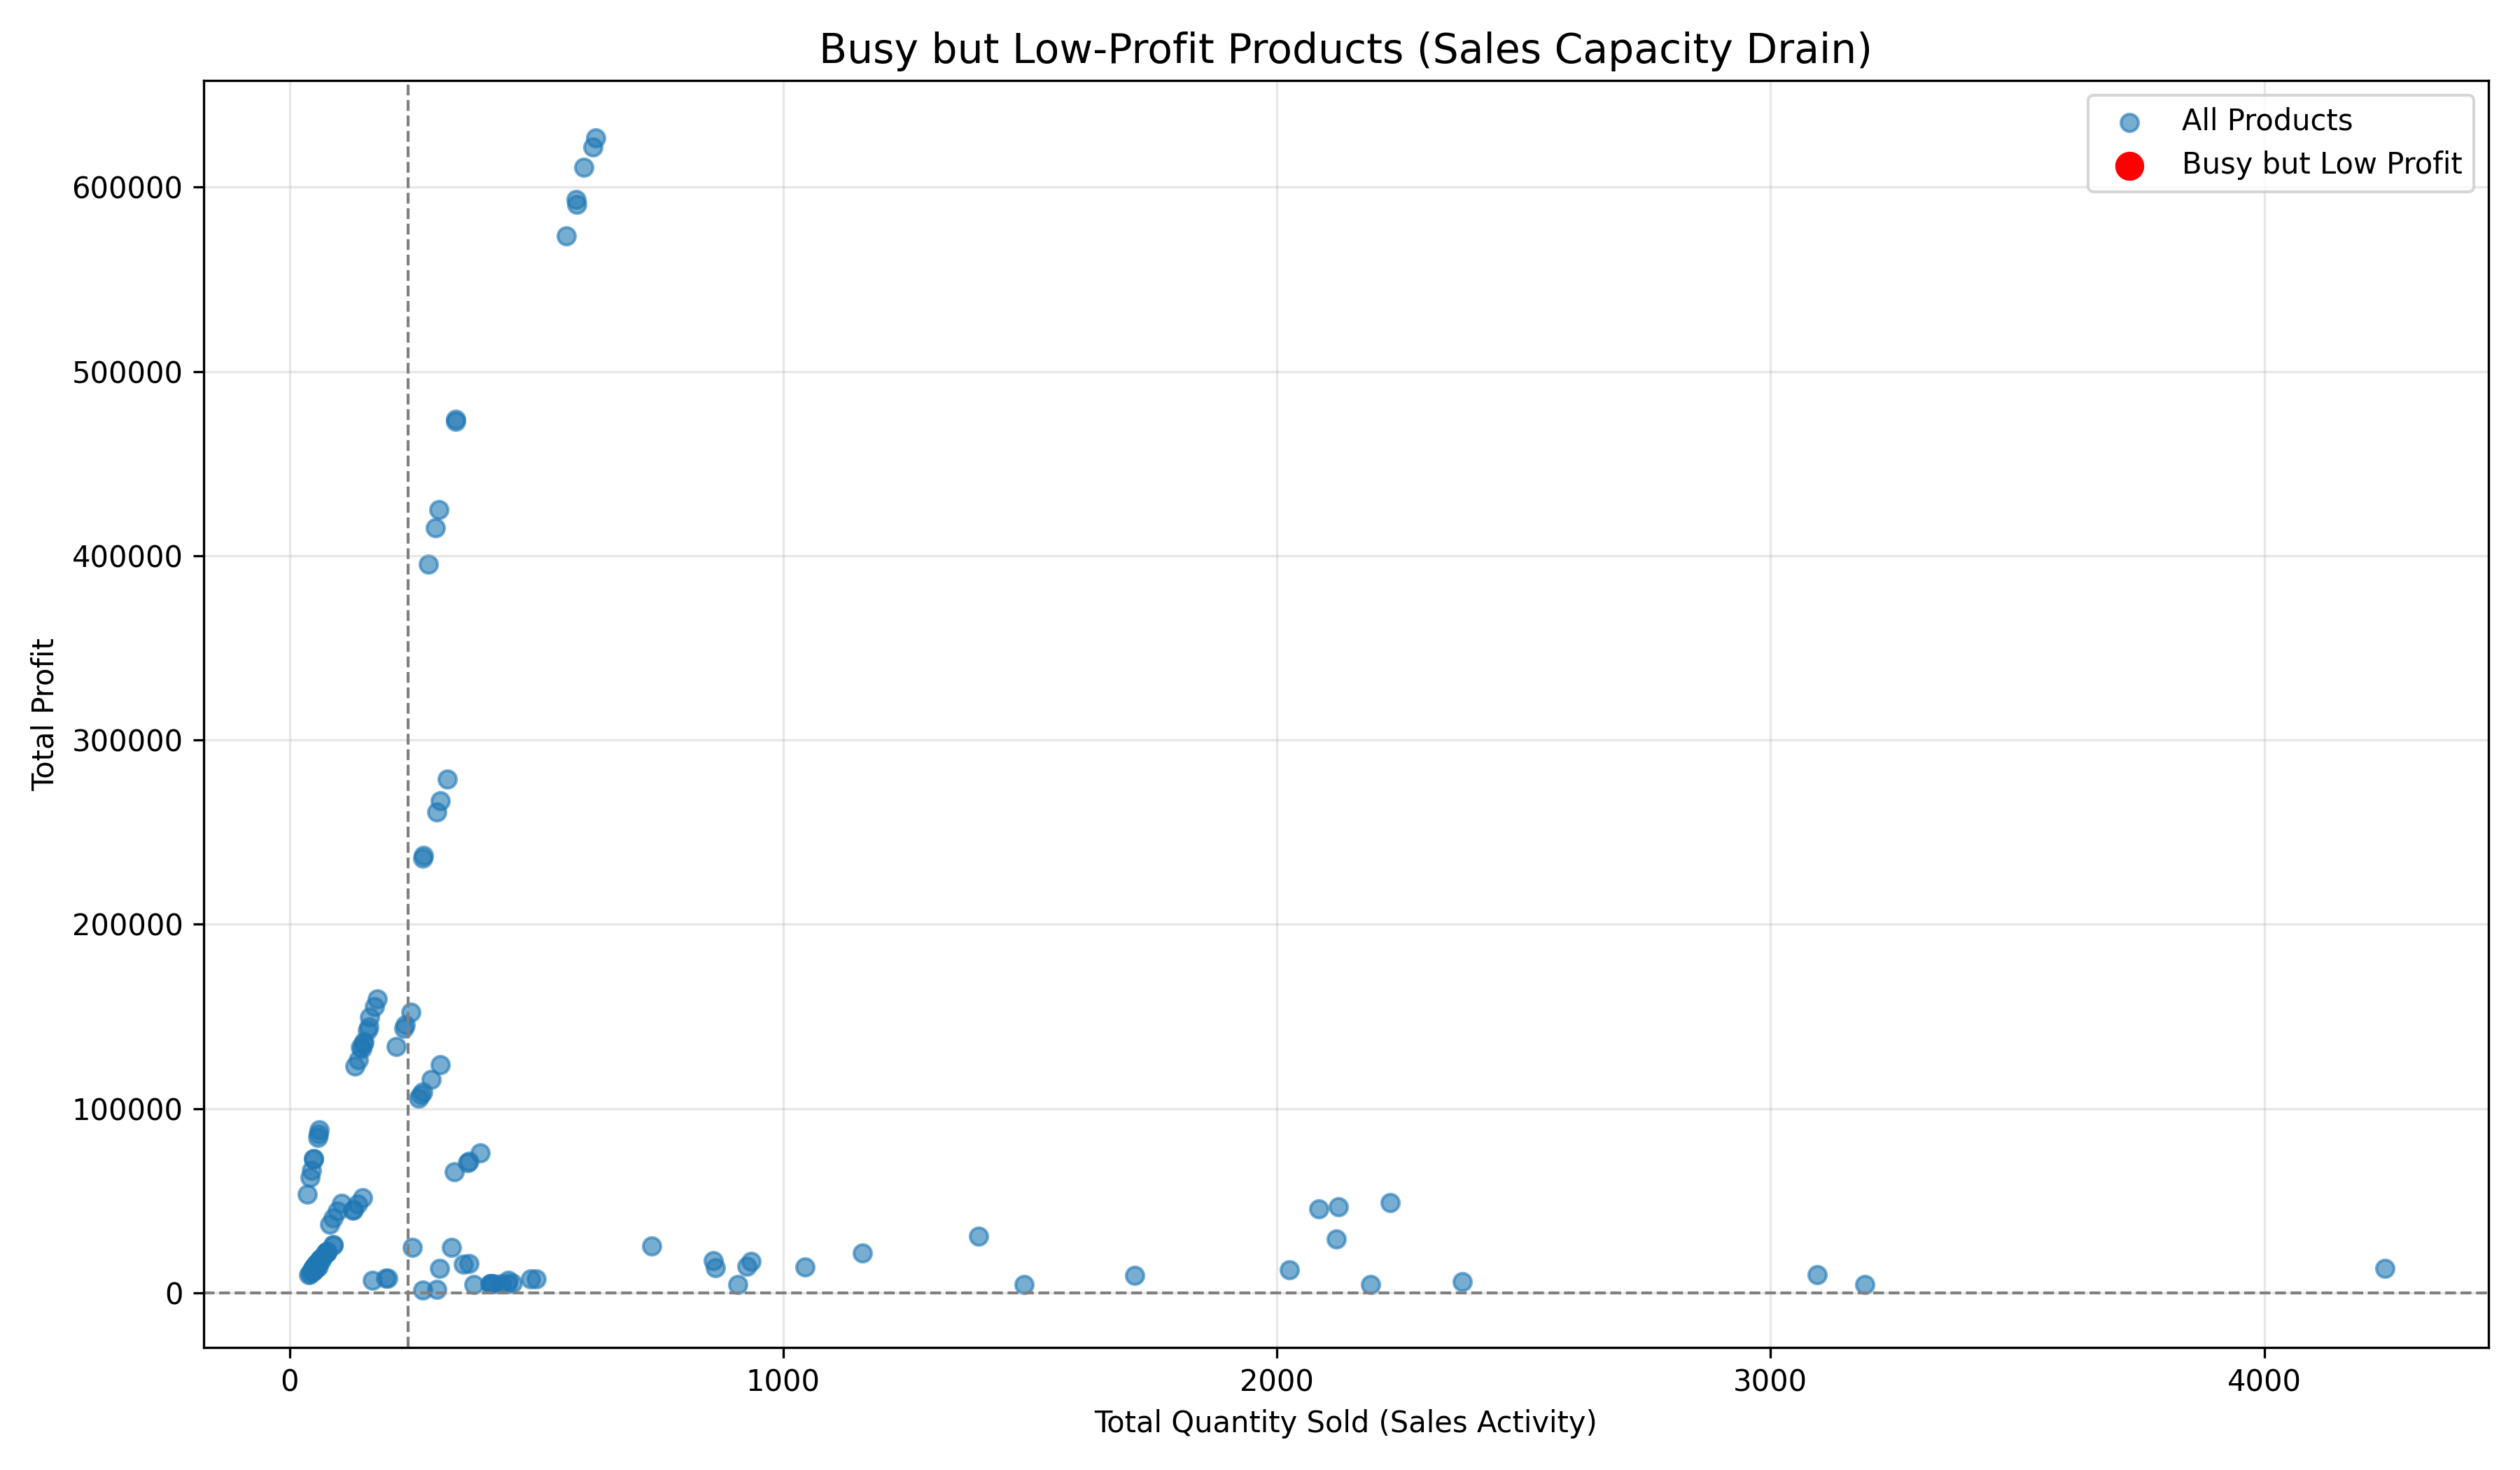
Several accessories and consumables sell in very high volume but contribute little profit relative to the effort required to sell them. These products create hidden inefficiency by keeping the sales team busy without meaningfully improving results.
Products such as AWC Logo Cap, Bike Wash Dissolver, Patch Kit / 8 Patches, Mountain Tire Tube, Road Tire Tube, and Racing Socks sell frequently, often in the thousands of units, but sit near the bottom in total profit. They consistently appear in the high-quantity, low-profit zone.
In practical terms, these items consume sales conversations, order processing time, and inventory attention while delivering weak financial return. They should not be actively pushed and are better treated as add-ons or reactive sales, with focus redirected toward higher-impact products.
4. Is our current sales effort aligned with our actual profit drivers?
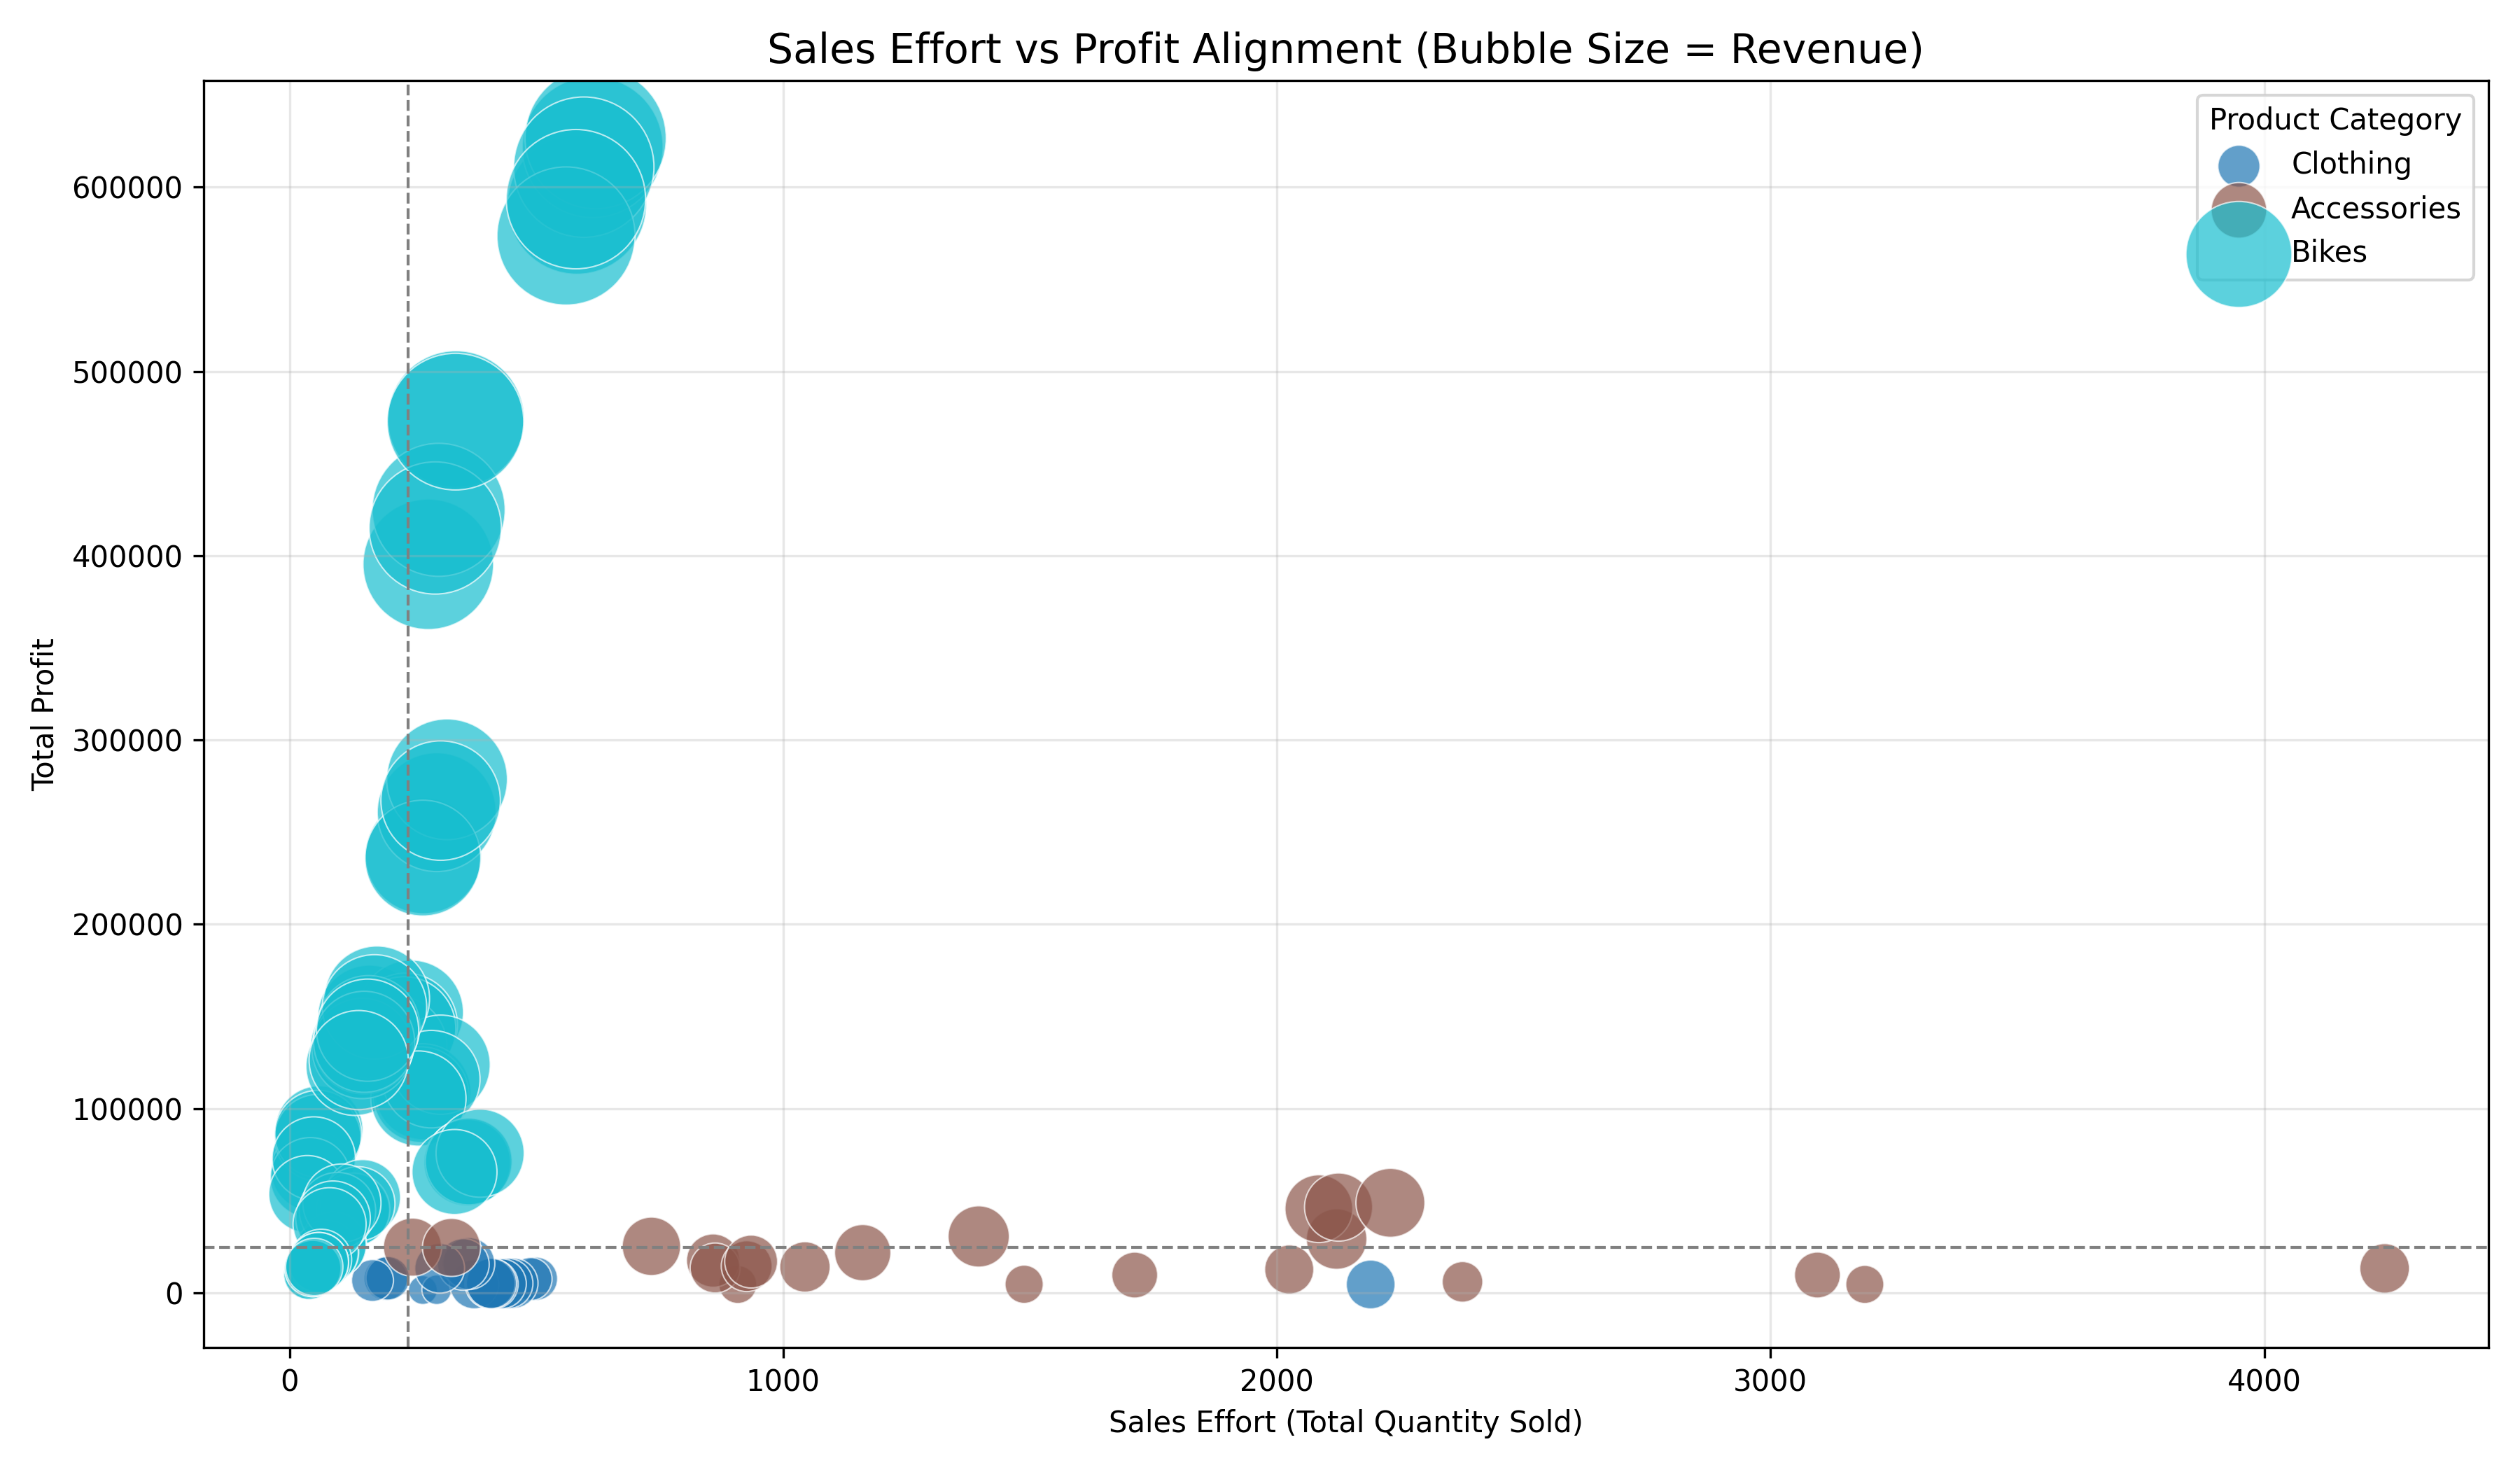
Only partially. Some sales effort is well aligned with profit drivers, but a significant portion is still tied up in low-impact products, creating a mismatch between effort and outcome.
High-profit bike products generate strong profit even at moderate sales effort, showing efficient return on attention. In contrast, many accessories and clothing items require high sales activity but deliver very little profit, resulting in high effort with low reward.
From a sales management perspective, this means the team is working hard, but not all effort is paying off. Improving alignment requires protecting focus on hero products while reducing proactive selling of low-profit items.
5. How different is the product ranking when we compare revenue vs profit?
There is a meaningful difference, and it reveals a clear sales illusion. Some products look successful because they generate high revenue and sales volume, but they rank much lower when profit is used as the measure of value.
Mountain-200 Black and Silver models sell well and also generate top-tier profit, making them genuine performers. In contrast, Road-150 Red and Road-250 Black variants sell in higher quantities and generate solid revenue, but their profit contribution drops noticeably compared to the hero products.
This shows that quantity alone is not a reliable signal of value. Revenue can make products look important, but profit reveals which sales actually matter to the business.
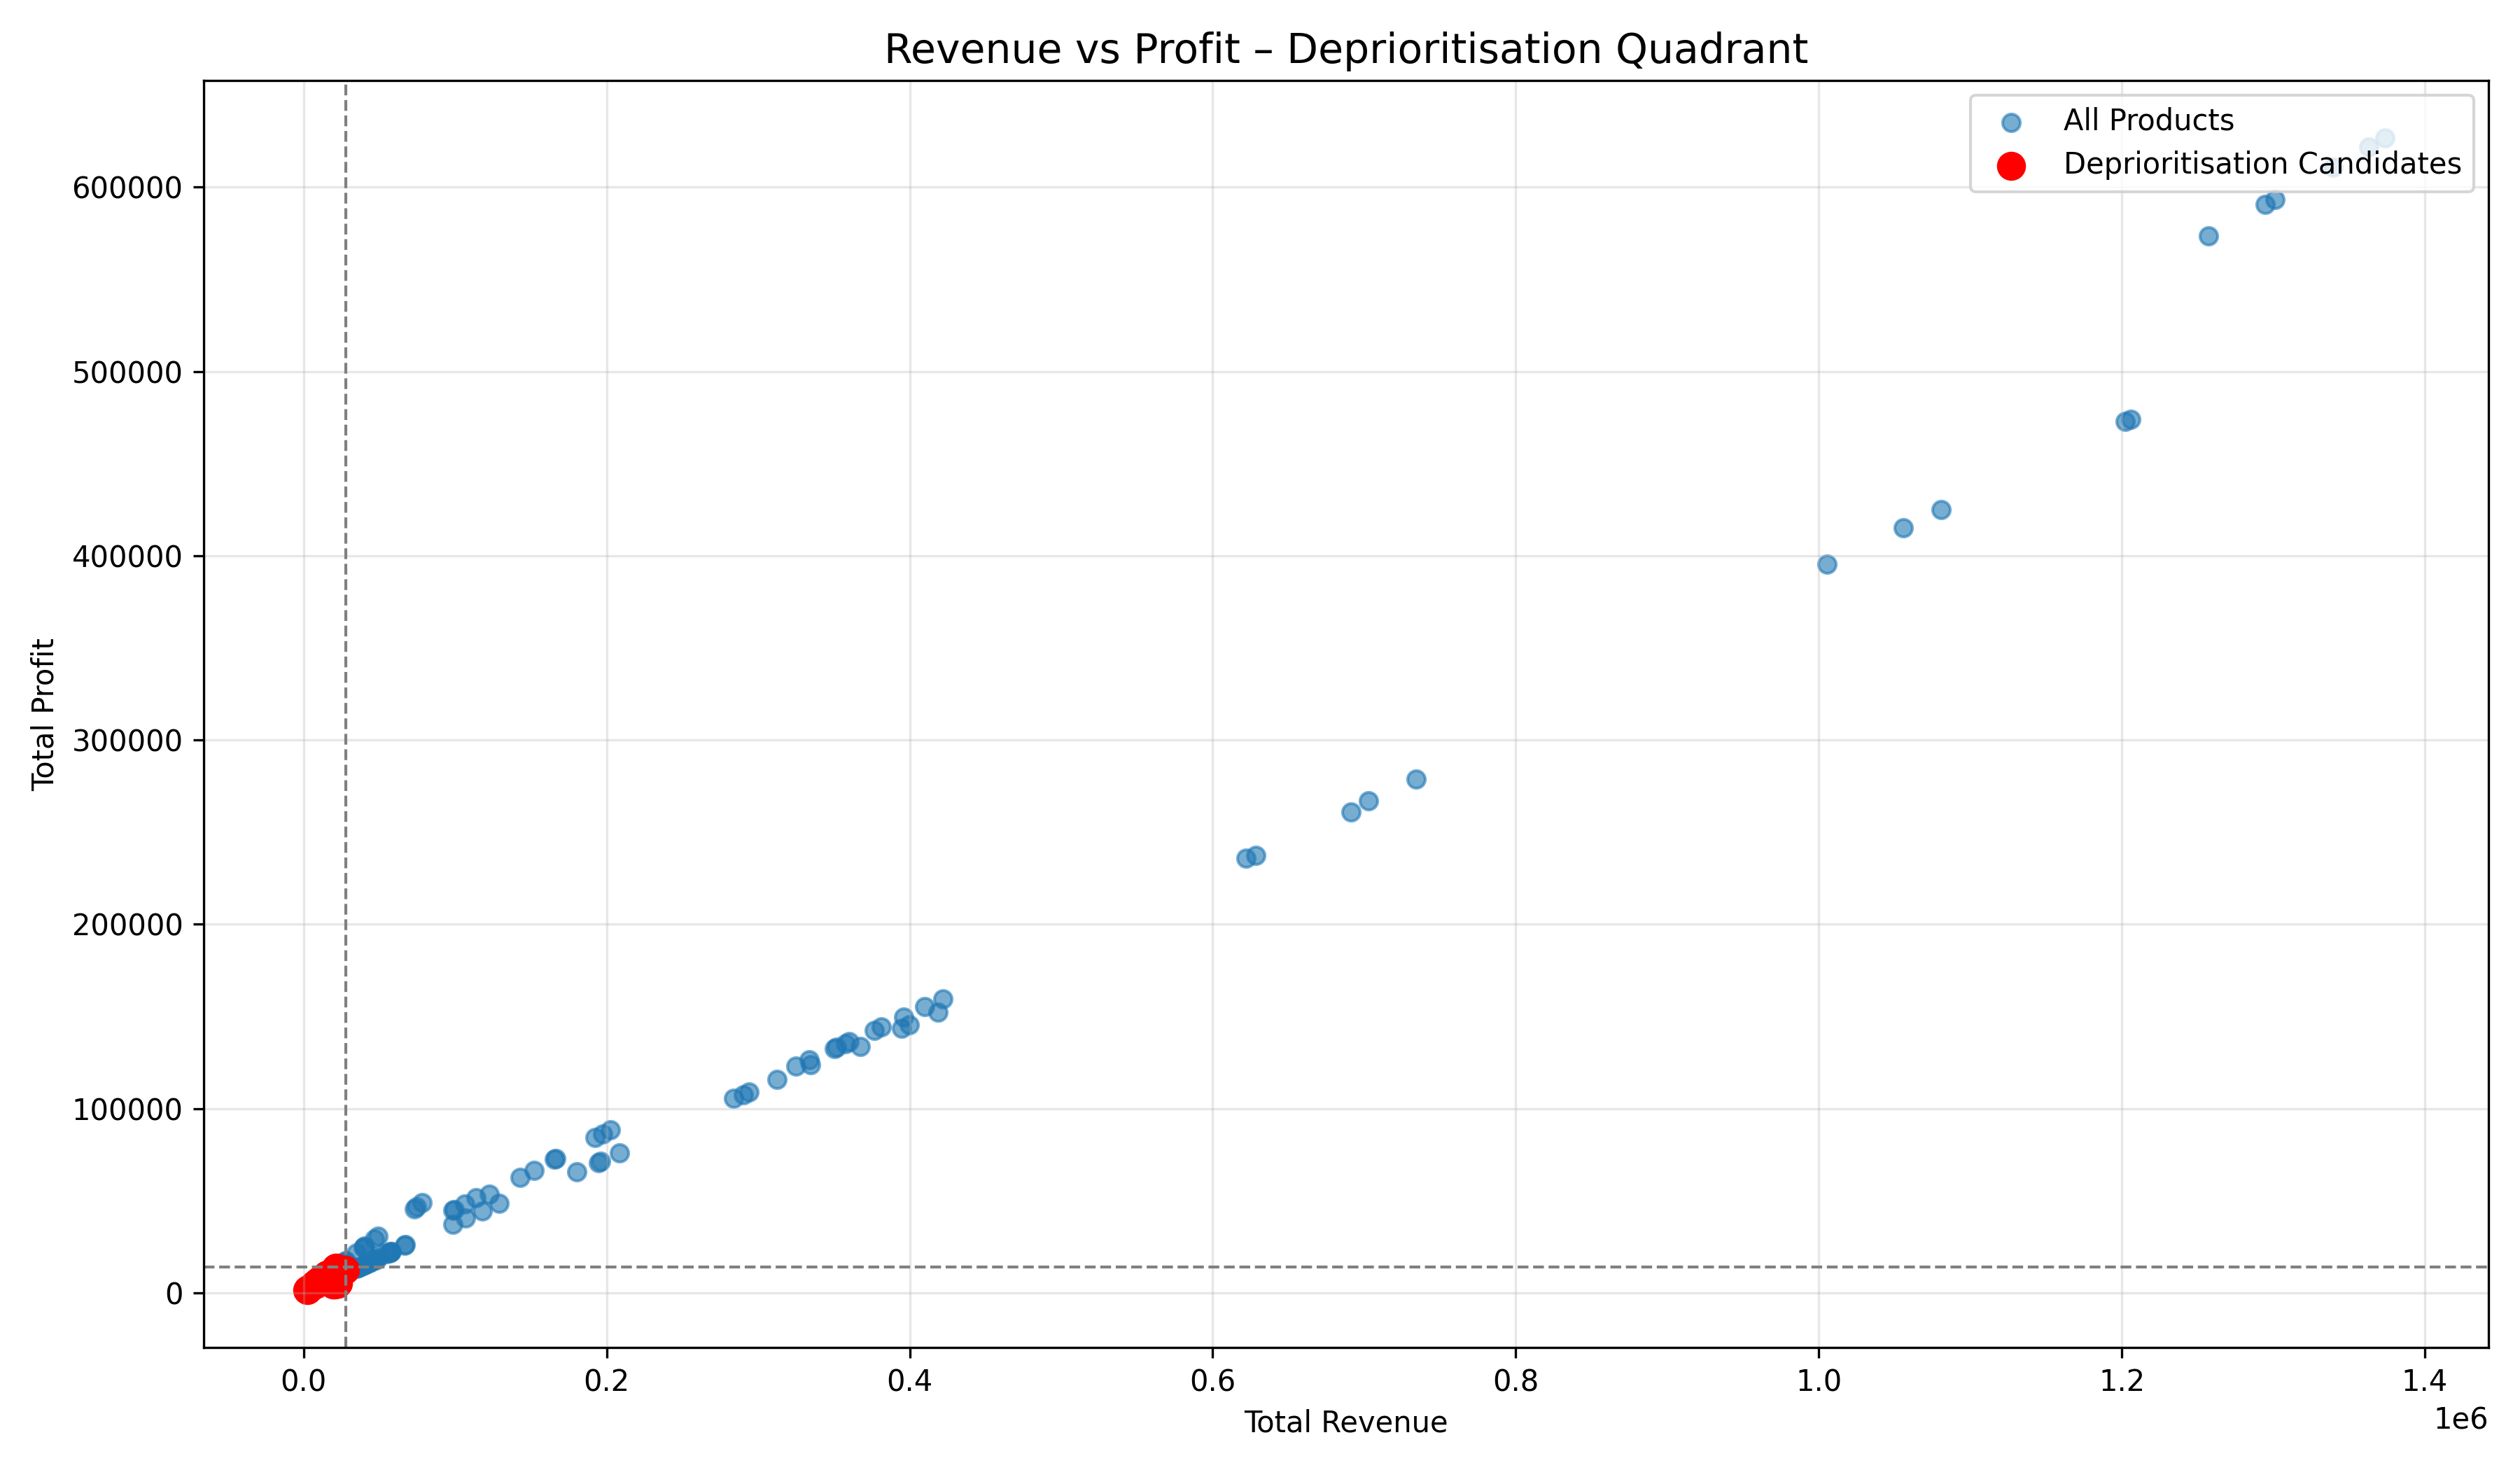
6. Which products consistently underperform across both revenue and profit?
Several products sit at the bottom on both revenue and profit and do not materially contribute to results. These are clear candidates for reduced sales focus or simplification.
Lower-tier bike variants such as Road-250 Black (sizes 44, 48, 52), along with accessories like Bike Wash Dissolver, AWC Logo Cap, Racing Socks, and some Patch Kit variants, consistently show low sales impact and low profit. They are neither strong volume drivers nor meaningful profit contributors.
In business terms, these products add complexity without payoff. They should not compete for sales attention and are better treated as reactive items or candidates for SKU rationalisation, allowing effort to be redirected toward products that truly drive performance.
Method & data
This analysis uses sales transaction data covering over 60,000 product sales. Each record represents one product sold, including its price, cost, quantity, and profit. The data was summarised at the product level to understand which products drive revenue and which products drive profit.
The analysis takes a profit-first approach, not a sales-volume view. We checked whether a small number of products generate most of the profit, then compared revenue and profit to identify hero products, busy but low-value products, and consistent underperformers. Sales effort was assessed using simple activity measures such as quantity sold and order count.
The purpose is to give sales managers clear, usable insight on what to prioritise, what to sell less of, and how to improve results by selling smarter, not harder.
Conclusion
The main opportunity is to improve product mix, not sales execution. The sales team can sell effectively, and when they focus on the right products, results are strong. Most profit comes from a small group of hero products, especially the Mountain-200 series, which generate high profit without requiring heavy sales effort.
At the same time, too much time is still spent on low-impact products that create activity but little profit. This makes performance look busy without delivering real results. By shifting focus toward hero products and treating low-profit items as reactive or add-ons, the business can improve profit by redirecting existing effort, not by asking the team to work harder.