Trading Volume Patterns and Price Changes
Analyzing trading volume patterns and their relationship with price changes during critical market periods.
Executive Summary
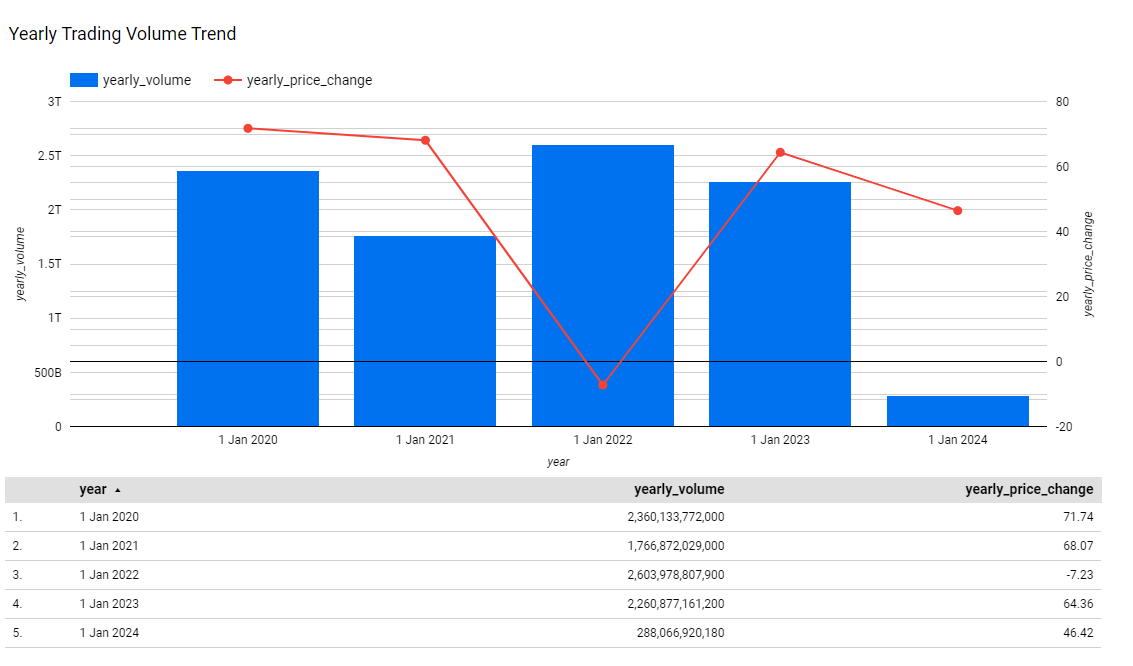
This case study examines trading volume patterns and their relationship with price changes from late February to early April over multiple years. The analysis reveals consistent trends, such as increased trading volumes in March and notable correlations between volume and price changes, providing retail investors with actionable insights to guide their investment strategies during these critical periods.
Problem Statement
Retail investors need to identify optimal periods for trading based on historical data to maximize returns. Understanding the relationship between trading volume and price changes during specific months can provide valuable insights to help investors optimize their trading strategies.
Approach
Dataset Used: The dataset includes historical trading volumes and price changes from late February to early April from 2020 to 2024.
Data Analysis Techniques:
- Trend Analysis: Examined trading volumes and price changes to identify recurring patterns.
- Comparative Analysis: Compared trading volumes and price changes across different years to highlight consistent trends and deviations.
- Correlation Analysis: Assessed the relationship between trading volume and price changes to identify significant correlations.
Results
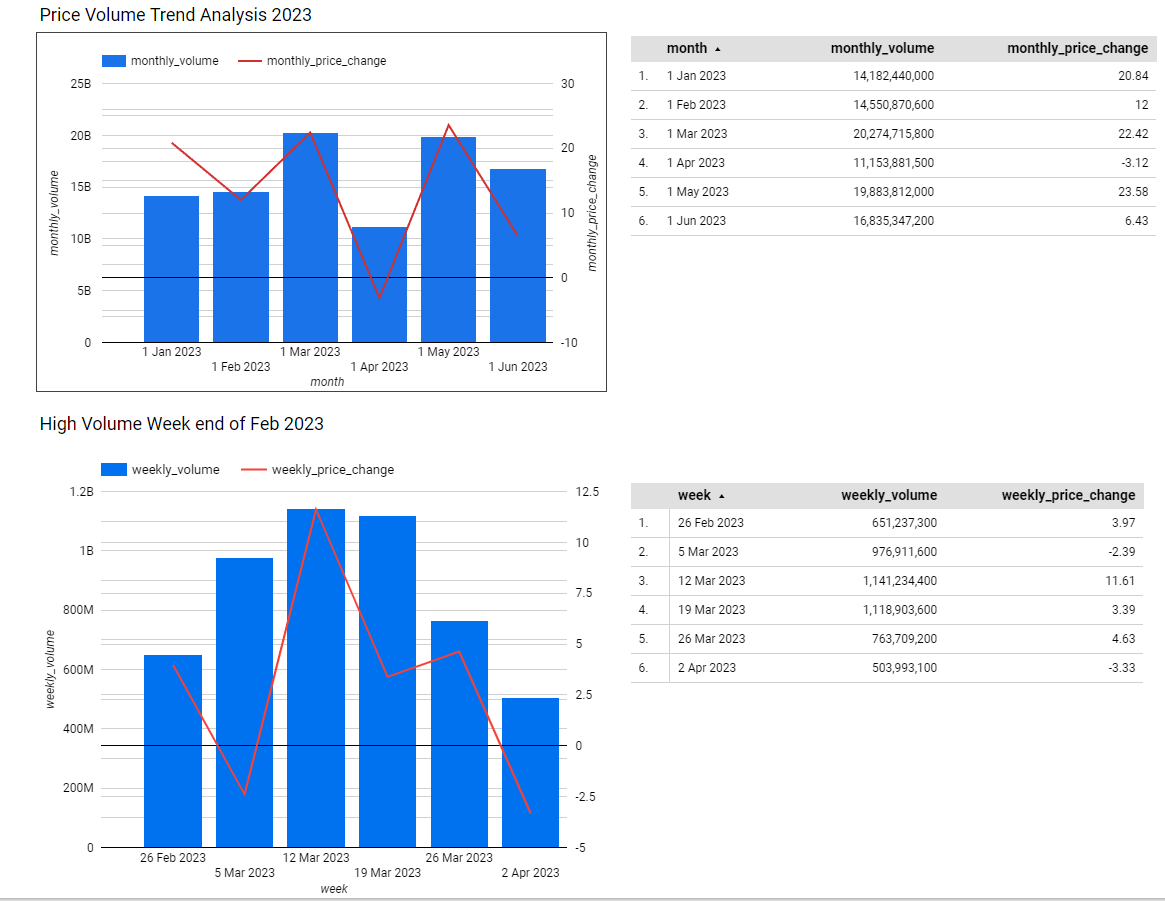
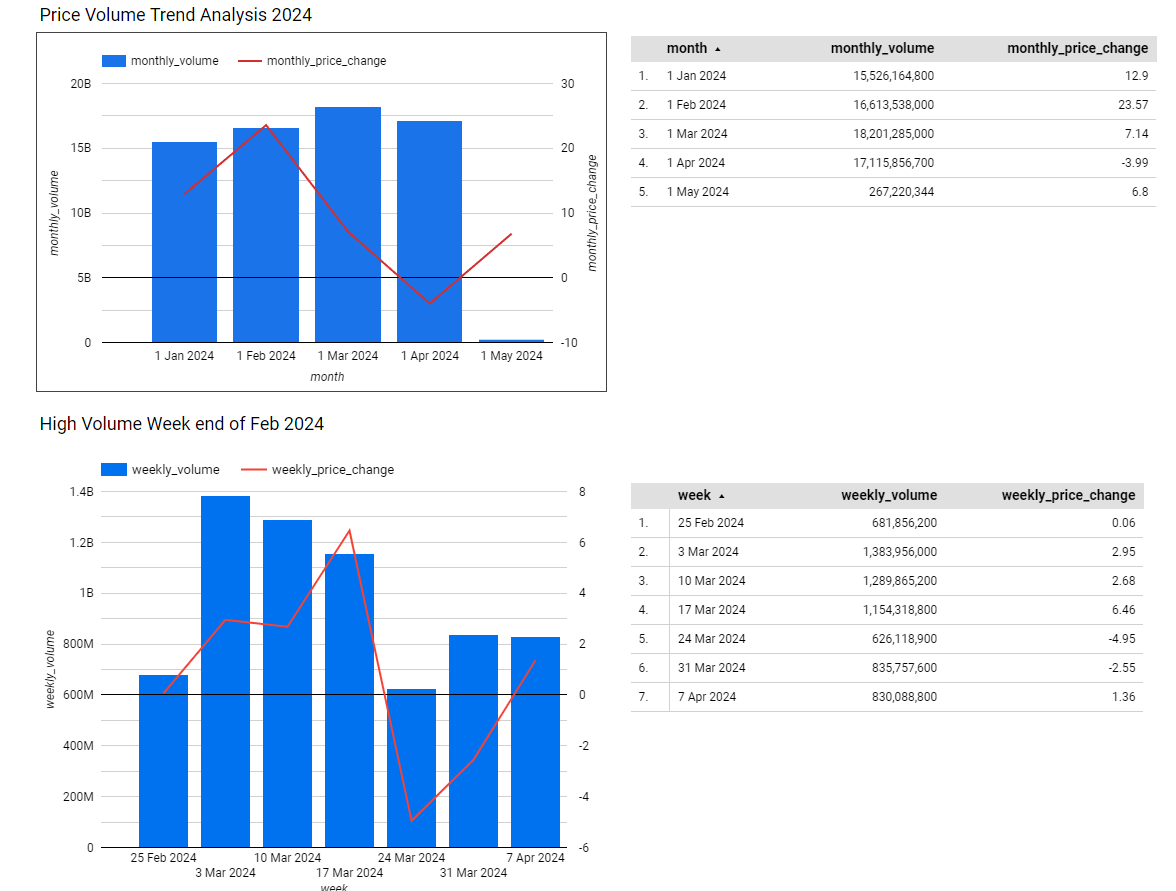
Notable Increase in Trading Volume in March Every Year
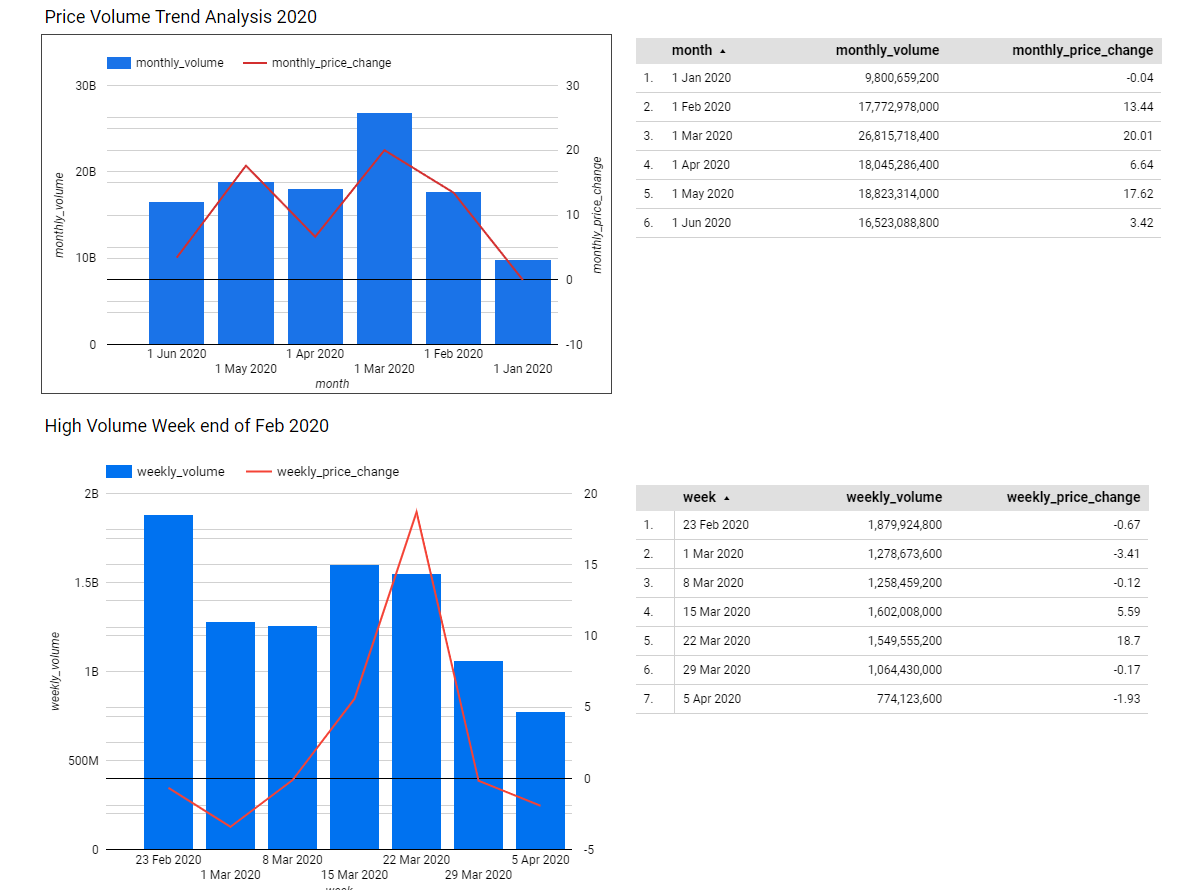
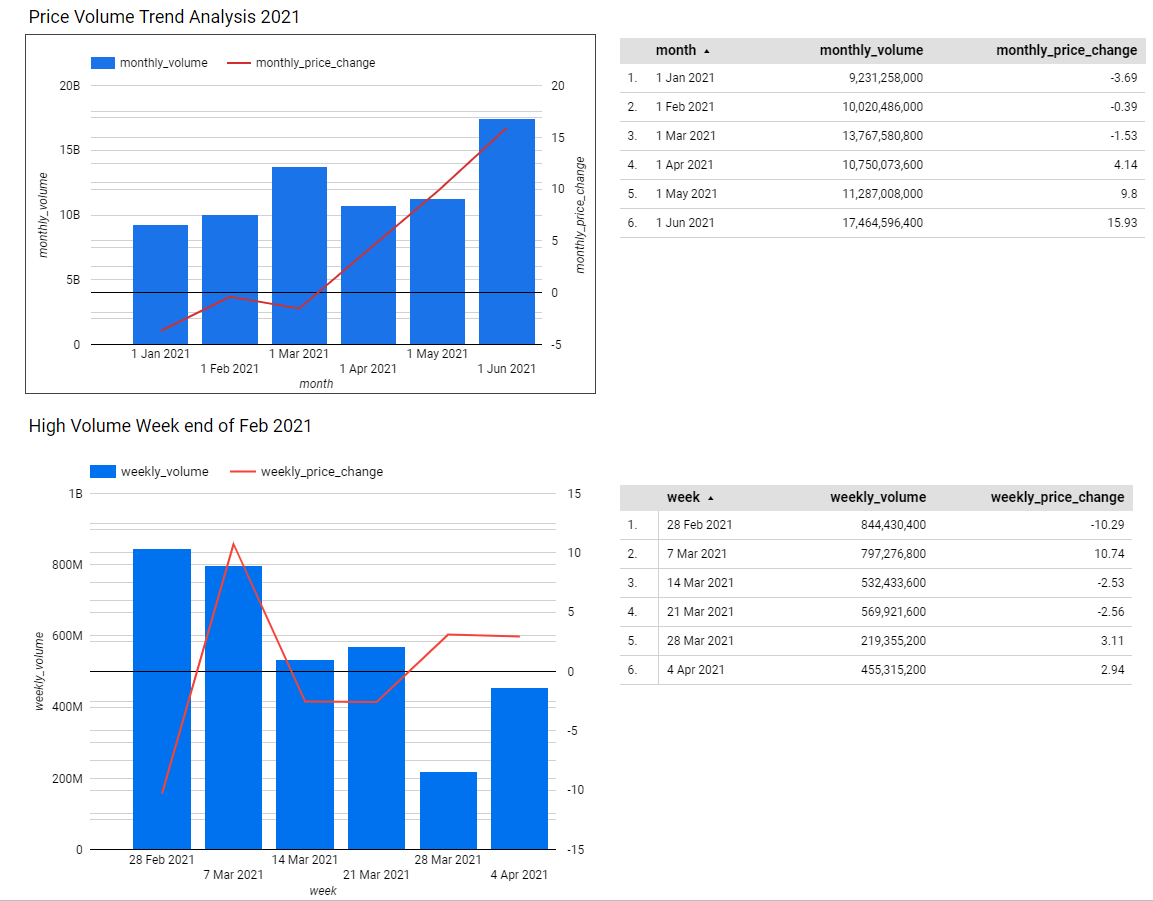
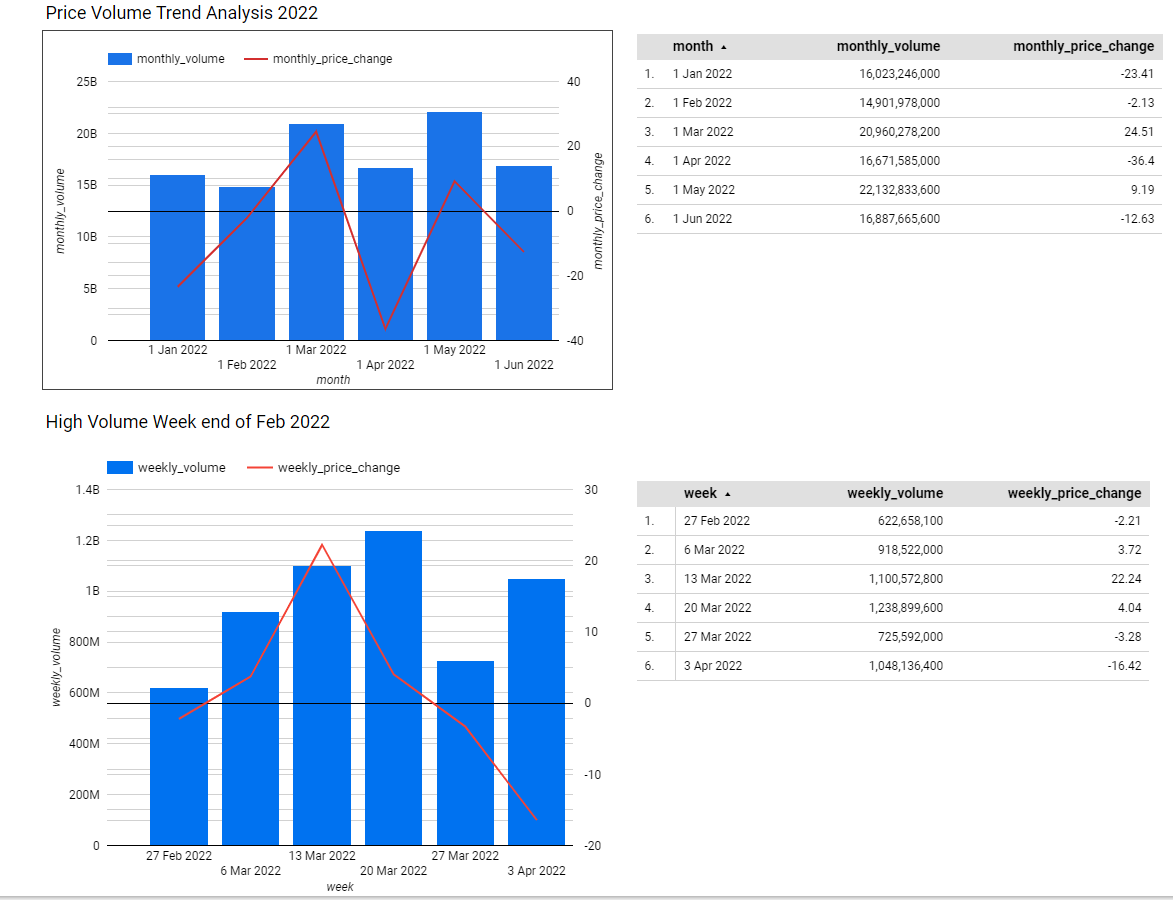
March consistently shows an increase in trading volume, suggesting it is a critical month for market activity. This increase often correlates with price increases, particularly in the third and fourth weeks.
U-Shape Trading Curve in 2020 and 2021
Both 2020 and 2021 exhibit a U-shape trading volume pattern, with high volume in the final week of February, a dip, and a resurgence in March. This pattern often aligns with price increases in the third and fourth weeks.
High Trading Volume in Specific Weeks
- February 2022: The third week of February 2022 recorded the highest trading volume and a price decrease of 5.94%, indicating that high volume does not always correlate with price increases.
- February 2023: The second week of February 2023 saw peak trading volume with a price increase of 12.01%, followed by continued high volumes and price increases in the third week.
- March 2024: The first week of March 2024 had the highest trading volume and a price increase of 2.69%, followed by a steady decline in both volume and price.
Correlation Between Trading Volume and Price Changes
- Price increased with higher volume: 15 times (weekly basis)
- Price decreased with lower volume: 10 times (weekly basis)
- Price increased with higher volume: 3 times (monthly basis)
- Price decreased with lower volume: 2 times (monthly basis)
Insight: While higher trading volumes often correlate with price increases, there are exceptions, particularly during periods of market volatility or external economic events.
Steady Decline in Trading Volume After Early March 2024
The decline in trading volume after the first week of March 2024 may indicate market stabilization or reduced investor engagement. This period often shows price decreases despite earlier volume spikes.
Recommendations
- Focus on March for Trading Activities: Given the consistent increase in trading volumes and their general correlation with price increases during March, retail investors should consider adjusting their strategies to capitalize on the heightened market activity during this month.
- Monitor Late February to Mid-March Trends: The recurring peaks in trading volume and corresponding price changes during this period suggest that investors should be prepared for increased market volatility. Utilizing volume-based indicators could help in timing trades more effectively.
- Be Cautious of Declining Volumes Post-March: The decline in trading volumes and the frequent price decreases after early March suggest a period of market calm. Investors might consider adopting more conservative strategies during this time, focusing on longer-term positions or reducing exposure until trading volumes increase again.
Conclusion
The analysis of trading volumes and price changes from late February to early April reveals valuable patterns for retail investors. Higher trading volumes generally correspond to price increases, particularly in March, making it a critical period for trading activities. However, the data also show that high trading volumes do not always guarantee price gains, indicating the influence of other market factors. By recognizing these patterns, investors can better navigate market fluctuations, optimize their entry and exit points, and make more informed and potentially profitable trading decisions.