A florist rider races the clock through the city with a fresh bouquet.Illustration · Data Stories Lab
Fulfillment operations
When Blooms Arrive Late
How late deliveries drain a florist's margin
Data Stories LabAnalyst report2,409 orders · Jan–Jun 2026
This case study reads six months of deliveries for Bloom House Concierge, a Petaling Jaya online florist, to answer one question for the fulfillment manager: are orders arriving on time, and when they do not, what does it cost? It covers 2,409 orders across Klang Valley and outstation states, sold for birthdays, anniversaries, condolences, and grand openings, and delivered by in-house riders and third-party couriers.
The shop looks healthy on the surface, delivering on time 88% of the time. The money tells a different story. Refunds cost RM 30,513 over six months, and most of that sits on orders that ran late, hidden behind refund tags that blame damage and wrong bouquets. This report finds where delivery breaks, how lateness turns into refunds, and which few conditions drain most of the money.
The numbers
88%
delivered on time
RM 30.5k
refunded in six months
70%
of refund money on late orders
47%
on-time on the busiest days
“Delay drives 70% of refund cost, but the shop's own records blame it for barely 20%.”
The delivery standard
Every order is judged against one promise. An order is on time (positive) if it meets its standard, and late (negative) if it goes beyond. Klang Valley orders should arrive within one day, outstation orders within two days, and same-day orders within one hour of the requested time. Every finding below measures performance against this yardstick.
Part 1. How often, where, and who
1. How often do we deliver on time?
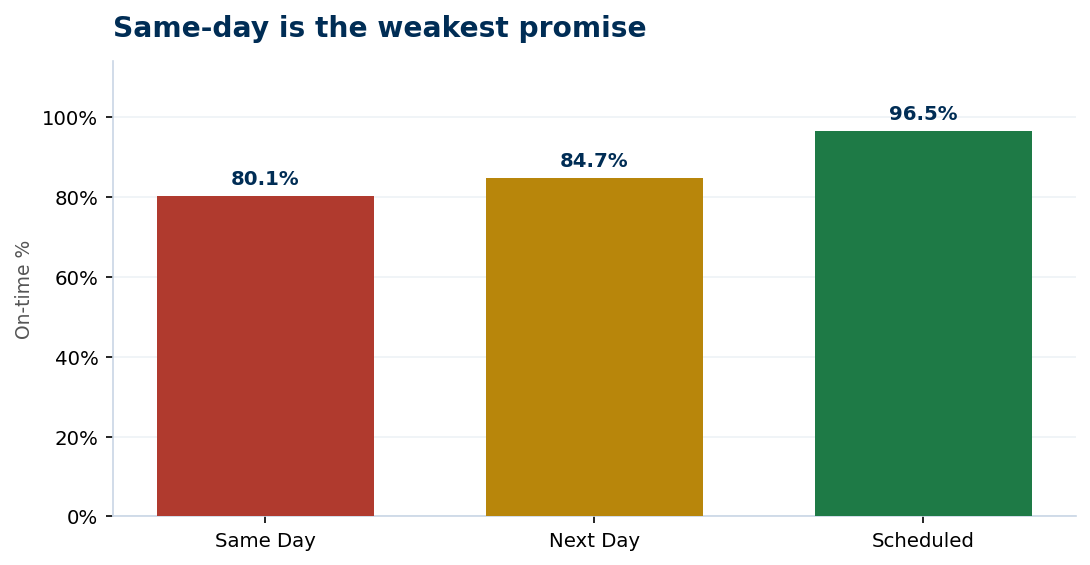
Bloom House meets its delivery standard on 88% of orders. The weak spot is same-day: only 80% of same-day orders arrive within an hour of the requested time, against 96.5% for scheduled orders that customers book ahead. Same-day is the tightest promise and the one that slips most.
The headline number is comfortable, but the same-day tier carries hidden risk. Watch same-day reliability as a distinct metric, not buried inside the overall rate.
2. Which area is late most often?
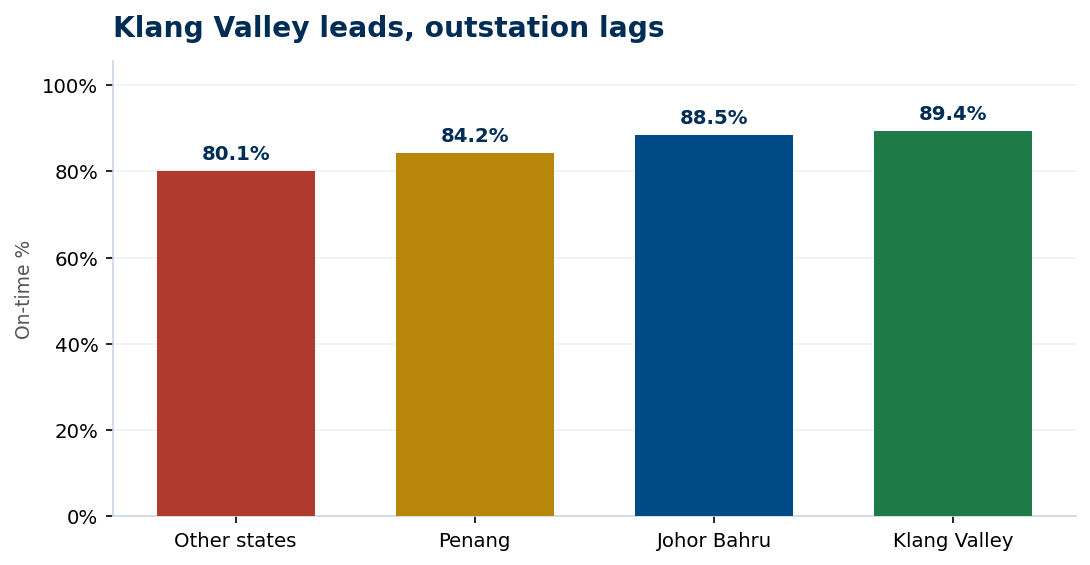
Klang Valley is the strongest at 89.4% on time. The outstation states are worse: other states sit at 80.1% and Penang at 84.2%. Distance and courier handoffs, not the shop, drive the gap.
The two-day outstation standard is the right promise to make; the shop simply cannot hold outstation to the same reliability as its in-city riders. Set customer expectations by zone rather than promising one blanket speed.
3. Which courier is most reliable?
The in-house rider leads at 89.9% on time, with Lalamove close behind at 89.8%. Ninja Van is the weakest at 82.1%. For same-day specifically, the in-house rider again wins, landing 81% of same-day orders within the hour.
Keep same-day volume on the in-house rider and Lalamove where possible. The outstation couriers are the reliability drag and the place to renegotiate or replace.
4. Which product type gets delayed most?
Delay barely moves by product. On-time rates run 87% to 91% across every category, and once Klang Valley is held constant the differences shrink further. A bouquet and a hamper to the same address travel at the same speed.
Do not chase product-level delivery fixes. Delay is a zone and workload problem, not a product problem. The product only matters later, for how badly a late delivery is punished.
5. Do fresh flowers arrive on time, and still fresh?
Fresh-flower orders arrive on time at the same rate as everything else, 88%. Freshness is a separate risk: 2% of fresh orders come back as wilted-flower refunds, a failure that only fresh stock can suffer. On time is necessary but not sufficient for fresh flowers.
Track wilting as its own quality metric. A fresh bouquet that arrives on time but wilted still costs a refund, and cold-chain or handling, not speed, is the lever.
Part 2. Why it breaks
6. How busy before deliveries fall behind?
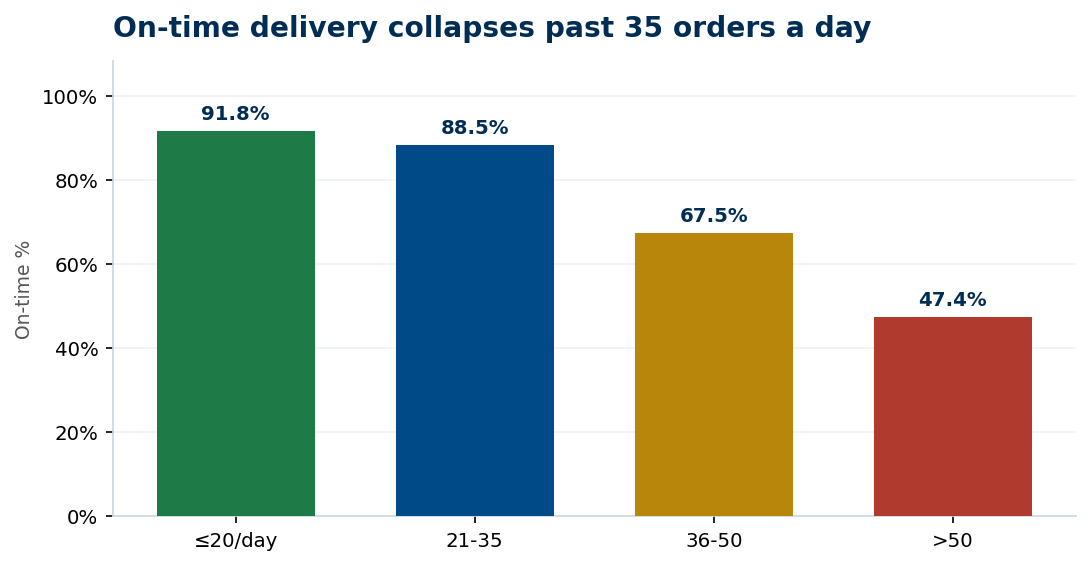
There is a clear tipping point. On-time delivery holds at 92% up to about 35 orders a day, then falls off a cliff: 67.5% at 36 to 50 orders, and 47.4% once volume passes 50. Failure is not gradual, it is a breakpoint the shop crosses on peak days like Valentine's and Mother's Day.
This is the single most controllable driver of delay. Forecast daily volume and roster extra picking and delivery capacity before the count crosses 35, not after the orders pile up.
7. Is the delay ours or the courier's?
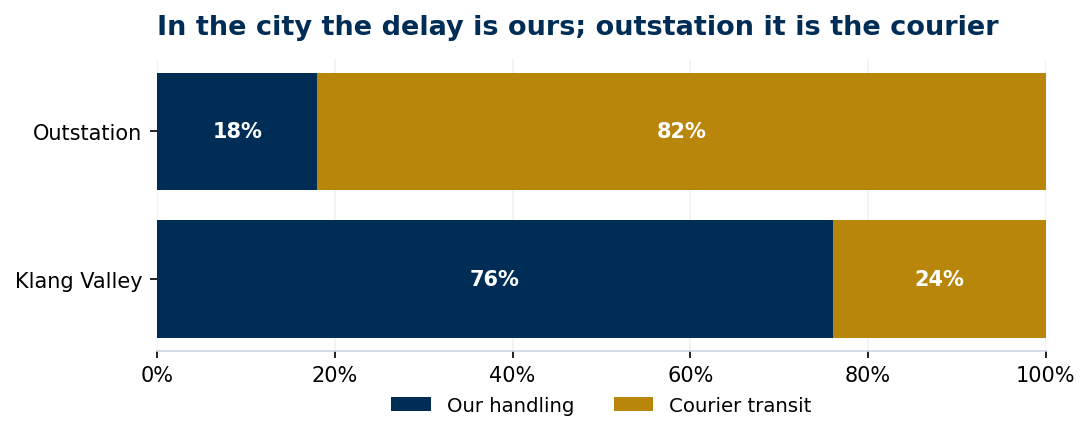
It depends on the zone, and the answer is counterintuitive. For Klang Valley late orders, 76% of the delay is internal: the shop dispatched too late for the slot, not the courier running slow. For outstation, 82% of the delay is the courier's transit. The instinct to blame couriers is only right outside the city.
Split the fix by zone. In Klang Valley, tighten your own dispatch cut-offs; this costs nothing and recovers most of the delay. Outstation is where courier renegotiation or a buffer day earns its keep.
Part 3. From delay to refund
8. What causes most of our refunds?
By the tag on the refund, damaged flowers leads with 57 cases and late delivery follows with 48. But the tags mislead. When refunds are re-checked against actual delivery times, 70% of refund money sits on orders that were genuinely late, while only 20% of refunds are labelled late. Late orders get tagged with the visible symptom, damaged or wilted, so the log understates delay.
Stop trusting the reason field alone. Delay is the largest driver of refund cost by a wide margin, and the shop has been treating it as a minor one.
9. How late before customers demand refunds?
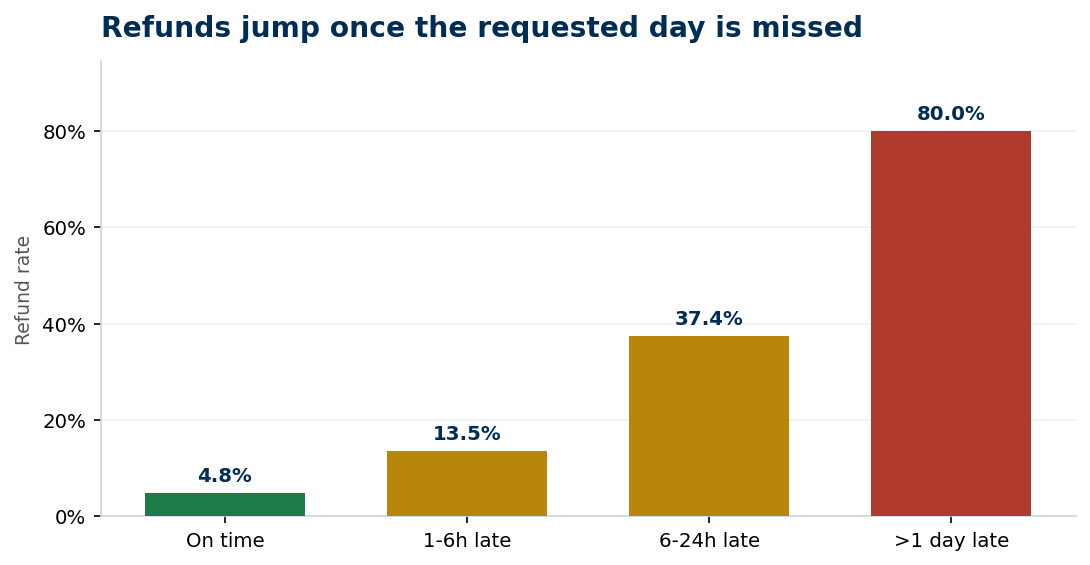
Refunds do not rise smoothly with lateness, they jump. An on-time order refunds 4.8% of the time. Push past the requested slot and it climbs to 13.5% at one to six hours late, then 37.4% at six to twenty-four hours, then 80% once the order misses its day entirely. The danger zone is the six-hour mark.
Set an internal escalation trigger before that cliff. Any order tracking more than a few hours late should get a proactive call, re-delivery, or apology gift before it turns into a refund demand.
Part 4. Who and what drives the refunds
10. Which product gets the most delay refunds?
Delay refunds track order volume, not a single culprit product. The bestsellers carry the most cases, the Baby Breath and Classic Red Rose bouquets at 23 each, at rates of 7% to 10% of their orders. The sympathy bouquet has the highest rate relative to its small volume, because condolence orders are the least forgiving of delay.
There is no bad product to cut. Protect the high-volume bouquets from delay, and give condolence orders special handling regardless of the flower.
11. Which courier causes the most refund cases?
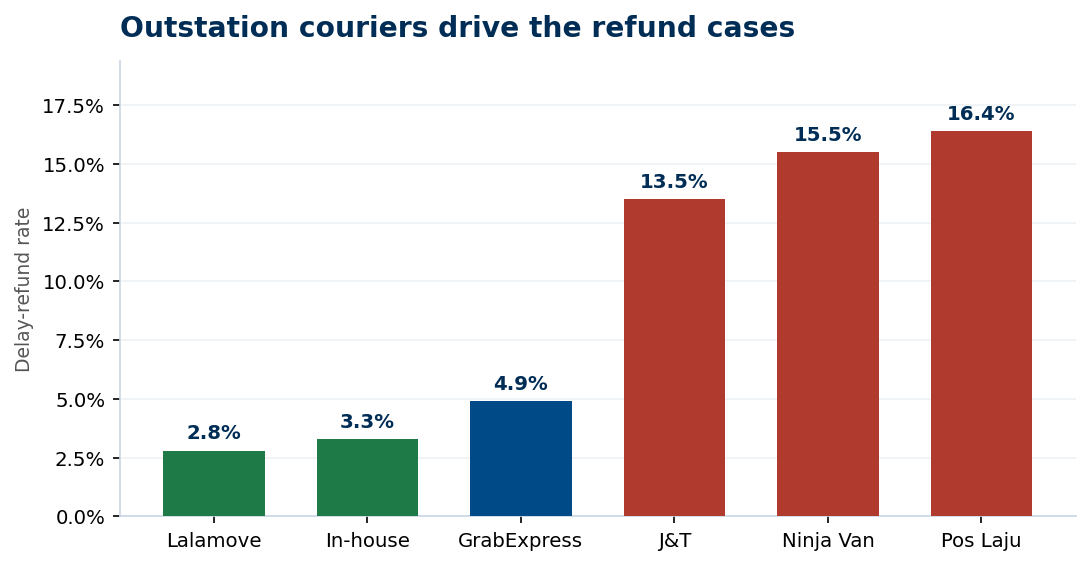
The outstation couriers are the refund engine. Pos Laju turns 16.4% of its orders into delay refunds, Ninja Van 15.5%, and J&T 13.5%. The Klang Valley couriers sit far below, between 2.8% and 4.9%. A late outstation delivery is three to five times more likely to end in a refund.
This is the clearest single lever in the report. Reducing outstation courier failures, by switching provider, penalising misses, or padding the promised date, directly removes the largest block of refund cost.
12. Which occasions can't tolerate a late delivery?
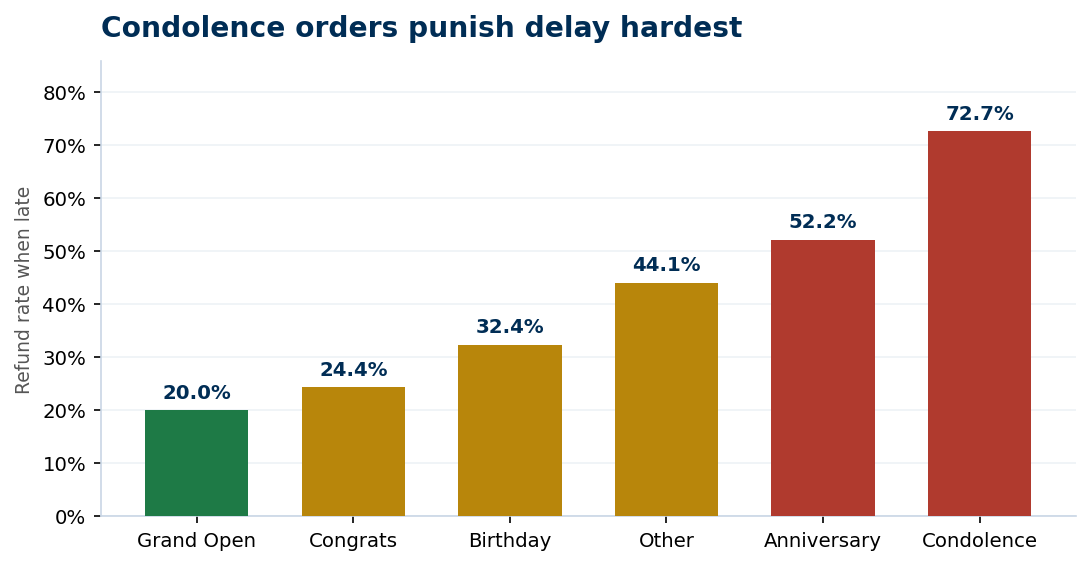
Occasion decides how badly delay hurts. A late condolence order is refunded 72.7% of the time and a late anniversary 52.2%, against 24% for a late congratulations. Hard-date occasions, where the flowers are worthless the day after, refund at 51% when late versus 35% for flexible ones. The moment matters more than the money.
Flag hard-date orders in the queue and pick them first. A one-day slip on a birthday is recoverable; on a funeral it is a lost customer and a reputation hit.
Part 5. The hidden warning and the money
13. Which warning complaints did we miss?
86 customers complained but were never refunded, and 63% of them had genuinely late orders. These are unresolved warnings: unhappy customers the shop logged and then let go without recovery. Complaints are a leading signal that arrives before the refund and before the customer quietly stops ordering.
Treat every complaint on a late order as a save opportunity. A small gesture at the complaint stage is far cheaper than the refund, and cheaper still than the lost repeat customer.
14. Where does most refund money leak?
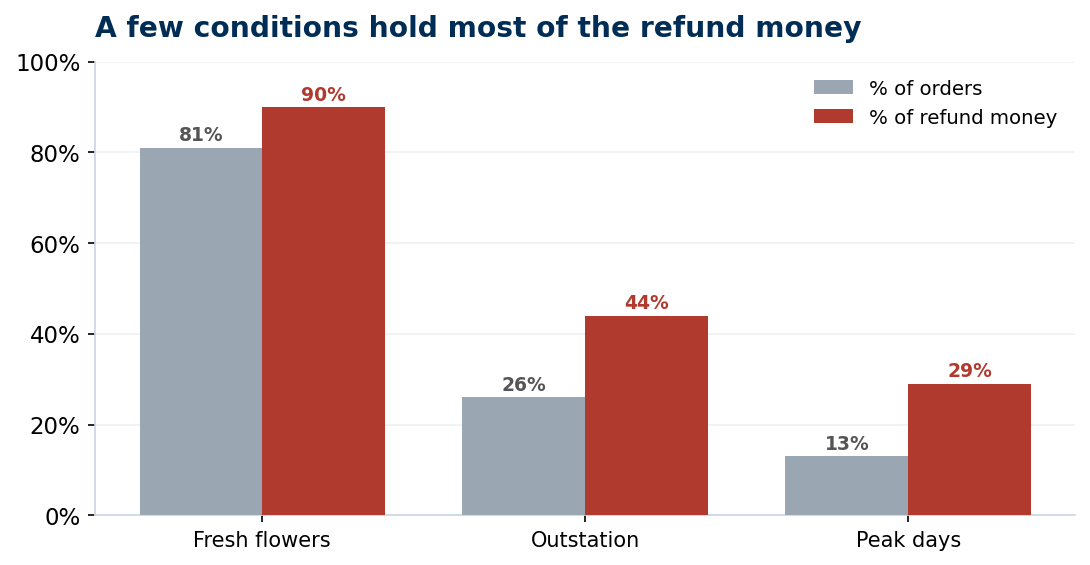
The refund money is highly concentrated. Fresh-flower orders are 81% of volume but 90% of refund cost. Outstation is 26% of orders but 44% of the money. The busiest days, above 35 orders, are 13% of orders but 29% of the refund cost. A small set of conditions drives the loss.
Aim the fixes at the concentration, not the average. Protecting fresh flowers on outstation lanes and peak days targets the exact orders where the money actually leaks.
Method & data
We analysed 2,409 order-level fulfillment records from Bloom House Concierge, a Petaling Jaya online florist, covering January to June 2026. Each record carries order, requested, dispatch, and delivery timestamps, plus delivery zone, courier, service, occasion, product, freshness, daily order volume, order value, and refund outcome. The data is complete and internally consistent, with every order's timeline correctly ordered and no missing operational values. The analysis measured on-time performance against a zone-based standard, split delay between internal handling and courier transit, found the point at which lateness converts into refunds, and traced where refund cost concentrates. This is an illustrative case study built on a simulated operational dataset calibrated to realistic florist behaviour.
Conclusion
The most important finding is that delay drives 70% of refund cost while the shop's own records blame it for barely 20%. Bloom House has been fighting the wrong fire, tightening packing and blaming damage, while late deliveries quietly took the money. The delay is real, it is measurable, and it is concentrated in a handful of conditions.
Doing nothing keeps RM 30,000 a year leaking from outstation lanes, peak days, and fresh-flower orders, and keeps losing hard-date customers whose one late funeral or anniversary delivery is unforgivable. Acting on the concentration, three levers, not thirty, recovers most of it. The largest, outstation courier reliability, alone accounts for RM 12,514. The recommended direction is simple: fix the delay where it concentrates, in order of value, and stop reading refund cost off a reason field that hides the real cause.
Recommendations
Fix outstation courier reliability. Switch or penalise the worst performers (Pos Laju 16.4% and Ninja Van 15.5% delay-refund rates) and add a one-day buffer to the outstation promise. This is the single largest lever, RM 12,514 or 41% of refund cost.
Staff before the volume cliff. On-time delivery collapses once daily orders pass roughly 35. Forecast peak days and roster extra picking and delivery capacity ahead of the spike. Peak-day delay carries RM 5,522 or 18% of refund cost.
Tighten Klang Valley dispatch. 76% of Klang Valley delay is internal, not the courier. Pull forward dispatch cut-offs and protect same-day picking. This lever is free to pull and removes delay the shop currently blames on others.
Prioritise fresh and hard-date orders. Pick condolence and anniversary orders first and handle fresh stock for cold-chain, not just speed. A late condolence refunds 73% of the time and 2% of fresh orders wilt.
Rescue complaints and re-tag refunds. Act on the 86 unresolved complaints on late orders, and record actual lateness alongside the reason field so delay stops hiding behind damage.
Appendix: refund-leak fix list
Every refund assigned to one lever by priority, ranked by the refund money at stake. Work it top down and stop when capacity runs out.
#
Lever to fix
Cases
Refund RM
Share
1
Outstation courier reliability
95
12,514
41.0%
2
Handling & quality control (non-delay)
79
9,171
30.1%
3
Peak-day capacity (Klang Valley)
39
5,522
18.1%
4
Klang Valley routine dispatch
26
2,719
8.9%
5
Hard-date order prioritization
4
586
1.9%
Data Stories Lab · Fulfillment operations analysis · Bloom House Concierge, an illustrative case study on a simulated operational dataset.