
Where the Money Is
Samsung's Top Markets, Products, and Channels Revealed
Overview
Four years of Samsung sales data tells a story of strong but uneven performance. Between 2021 and 2024, Samsung recorded 15,500 transactions across 52 countries, generating over $22M in total revenue. The numbers are largely positive — but underneath the headline figures are patterns that should directly shape how the sales team prioritises its time and resources.
This report answers six questions the sales team needs answered: whether discounting is working, which products and channels deserve the most attention, who the most valuable customers are, which markets are carrying the business, and where growth has come from — and where it may be slowing. The findings are clear and, in some cases, surprising.
Data Sources and Methodology
We analysed 15,500 Samsung sales transactions recorded between January 2021 and December 2024, covering 52 countries, 73 products across 11 categories, and 7 sales channels. Our analysis focused on total revenue in USD, average revenue per transaction, units sold, discount behaviour, and performance across customer segments, geographies, and channels. Our goal was to identify what is driving revenue so the sales team can focus its efforts where they will have the greatest impact.
1. Does discounting drive more revenue per transaction, or does it reduce it?
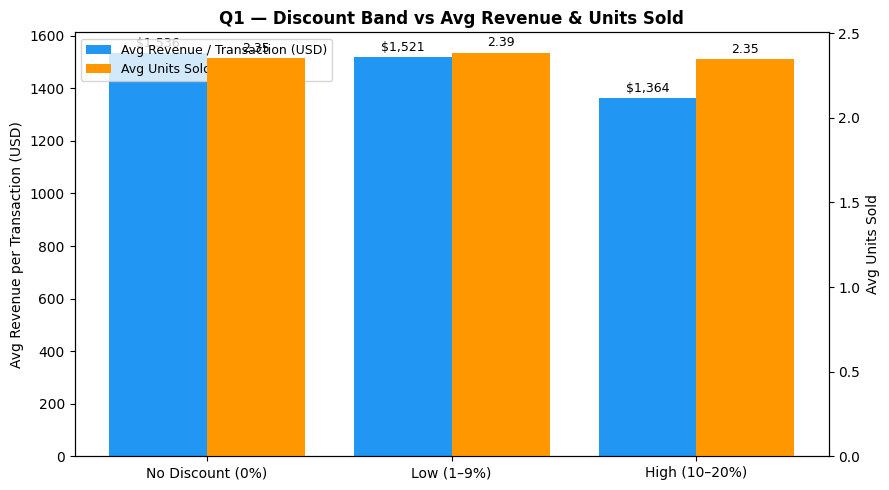
The data gives a clear answer: discounting reduces revenue without meaningfully increasing volume. Transactions with no discount averaged $1,536 per deal. Low discounts of 1–9% brought that to $1,521, and high discounts of 10–20% dropped it further to $1,364 — a $172 reduction per transaction. Meanwhile, average units sold barely moved across all three bands, sitting at approximately 2.35 units regardless of how much discount was applied.
This means the sales team is not buying more volume with discounts — it is simply reducing the value of each deal. The 4,806 high-discount transactions in the dataset represent a significant pool of revenue that was given away without a corresponding return in quantity. Discounting as a volume lever is not working here.
The implication is straightforward: the team should review when and why discounts are being applied, and set tighter guardrails — particularly for the 10–20% band. Moving even a portion of those transactions to no discount or low discount would have a direct and measurable impact on total revenue.
2. Which product categories generate the highest revenue and units sold?
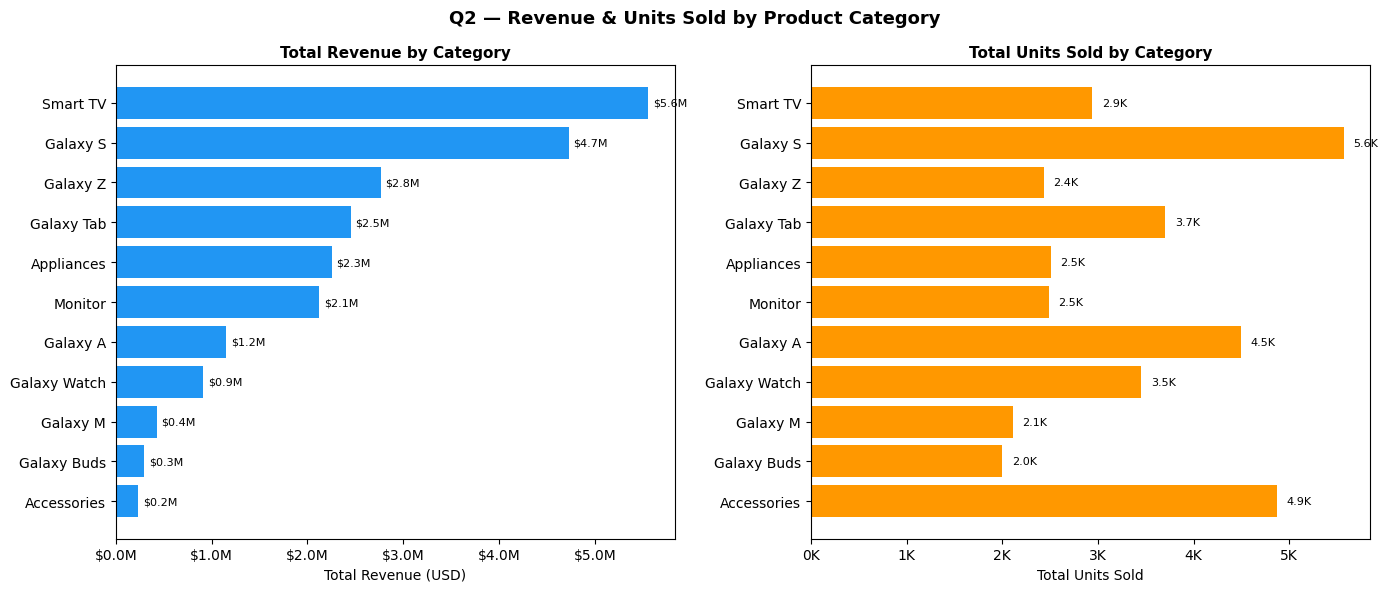
Smart TV and Galaxy S are the two categories carrying the business. Smart TV leads on total revenue at $5.6M, driven by high unit prices rather than volume — it ranks third in units sold at 2.9K. Galaxy S follows at $4.7M in revenue and leads all categories in units sold at 5.6K, making it the only category that delivers both high volume and high revenue simultaneously.
The middle tier — Galaxy Z ($2.8M), Galaxy Tab ($2.5M), Appliances ($2.3M), and Monitor ($2.1M) — contributes meaningfully but at lower volumes. Galaxy Z is worth highlighting: it generates $2.8M from only 2.4K units, the second lowest in the dataset, which reflects its premium price point. It is a high-value, low-volume category that should be protected at full price.
At the other end, Accessories sold the second highest number of units at 4.9K but generated only $0.2M in revenue. High traffic does not mean high value here. The sales team should focus primary effort on Galaxy S, Smart TV, and Galaxy Z as the categories with the strongest return per unit of effort, and avoid mistaking accessories volume for meaningful revenue contribution.
3. Which customer segments and age groups deliver the highest revenue per transaction?
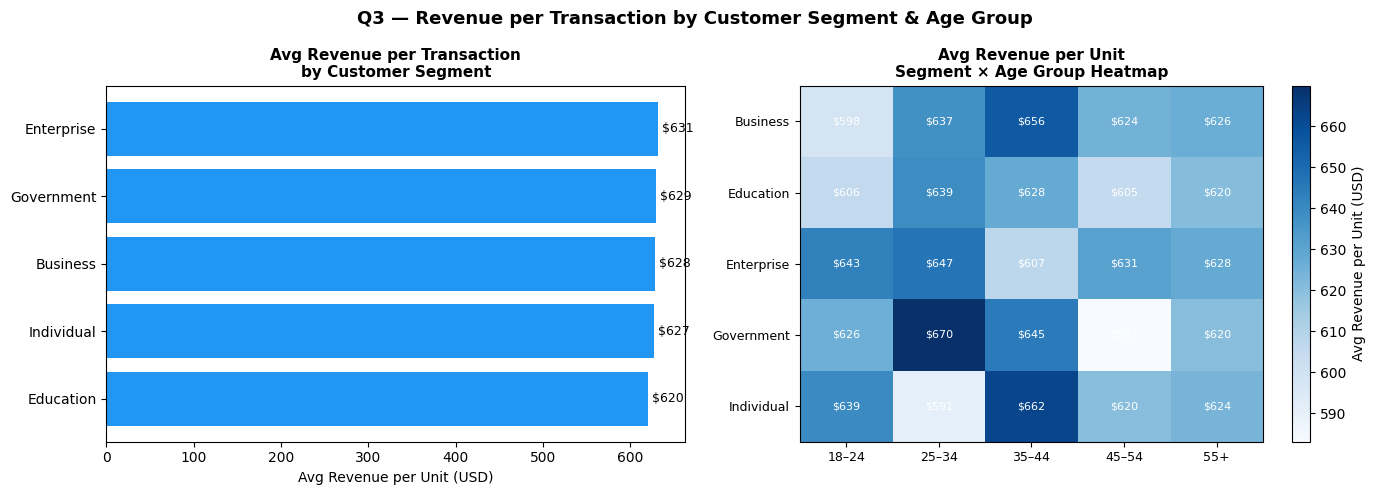
All five customer segments — Enterprise, Government, Business, Individual, and Education — spend within $11 of each other per transaction. Enterprise leads at $631 per transaction, while Education sits at the bottom at $620. This near-identical spread tells the sales team that Samsung's pricing and product mix is being received consistently across buyer types — no single segment is dramatically outspending another.
The more useful signal comes from the age group breakdown. The 25–34 and 35–44 age bands consistently produce the highest revenue per transaction across most segments. The standout combination is Government buyers aged 25–34 at $670 per transaction, followed by Individual buyers aged 35–44 at $662 and Enterprise buyers aged 25–34 at $647. Mid-career professionals — whether buying for themselves or on behalf of an organisation — are the highest-value buyers in the dataset.
For the sales team, the segment itself matters less than the age of the buyer. Prioritising the 25–44 age band across all segments — in targeting, messaging, and channel selection — is where the data points most clearly.
4. Which sales channels produce the highest revenue and average transaction value?
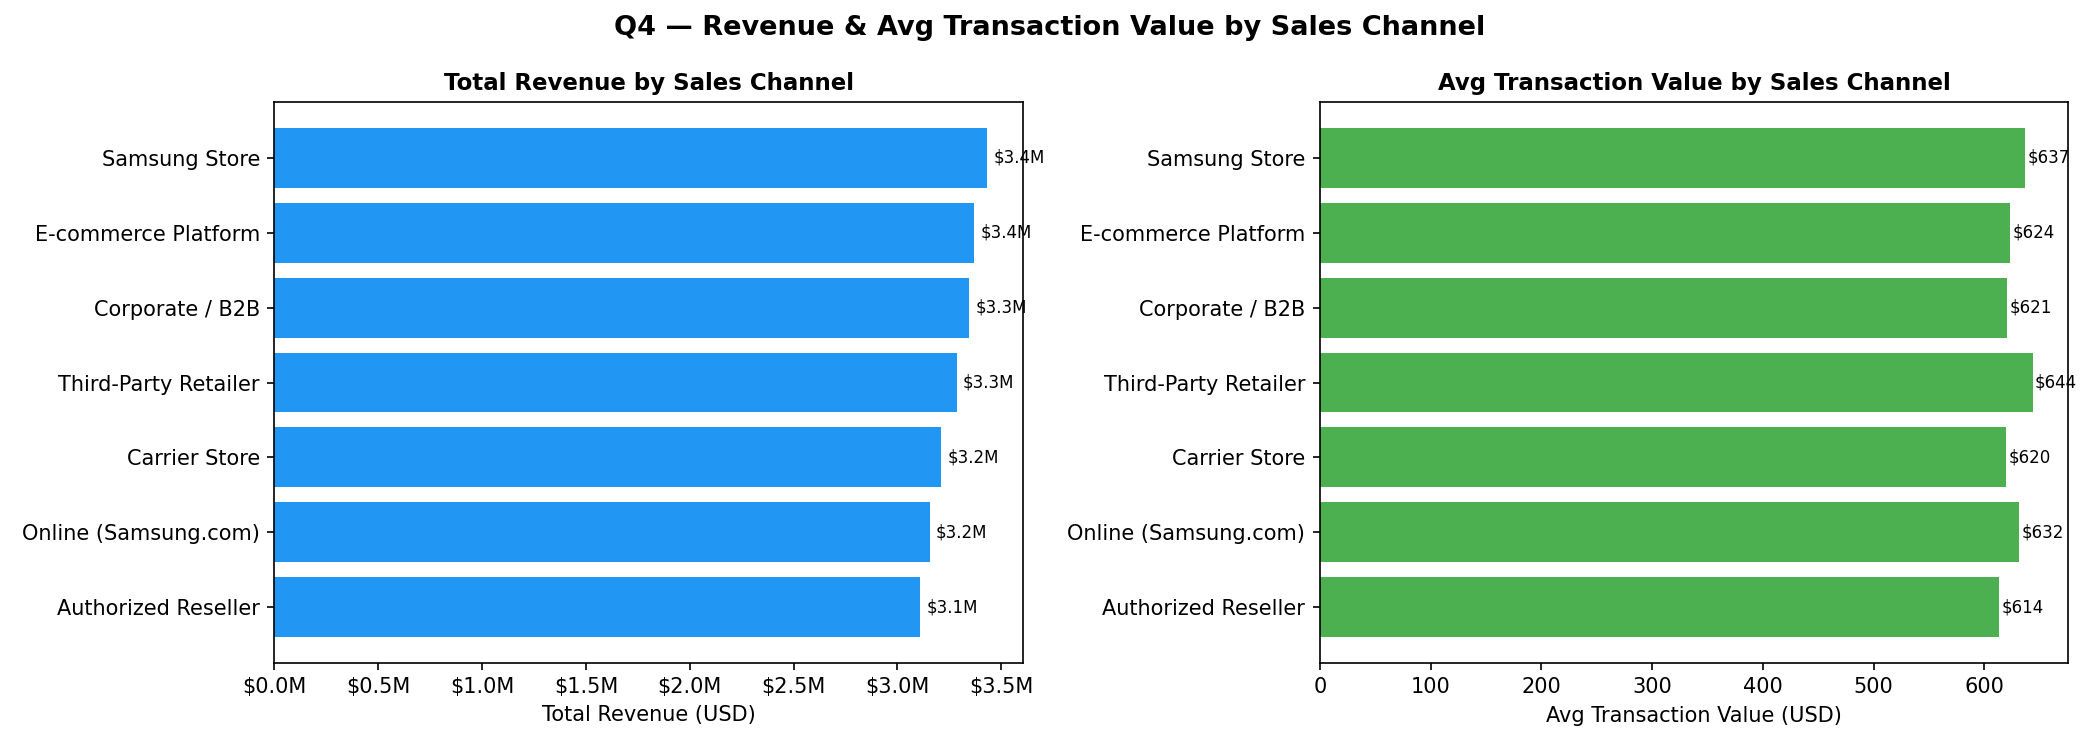
Revenue is spread almost evenly across all seven channels, ranging from $3.1M for Authorized Reseller to $3.4M for Samsung Store and E-commerce Platform. The $300K gap between top and bottom over four years is narrow — a sign that Samsung's channel mix is well-diversified and no single channel is over-relied upon.
Where the channels differ more meaningfully is in average transaction value. Third-Party Retailer leads at $644 per transaction, followed by Samsung Store at $637 and Online Samsung.com at $632. Authorized Reseller sits at the bottom at $614 — $30 below the leader. This gap is not enormous, but across thousands of transactions it adds up.
The channel mix is healthy overall. If the goal is to improve revenue quality rather than just volume, the team should look at shifting more transactions toward Third-Party Retailer and Samsung Store, while examining whether Authorized Reseller deals can be upgraded through product mix or bundle strategies to close the transaction value gap.
5. Which regions and countries contribute the most and least to total revenue?
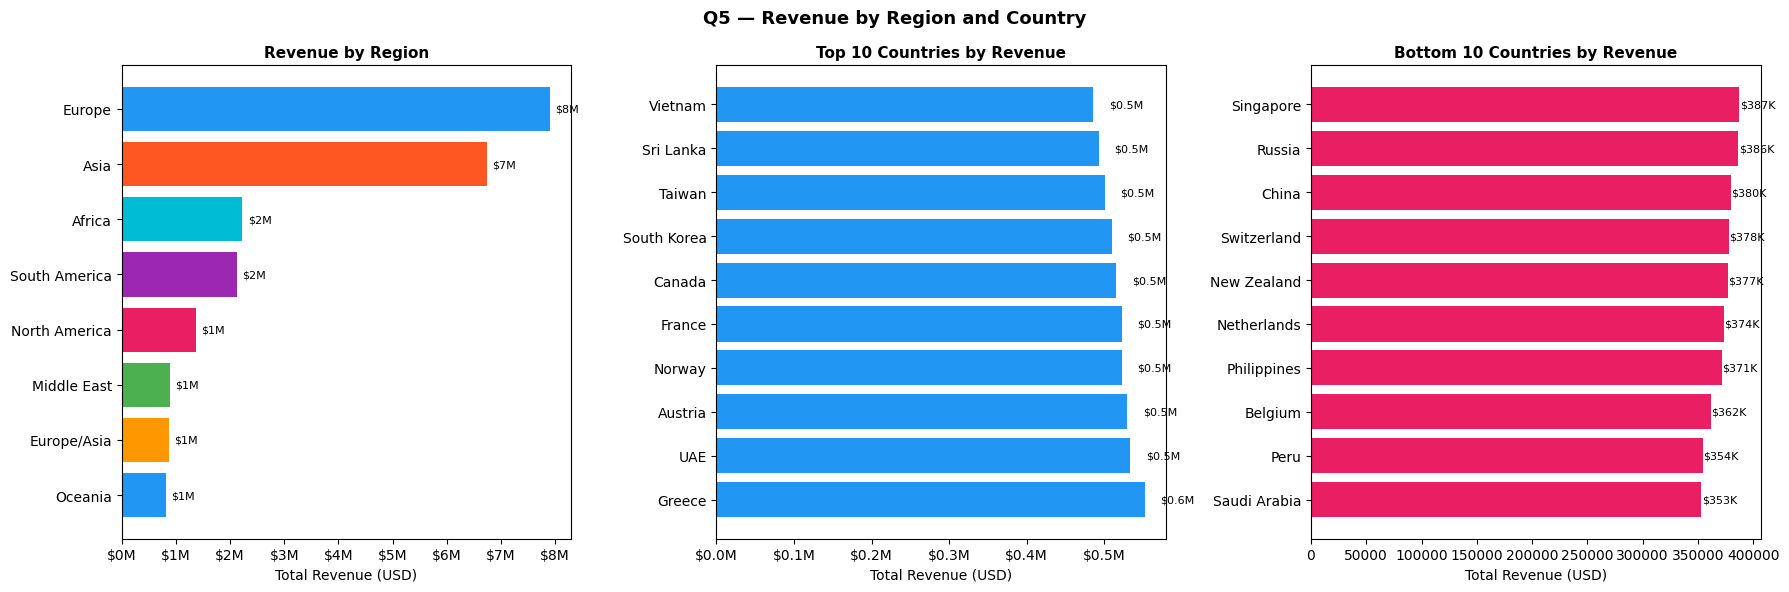
Europe is Samsung's strongest market by a clear margin at $8M in total revenue, followed by Asia at $7M. Together these two regions account for the large majority of global sales. After that, the drop is steep — Africa and South America sit at approximately $2M each, and North America, Middle East, Europe/Asia, and Oceania all hover around $1M.
North America's position at fifth globally is notable. Given its size as a consumer electronics market, $1M over four years points to either a structural gap in Samsung's reach or a gap worth investigating further. At the country level, Greece leads all 52 markets at $552K, followed by UAE ($534K), Austria ($530K), Norway ($523K), and France ($523K) — a top 5 dominated by mid-sized European and Middle Eastern markets.
The full range across all 52 countries runs from $353K to $552K, which is relatively narrow. The strategic opportunity is not to abandon weaker markets but to identify what Greece, UAE, and Austria are doing right, and replicate those conditions in underpenetrated high-potential markets like the United States, Germany ($429K), and China.
6. How has total revenue trended year on year, and which category, channel, and region is driving that growth?
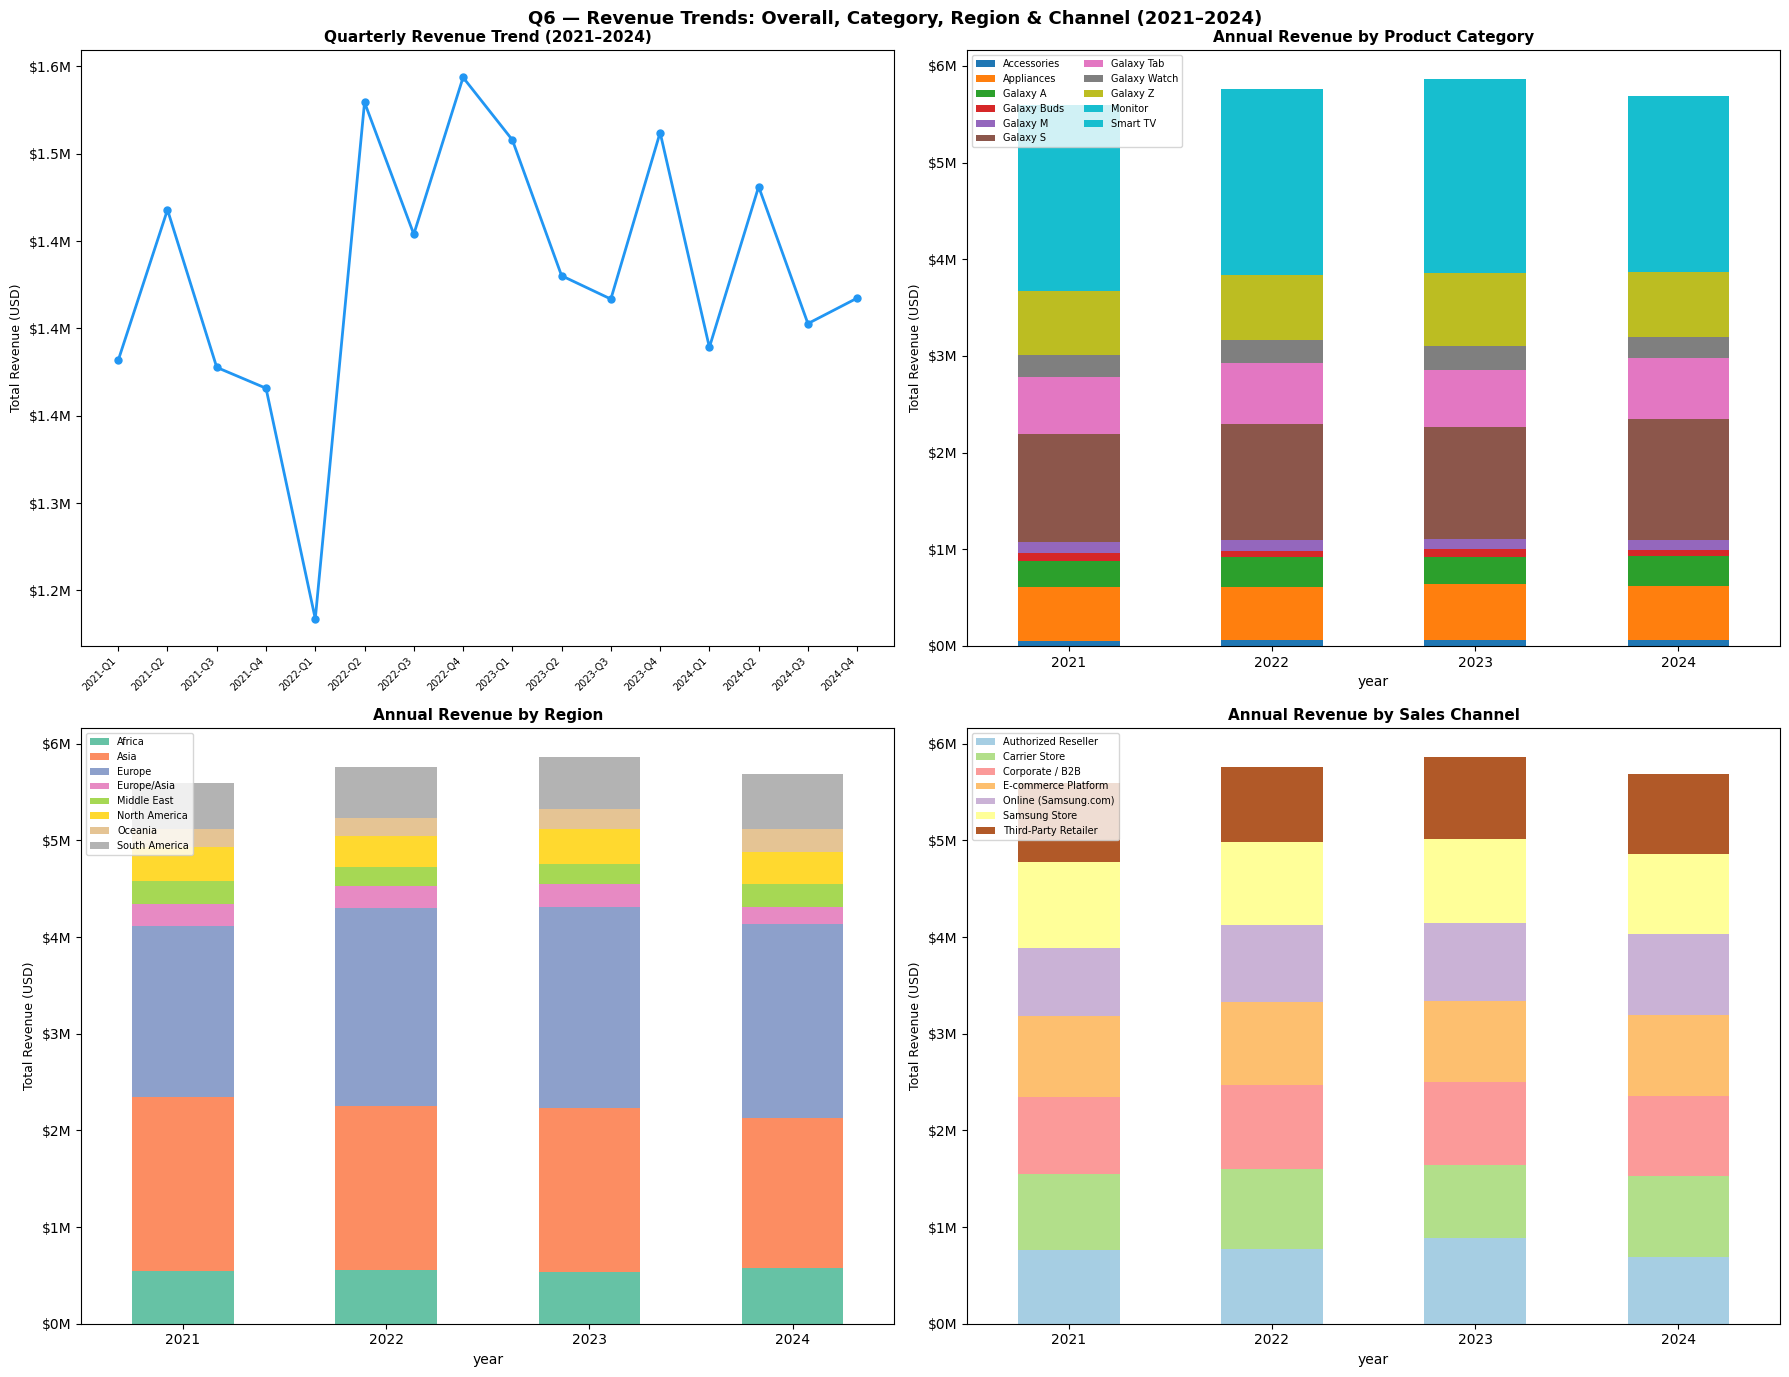
Revenue grew steadily from $5.59M in 2021 to a peak of $5.87M in 2023, before pulling back to $5.69M in 2024 — a 3% decline from the peak. The quarterly trend reflects this pattern: after a sharp dip in Q1 2022 (the weakest quarter in the dataset at $1.23M), revenue recovered strongly through 2022 and into 2023 before softening from mid-2023 onward.
Europe has been the most consistent growth driver across all four years, growing steadily in both absolute revenue and share of total. Galaxy S and Smart TV have anchored category performance throughout, with Galaxy Z showing a strong run in 2022–2023 before easing in 2024. The most significant factor behind the 2024 decline is Smart TV, which dropped from its 2023 peak and pulled overall revenue down with it. Asia also showed a slight contraction in 2024, adding further pressure. Channel performance remained stable year on year with no meaningful shift in mix across the four-year period.
The overall picture is a business that grew well for two consecutive years and is now facing mild headwinds. For the sales team, the 2024 softening is a clear signal: protect Smart TV revenue, sustain Galaxy S momentum, and build harder in underpenetrated markets before the trend becomes more pronounced.
Conclusion
Four years of data point to a sales operation that is performing broadly well but has specific areas where focused action would drive meaningful improvement. The two most urgent findings are discounting and market concentration. Discounting in the 10–20% band is reducing revenue per transaction by $172 without driving additional units — tightening discount discipline alone could recover significant revenue across the 4,806 affected transactions. At the same time, Europe's dominance at $8M and North America's underperformance at $1M reflect an imbalance that targeted market development could begin to correct.
The product and customer priorities are clear. Galaxy S delivers both volume and revenue and must remain the anchor of the team's effort. Smart TV generates the highest total revenue but showed its first meaningful decline in 2024, which warrants close attention heading into the next cycle. Galaxy Z produces strong revenue from limited volume and should be protected at full price rather than moved through discounting. For channels and customers, the evidence is consistent — Third-Party Retailer and Samsung Store deliver the highest transaction values, and buyers in the 25–44 age band are the most valuable across every segment. Aligning sales focus around these priorities gives the team the clearest path to sustaining growth through 2025 and beyond.