
Who Stays and Who Leaves?
What Location Tells Us About Customer Retention
Overview
This analysis was developed to help marketers decide where to focus their customer retention efforts based on geographic location. It examined whether customers living in rural, suburban, or urban areas are more likely to stay with the brand or disengage. The goal is to provide simple, actionable insights that help marketing teams plan smarter campaigns.
Findings show that customers in suburban and rural areas are more likely to remain loyal, while urban customers are more likely to leave. Although location isn’t the only factor influencing retention, it offers a helpful starting point for segmenting audiences and adjusting campaign strategies by region.
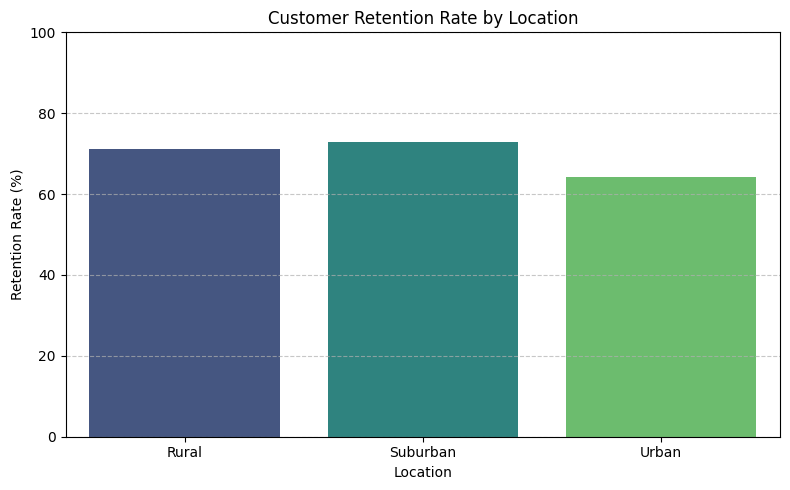
Q1. What percentage of customers are retained in each location category?
The data revealed that suburban customers had the highest retention rate at 72.97%, followed closely by rural customers at 71.15%. Urban customers had the lowest retention rate at 64.24%. These differences suggest that suburban and rural regions have stronger customer loyalty, while urban areas may require additional marketing support to improve retention.
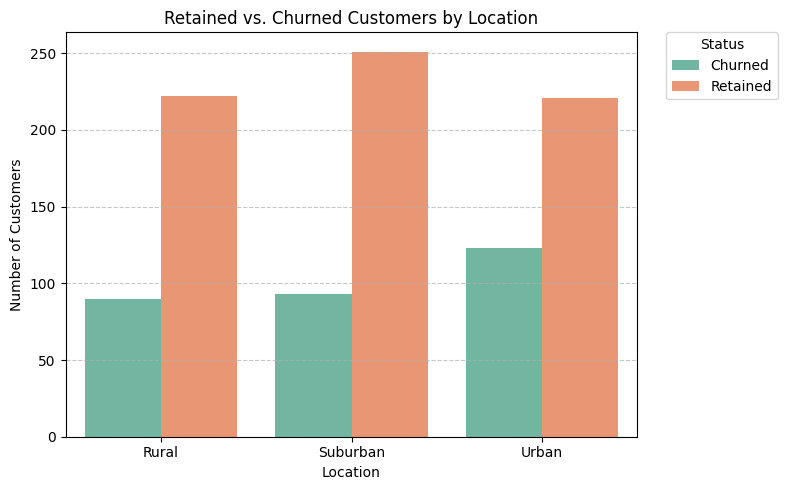
Q2. How many retained and churned customers come from each location type?
Rural areas had 222 retained and 90 churned customers. Suburban areas recorded 251 retained and 93 churned, while urban areas had a similar number of retained customers (221) but a much higher churn count at 123. This imbalance reinforces the need for targeted marketing strategies in urban areas, where customer loyalty appears less stable.
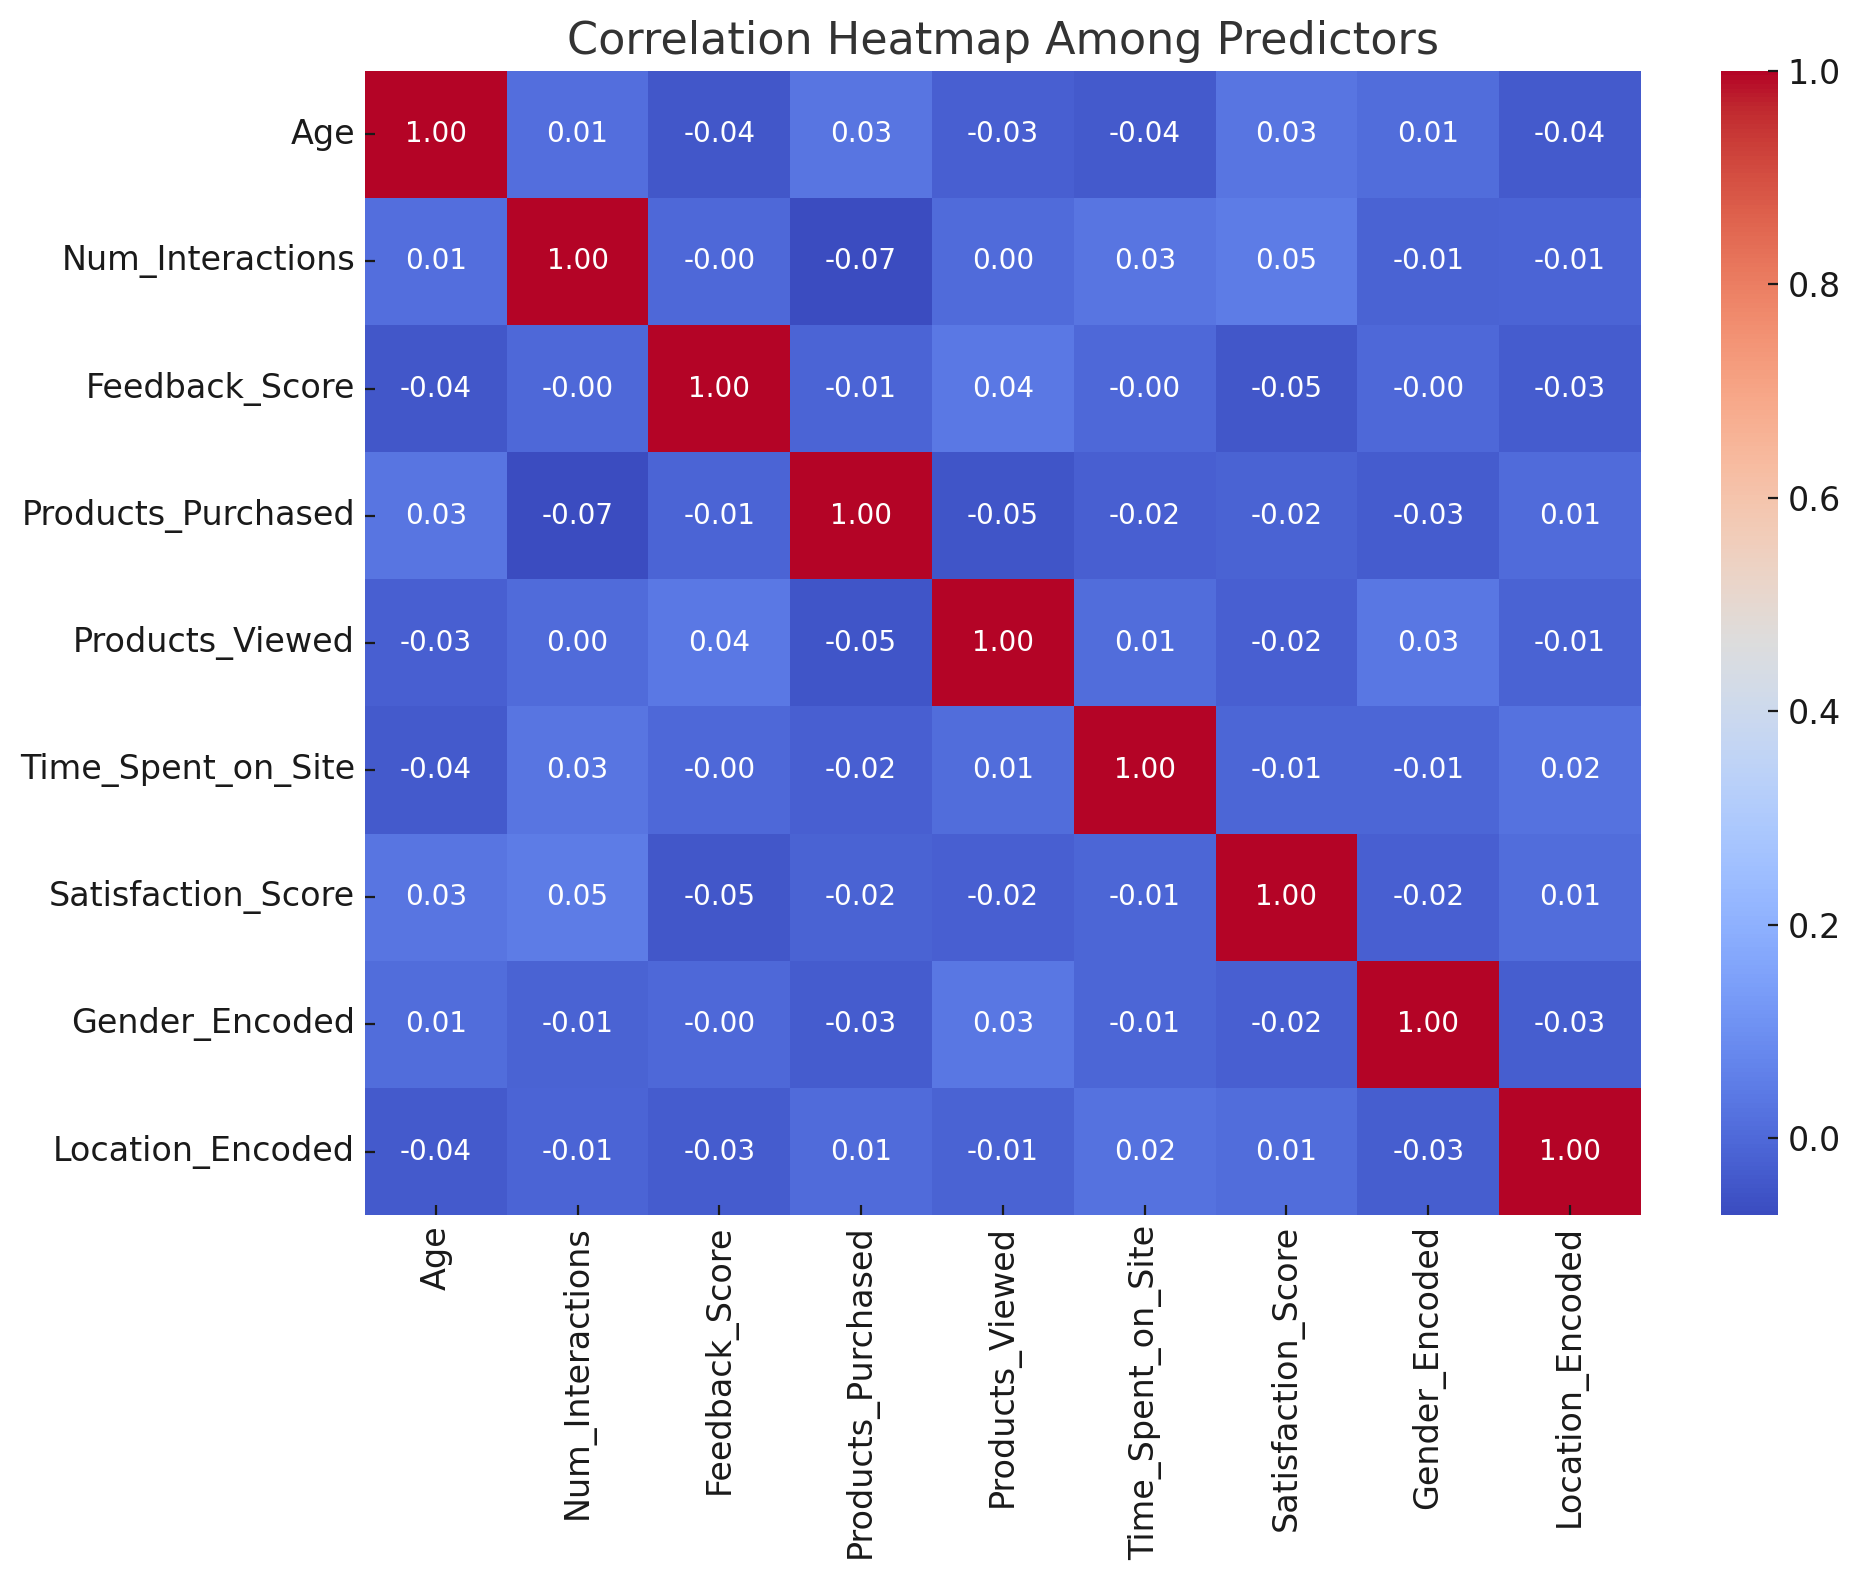
Q3. Which location types show the strongest relationship with customer retention, and are any of them too similar in effect to distinguish?
Location was the variable most strongly linked to retention, though the overall relationship was weak. It had little overlap with other predictors, meaning it contributed its own unique information. This makes it a useful feature for audience segmentation, even if it doesn’t offer deep predictive power on its own.
Q4. Is customer location statistically significant in predicting retention, and which location group should we focus on for targeted campaigns?
Customer location was found to have a modest but noticeable effect on retention. While the p-value (0.060) was just above the conventional significance threshold, it still suggested that customers in urban areas are less likely to stay. This supports the idea of focusing campaign efforts on retaining urban customers, who may respond better to proactive engagement strategies.
Q5. Can we build a reliable model that predicts whether a customer will stay or churn based solely on their location?
The model built using location alone was statistically valid, with a p-value under 0.05. However, it explained very little of the variation in customer outcomes. While the pattern was consistent—urban customers tended to churn more—the model lacked the strength to predict outcomes at an individual level. Location can help segment audiences, but it shouldn’t be the only factor used in campaign planning.
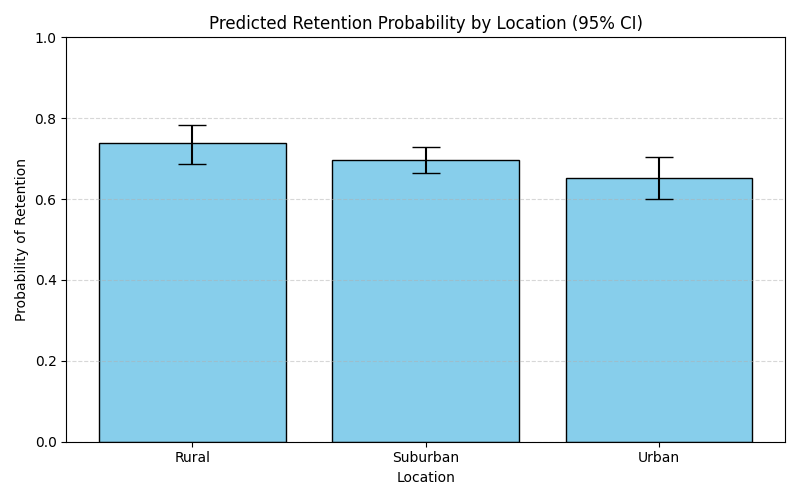
Q6. What is the likelihood that a customer will stay with us based on their location?
When predicting by location, rural customers had a 73.76% chance of staying, suburban customers 69.69%, and urban customers just 65.28%. These figures confirm the earlier trend: rural and suburban customers are more dependable, while urban customers may need more effort to retain.
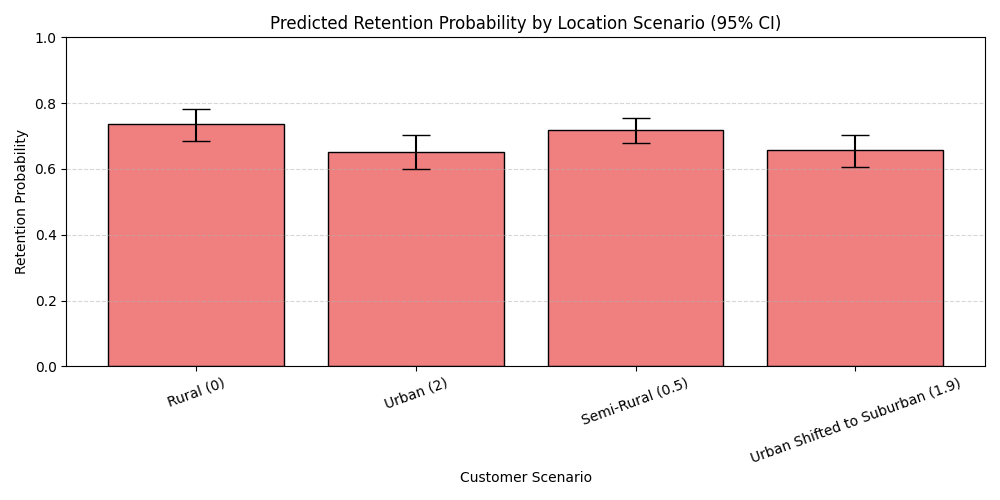
Q7. What happens to retention likelihood when location assumptions shift?
Simulations showed that shifting from a rural to an urban setting led to an 8.5 percentage point drop in expected retention. Semi-rural areas performed nearly as well as rural ones, with a 71.77% retention rate. Even a small behavioral shift in urban customers—toward suburban patterns—increased predicted retention to 65.74%. These “what-if” scenarios help marketers plan for expansion or demographic changes.
Q8. How accurate is our location-based model in identifying retention trends, and is it good enough to inform marketing actions?
The model’s predictions tended to fall within a narrow range and leaned toward predicting most customers as “retained.” It captured general trends—like higher churn in urban areas—but lacked detail to support one-to-one targeting. With limited predictive strength, the model is better suited for high-level segmentation than for automating personalized campaign actions.
Conclusion
Location does have an influence on customer retention, though it’s modest. Customers in suburban and rural areas are more likely to stay, while those in urban regions are more prone to churn. These differences offer a practical starting point for marketers to segment their audiences, tailor messaging by location, and prioritize retention where it’s most needed.
Recommendations
- Focus retention efforts on urban customers: Urban customers have the highest churn rates. They are ideal candidates for welcome incentives, win-back campaigns, and follow-up messaging.
- Reinforce loyalty in rural and suburban areas: These segments already show strong loyalty. Consider using referral or rewards programs to keep them engaged and amplify their value.
- Segment by retention risk: Use location to group customers by churn risk, and then layer on behavioral data to sharpen campaign focus.
- Plan for new or shifting markets: Use simulation results to predict retention in emerging or semi-developed areas. Tailor efforts accordingly.
- Avoid relying on location alone: Location helps, but only to a small extent. Stronger predictors like purchase behavior or engagement are essential for personalized targeting.
- Keep monitoring behavior across regions: If urban customers start acting more like suburban ones—or vice versa—update your segmentation and campaign strategy to reflect those shifts.