Cash Cows, Discounts, and Delays
How to spot the products that power growth and the ones holding you back
Overview
This analysis helps store management see which product categories truly make money, which ones lose value through discounts, and where problems like returns or delivery delays are eating into profits. The aim is to give a clear picture of what drives performance and what holds it back.
With these insights, management can decide where to put more stock and attention, where to cut back, and how to adjust discount and operations policies. The goal is to support quick, confident decisions that protect profits and improve customer satisfaction.
Dataset and Methodology
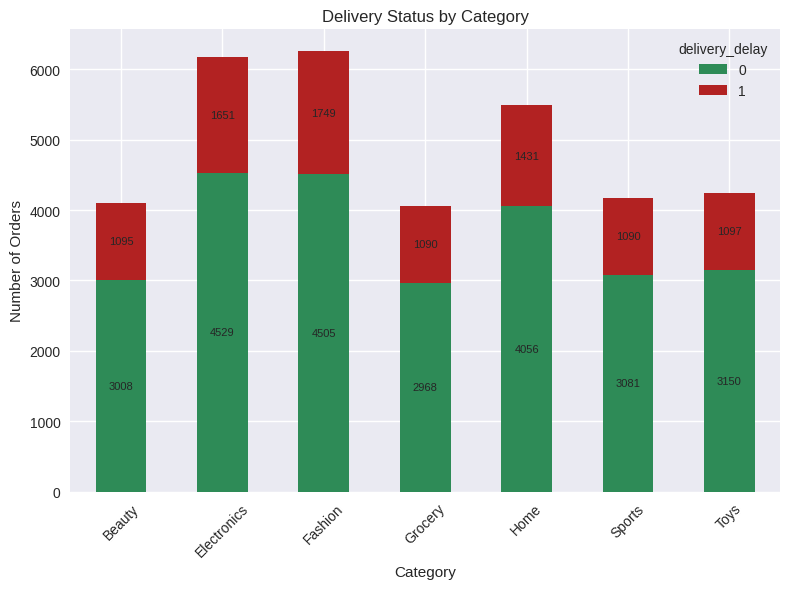
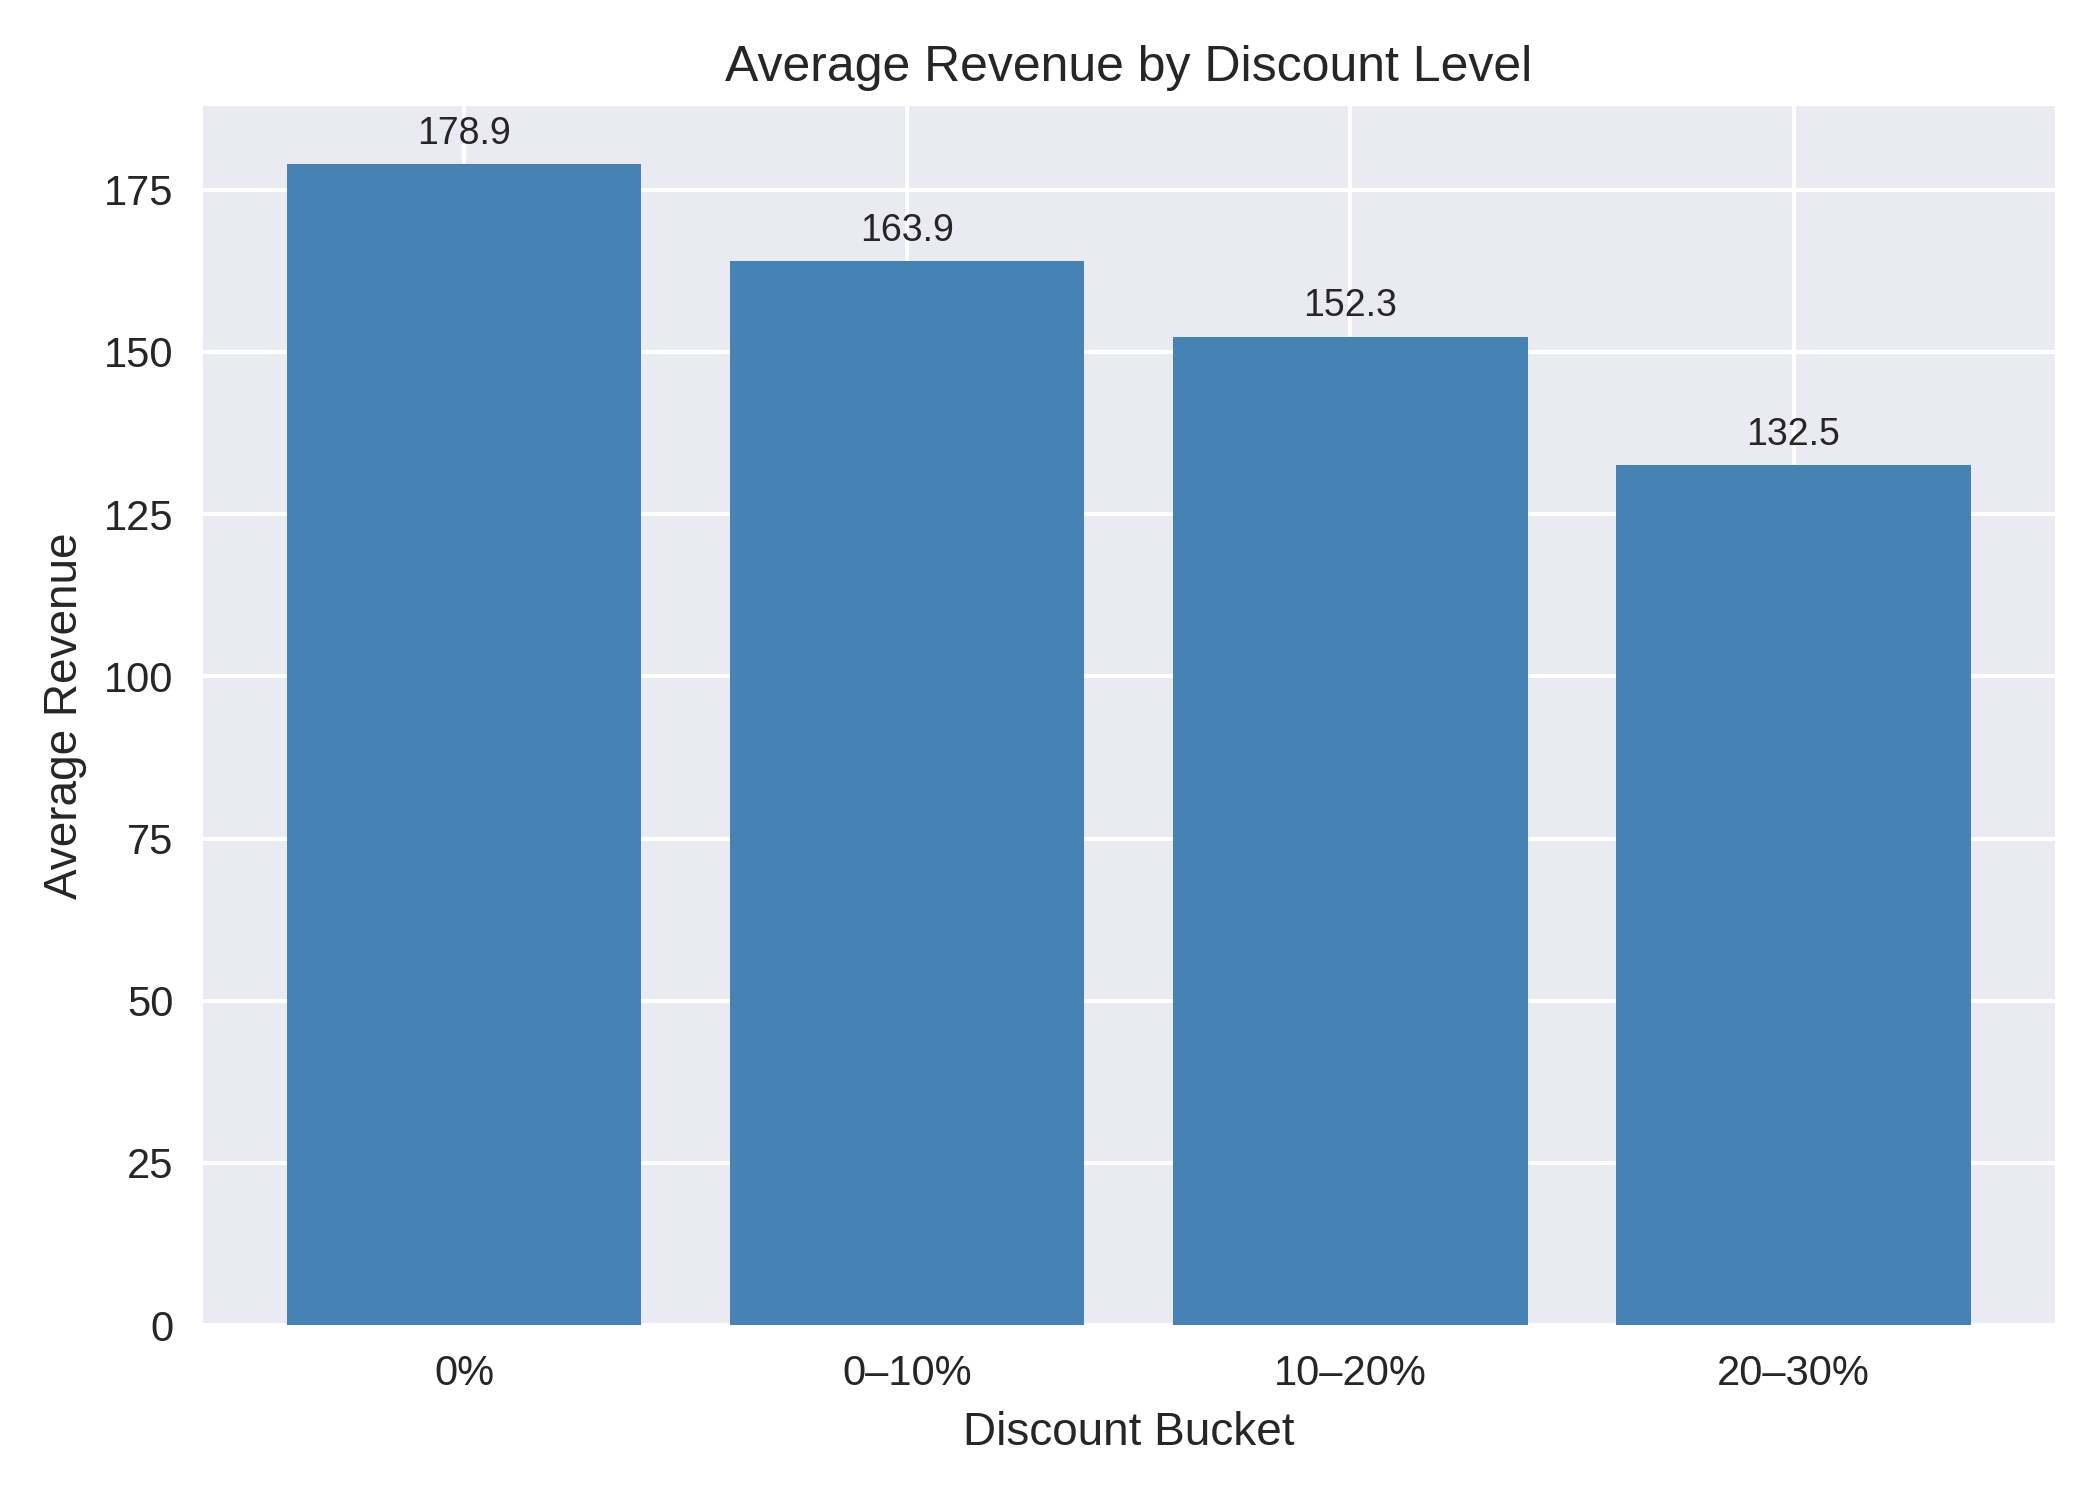
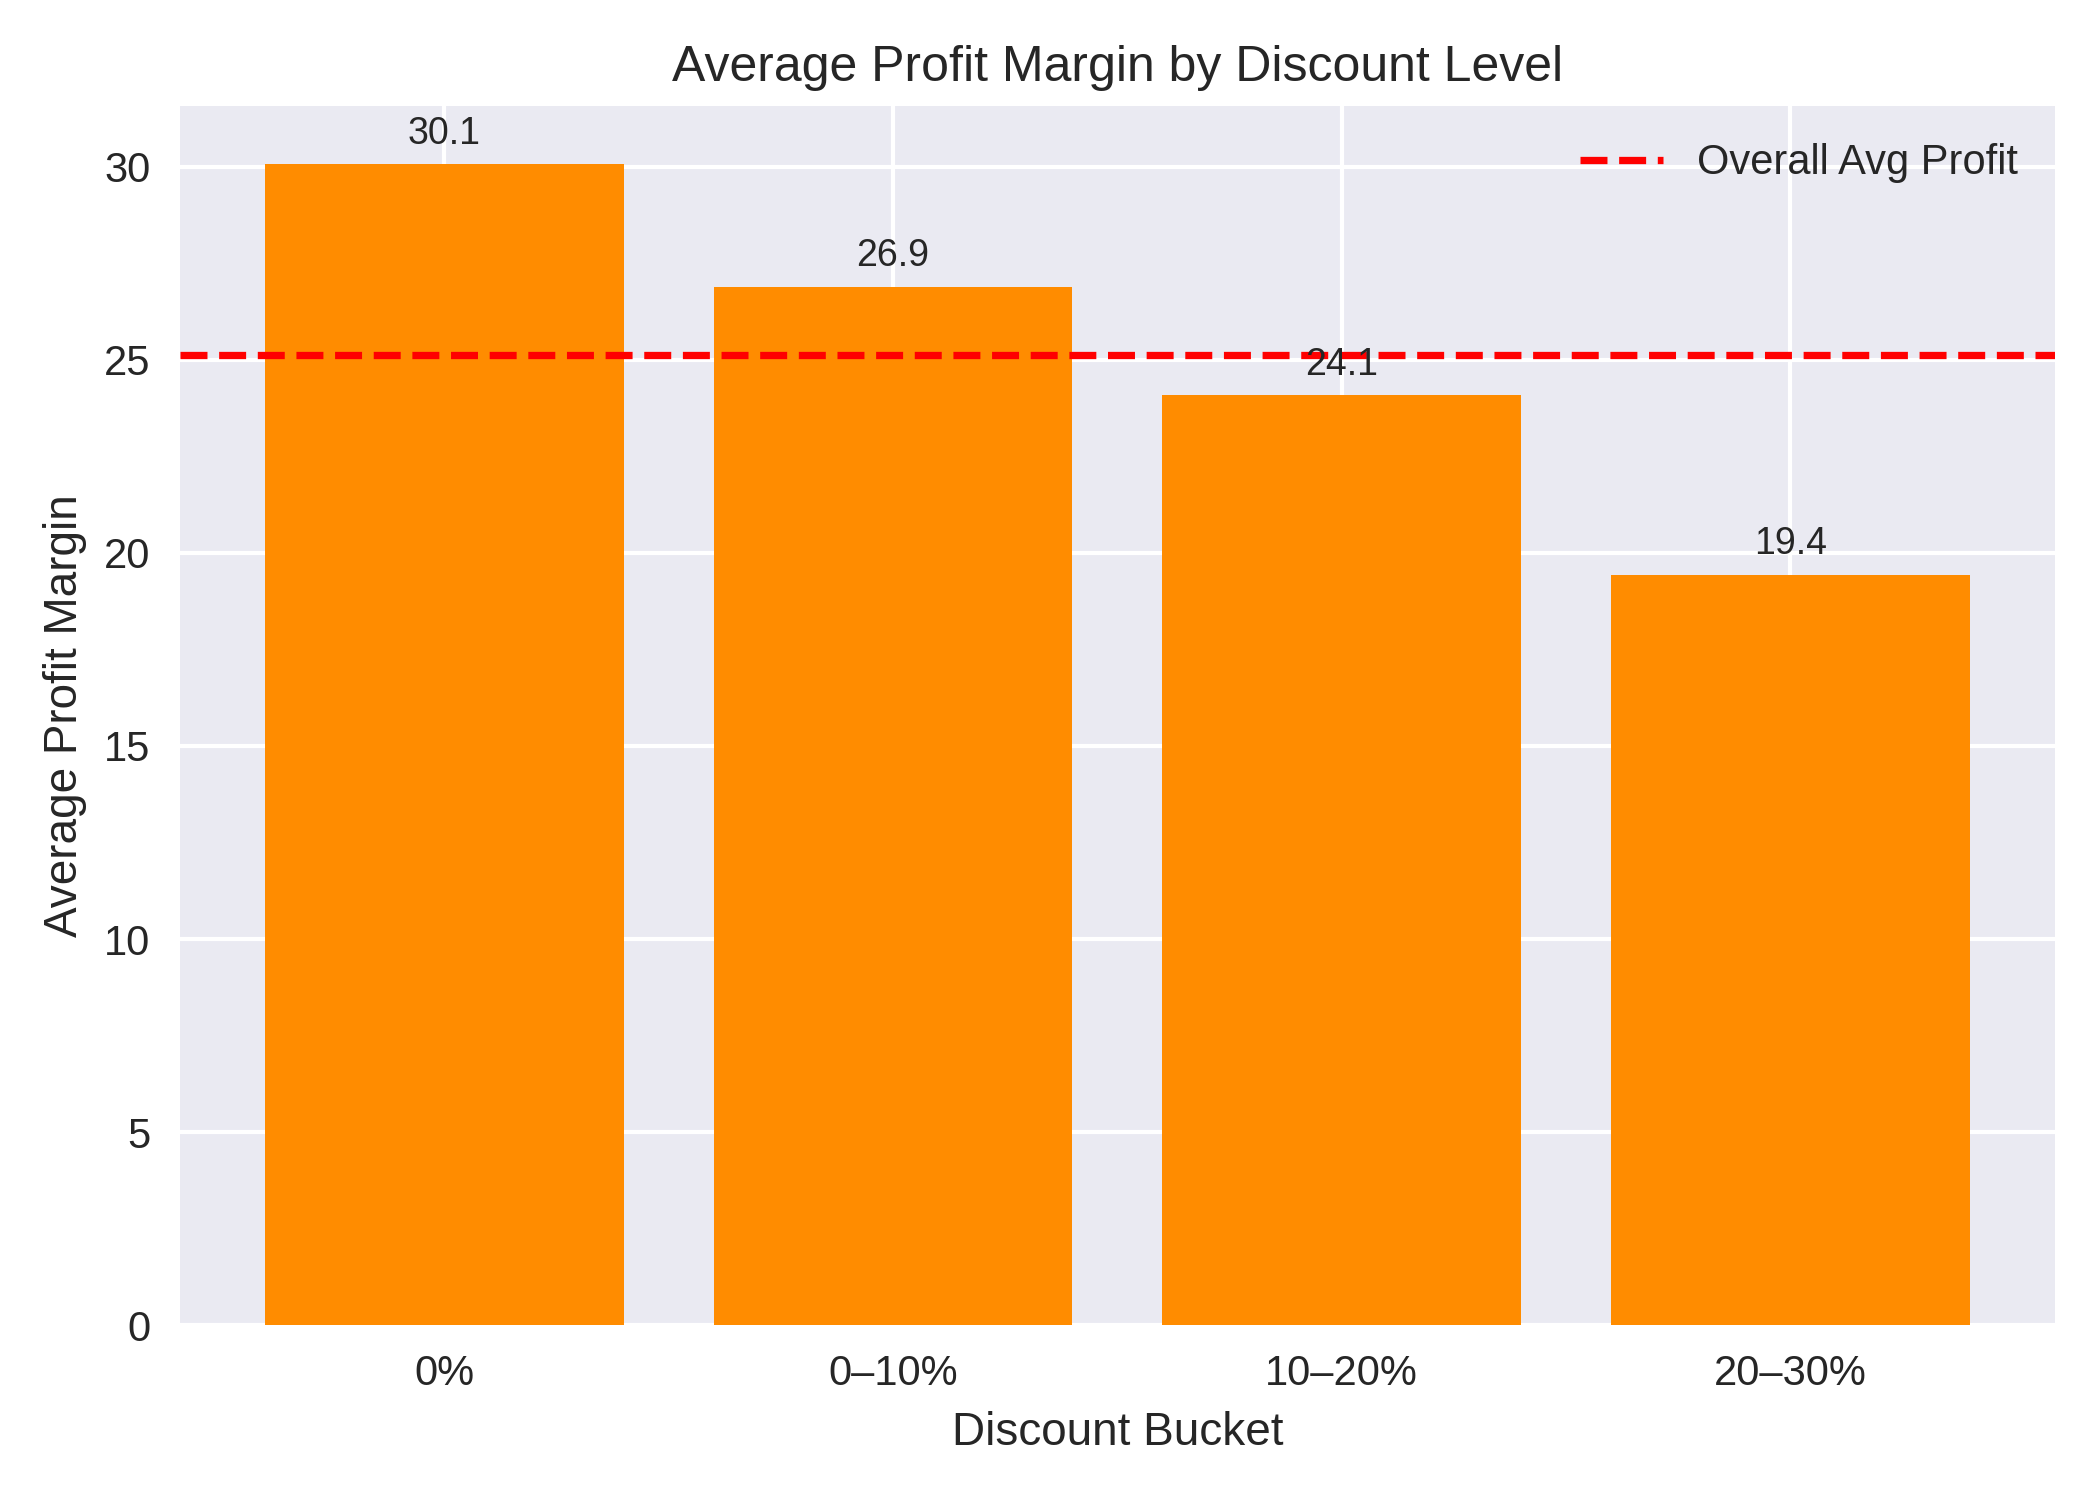
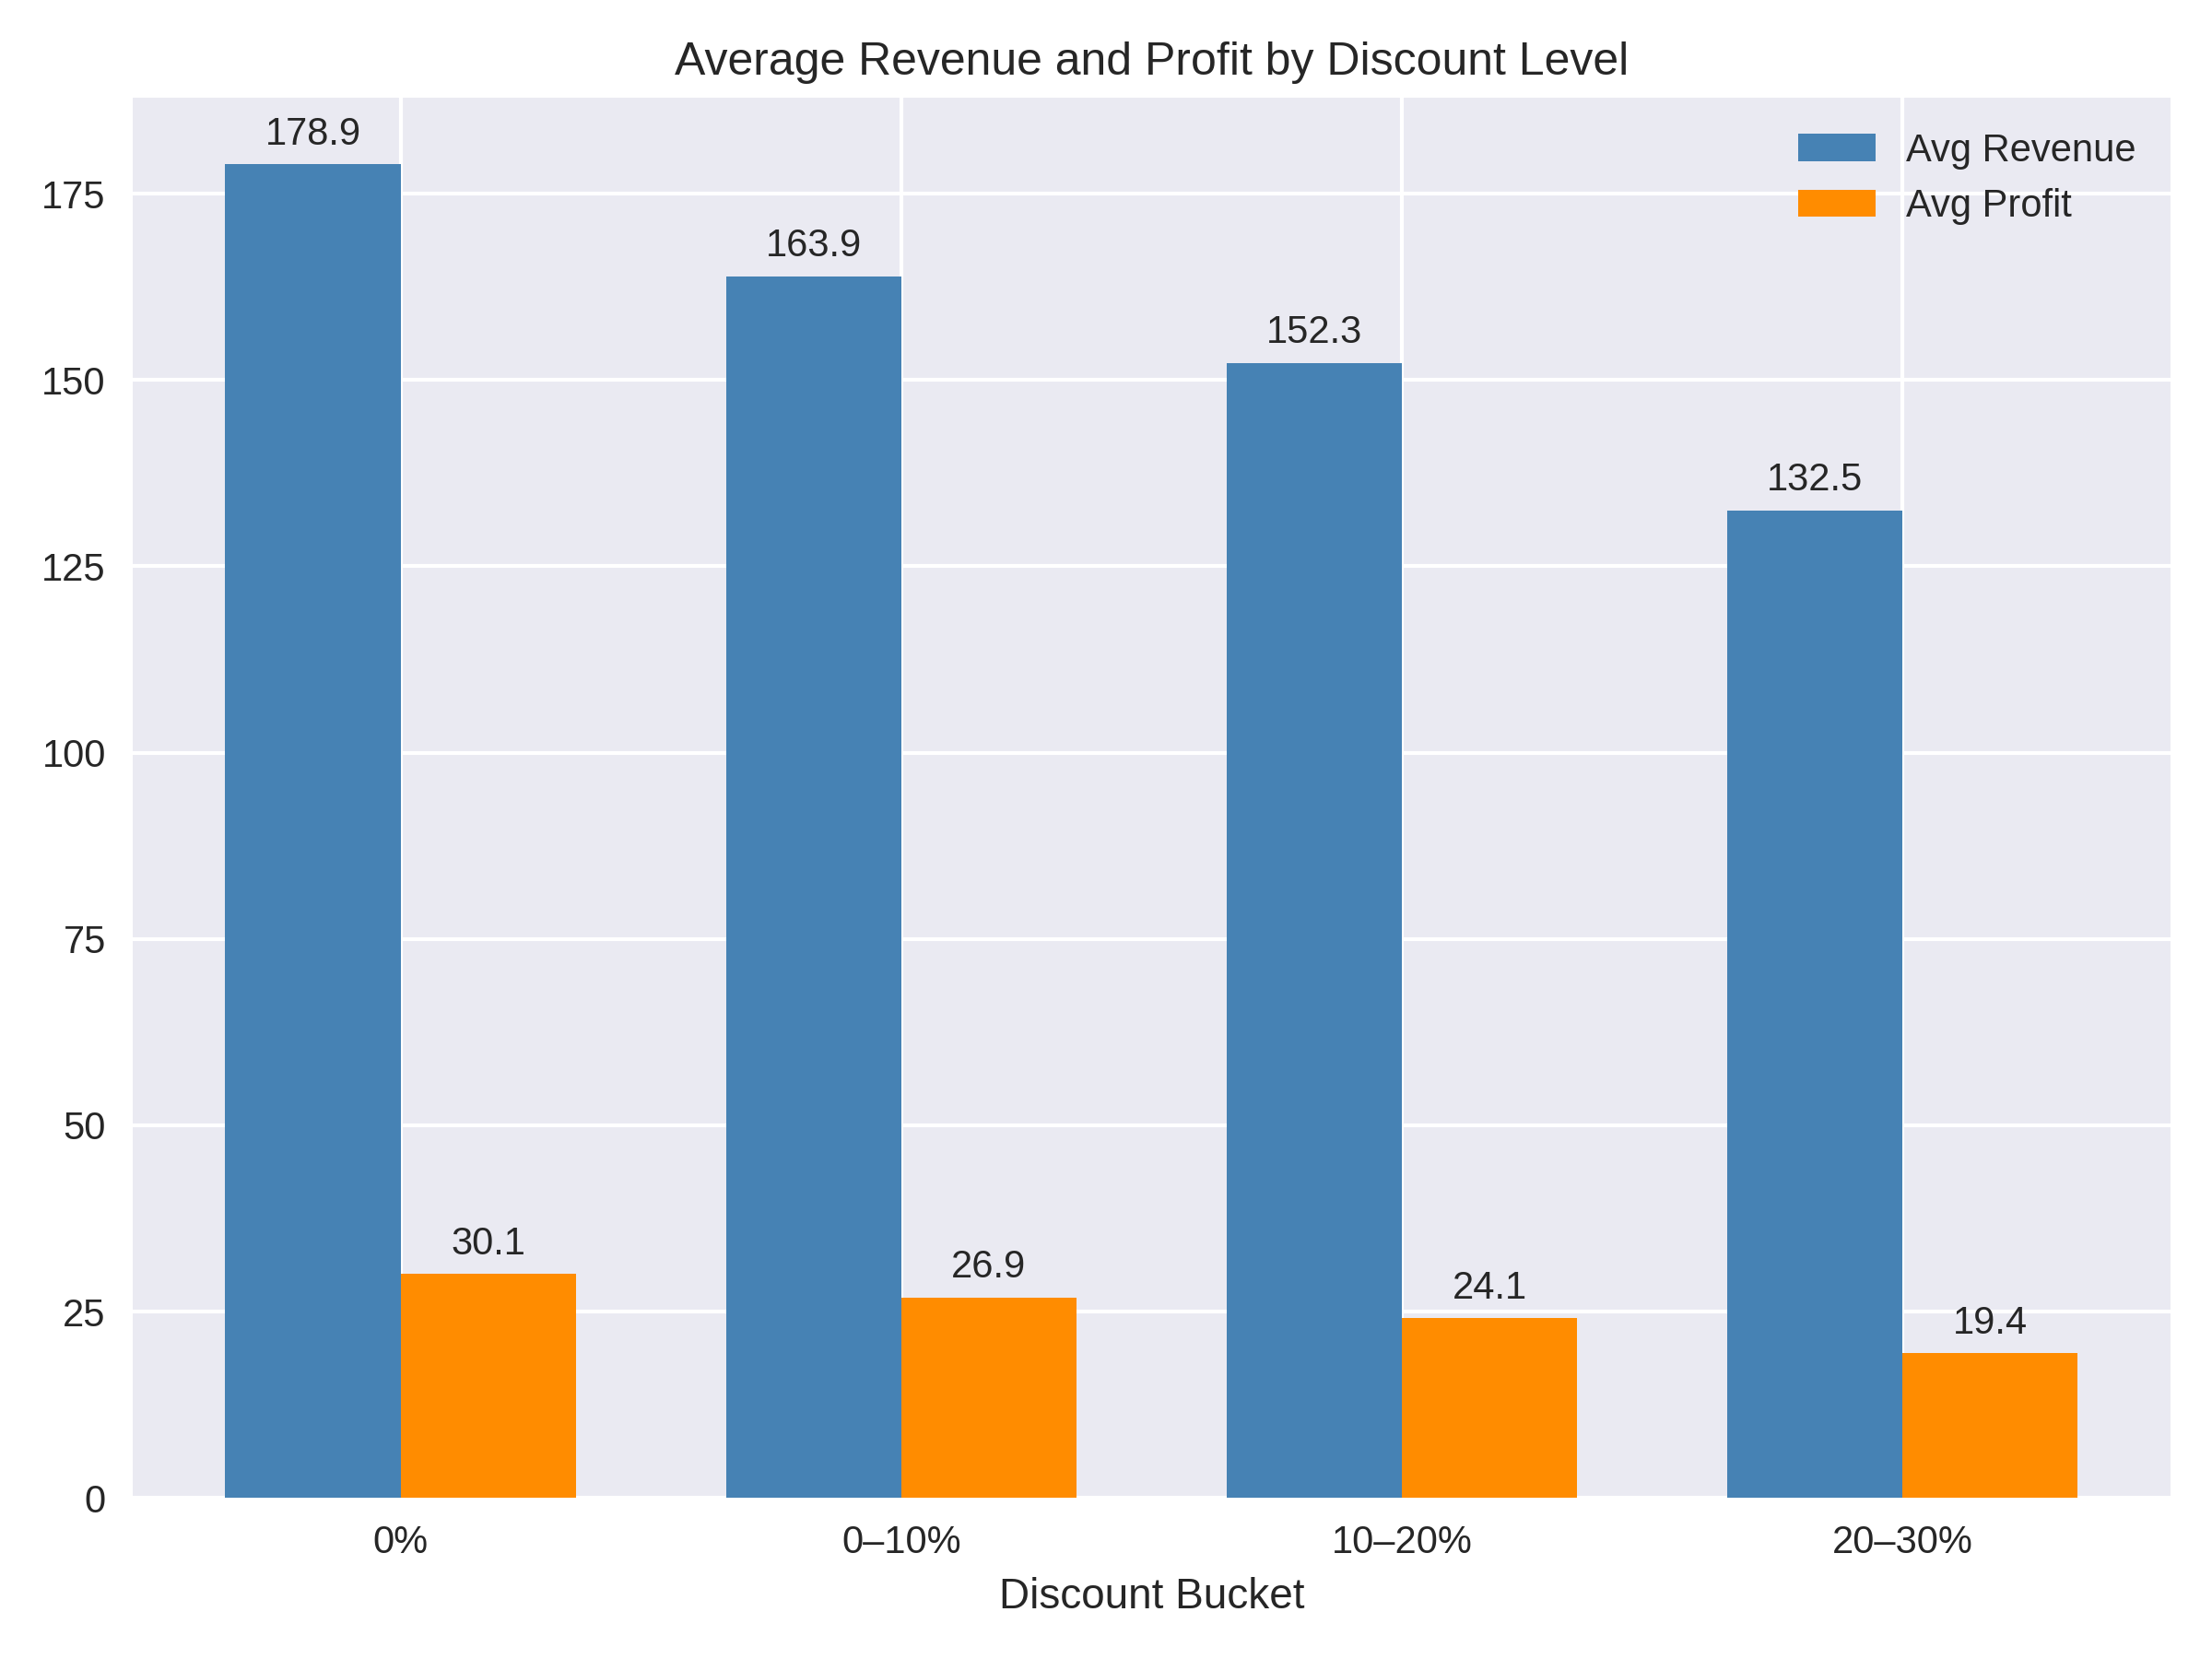
The dataset used for this analysis contains 34,500 retail and e-commerce transactions. It covers 17 fields that track orders, products, revenue, discounts, profit margins, returns, and delivery times. This gives a detailed record of both financial outcomes and operational processes.
Customer demographics, such as age and gender, along with product category information, were also included. These details make it possible to segment results and understand how different groups or product types contribute to performance.
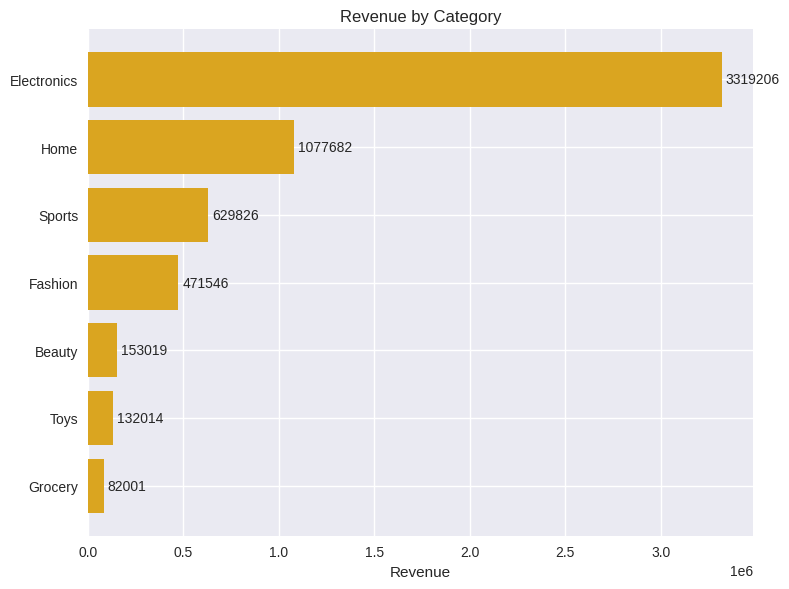
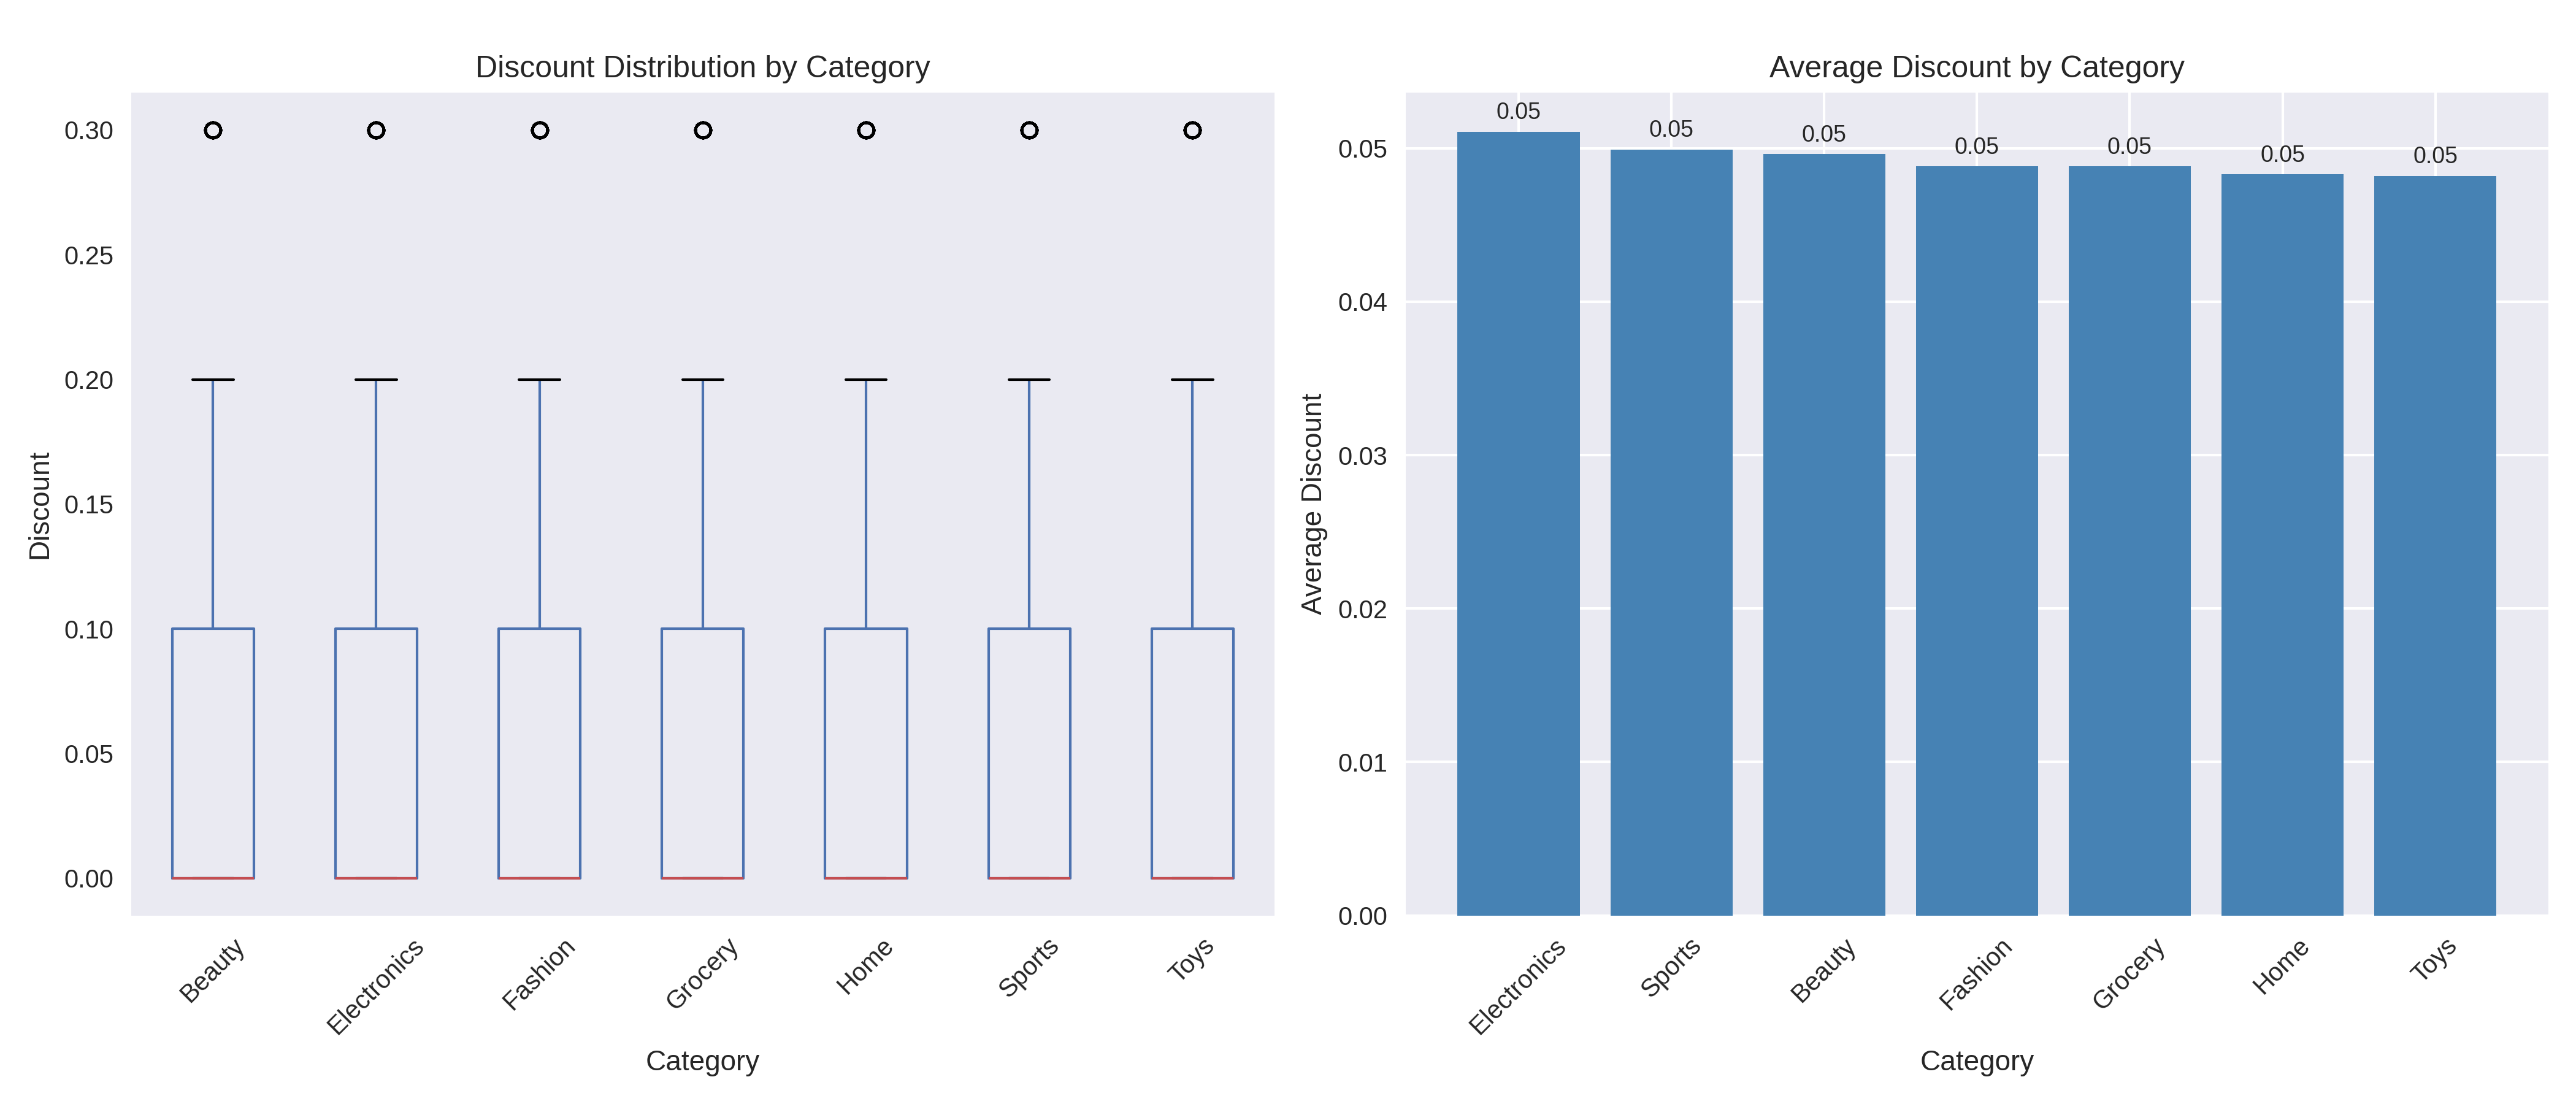
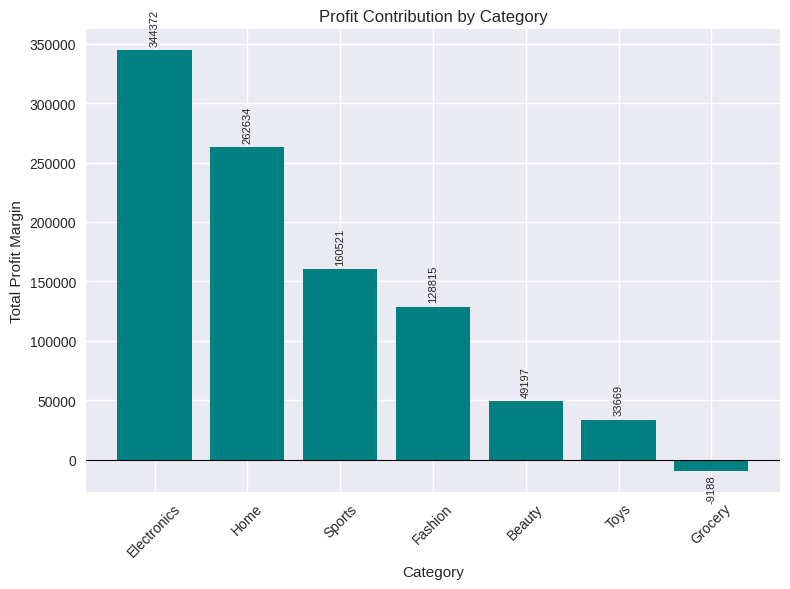
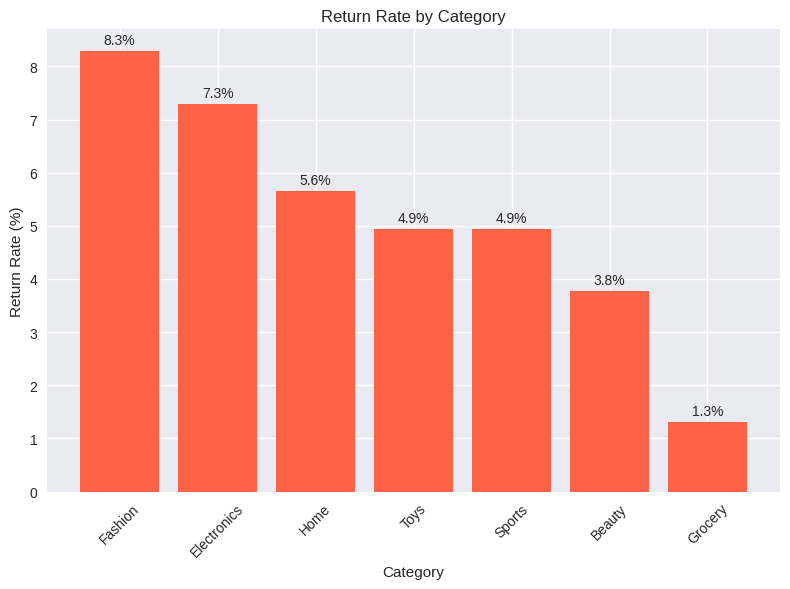
By combining financial, operational, and demographic data, the dataset provides a full picture of store performance. It allows us to measure revenue drivers, evaluate the effect of discounts on profit, and identify where issues such as high return rates or delivery delays impact results.
Q1. Which categories bring in the most revenue for the store?
Electronics is the clear leader, generating over RM3.3 million in revenue – nearly three times more than the next category, Home, at RM1.1 million. Sports follows with around RM630k, while Fashion brings in about RM470k. Beauty, Toys, and Grocery contribute far less, with Grocery at the bottom at only RM82k.
This shows Electronics is the backbone of store sales and should be given priority in stock, promotions, and shelf space. Home, Sports, and Fashion contribute meaningfully but are secondary, so investment here should be more selective. Smaller categories add little revenue and should either be repositioned or promoted differently to justify their place.
Q2. Where are we giving the highest discounts, and are they concentrated in certain categories?
Discounting is spread evenly, with most categories averaging about 5%. Occasionally, deeper discounts of up to 30% appear, but these occur across all product types rather than being targeted at specific categories.
Because markdowns are applied broadly, the store is not using discounts strategically. Management could protect margins by reducing discounts in strong categories like Electronics while focusing promotions on weaker ones such as Grocery or Toys. This shift would stimulate sales where it is needed most without cutting into already profitable lines.
Q3. Which categories contribute the largest share of total profit, not just sales?
Electronics again leads with RM344k in profit, followed by Home at RM263k. Sports adds RM161k and Fashion RM129k, while Beauty and Toys make smaller contributions of RM49k and RM33k. Grocery, however, records a loss of RM9k.
This means Electronics and Home are true cash cows, worth prioritizing in promotions and stock. Sports and Fashion remain solid but secondary contributors. Beauty and Toys add little financial value and should be reviewed for their strategic role, while Grocery is a drain on profitability and needs urgent attention.
Q4. Which categories have the highest return rates, causing waste and extra costs?
Fashion has the highest return rate at 8.3%, with Electronics close behind at 7.3%. Home records 5.6%, while Toys and Sports sit around 4.9%. Beauty has a lower return rate of 3.8%, and Grocery is the lowest at just 1.3%.
Returns in Fashion and Electronics are the most damaging because they involve the store's biggest revenue drivers. Addressing size issues in Fashion and product quality in Electronics could reduce waste and improve profitability. Lessons from low-return categories like Grocery and Beauty could help improve performance in the problem areas.
Q5. Which categories suffer from delivery delays, and how often?
Fashion and Electronics record the highest delivery delays, with nearly 1,750 and 1,650 delayed orders. Home also struggles with about 1,430 delays. Smaller categories like Beauty, Sports, Grocery, and Toys see fewer issues but still average around 1,000 delays each.
Since Fashion, Electronics, and Home are also among the biggest profit contributors, delays here risk damaging customer satisfaction the most. Fixing logistics for these categories should be the top priority, while smaller categories can be managed with existing resources.
Q6. When we give a higher discount, do we actually sell more or not?
Orders without discounts generate the highest average revenue per order at RM178.9. As discounts rise, revenue per order drops to RM163.9 at 0–10%, RM152.3 at 10–20%, and RM132.5 at 20–30%.
This shows higher discounts reduce customer spending rather than increasing it. Management should rethink blanket markdowns and instead test targeted promotions such as bundles or loyalty offers, which give customers value without undermining revenue.
Q7. Do bigger discounts improve profit or do they just shrink our margins?
Profit margins shrink as discounts increase. Non-discounted orders average 30.1, while margins fall to 26.9 at 0–10%, 24.1 at 10–20%, and just 19.4 at 20–30%. The store average is 25.1, which means only full-price orders perform above this benchmark.
The more the store discounts, the less it earns per sale. To protect profitability, discounts should be kept modest, ideally under 10%. Alternatives like bundling or upselling can create customer value without cutting margins so deeply.
Q8. Which discount levels actually work best for sales and profit?
The best performance comes from no discounts or modest ones up to 10%. At these levels, both revenue and profit margins remain healthy, with non-discounted orders leading in both. Beyond 10%, results fall sharply, with the weakest performance at 20–30%.
This means moderate discounting can support sales without hurting profit, but heavy discounting is harmful. Management should avoid frequent markdowns above 20%, as they reduce both sales value and profitability.
Q9. Which discount levels are actually losing money for the store?
All discount levels remain profitable in absolute terms, but margins decline sharply beyond 20%. With no discounts, margins average 30.1, while at 20–30% discounts margins drop to 19.4.
Although the store is not losing money outright, deep discounts leave little profit and are unsustainable. Management should limit discounts to 0–10% where possible and avoid frequent heavy markdowns to protect long-term profitability.
Q10. Which categories are our cash cows (steady revenue, high profit, low issues)?
Electronics stands out as the most reliable growth driver, with the highest revenue and profit and little reliance on discounts. It consistently delivers strong results and secures the store's financial stability.
Because of this strength, Electronics should remain a top priority in stock, promotions, and service. Protecting and growing this category ensures the store maintains its financial backbone.
Q11. Which categories are discount-dependent (only sell well with heavy markdowns)?
Home, Sports, Fashion, Beauty, and Toys rely more on discounts to generate sales. They deliver decent revenue and profit, but only when markdowns are applied.
This dependency means promotions must be managed carefully. Smarter strategies such as limited-time deals or bundling could protect sales volume while reducing the hit to margins.
Q12. Which categories are problematic (high returns, frequent delivery issues, low profit)?
Grocery and Fashion are the most problematic. Grocery operates at a loss, while Fashion faces high returns and frequent delivery delays. Both bring challenges that reduce profitability.
Management must decide whether to fix these categories by addressing suppliers, quality control, and logistics, or reduce their role in the store. Scaling down may be the best option if the costs of fixing outweigh the benefits.
Q13. How can we group categories to decide where to invest more resources and where to cut back?
Electronics is the clear cash cow and should be protected and grown further. Home, Sports, Fashion, Beauty, and Toys fall into the discount-driven group, requiring careful control of promotions. Grocery and Fashion are problematic and demand urgent review.
This clustering provides a roadmap for management: invest more in Electronics, optimize discounting in mid-tier categories, and fix or scale down underperforming ones. This ensures resources are focused where they bring the greatest returns.
Conclusion
This analysis shows that Electronics and Home are the store's strongest profit drivers and should be prioritized in stock, promotions, and space allocation. In contrast, Grocery and Fashion bring losses, high returns, or delivery delays and need urgent review or a shift in strategy. Sports contributes steadily but at a smaller scale, while Beauty and Toys remain minor categories that require a clearer role before further investment.
On pricing and operations, the findings confirm that heavy discounts above 10% hurt both sales and margins, while modest discounts of 0–10% are far more effective. At the same time, high return rates and delivery delays in Fashion, Electronics, and Home highlight where supply chain and quality improvements are most urgent. Focusing resources on profitable categories, limiting deep discounts, and fixing operational bottlenecks will protect margins, improve customer trust, and ensure growth is sustainable.