Which cheap dividend stocks are actually worth buying.Illustration · Data Stories Lab
Investing & screening
Cheap Stocks Worth Exploring
Find cheap stocks that pay safe dividends
Data Stories LabAnalyst reportUnder-RM1 stocks · scorecard
Cheap shares are tempting. A stock under RM1 feels affordable, and when it also shows a fat dividend yield, it looks like easy passive income. The problem is that a low price and a big advertised yield tell you almost nothing about whether the company can keep paying. Some of these payouts are funded by real cash the business earns; others are propped up by borrowing or by running down reserves, and those dividends get cut the moment money gets tight. This report screens every Bursa Malaysia stock priced below RM1 to separate the dividends that are real from the ones that are not.
It is written for the value-and-income retail investor: someone with a limited budget who wants reliable dividend income, not a gamble, and who wants the verdict first without wading through jargon. The goal is simple and practical: take a long list of cheap stocks, score each one on five things that matter, run a hard cash test on every dividend, and hand back a short buy, wait, or skip list with how many shares to buy on a modest budget.
The one-line finding. Of 98 cheap stocks, only 10 are buys. The single most useful test is not the price or the yield; it is whether free cash flow covers the dividend. That one test alone flags 6 dividend payers as value traps, including names that pass an ordinary price-and-earnings screen.
The numbers
98
cheap stocks
4
perfect scores
10
rated BUY
17 / 23
dividends covered
“Strip away the affordability and the headline yields, and the under-RM1 universe comes down to ten genuine buys.”
What the data shows
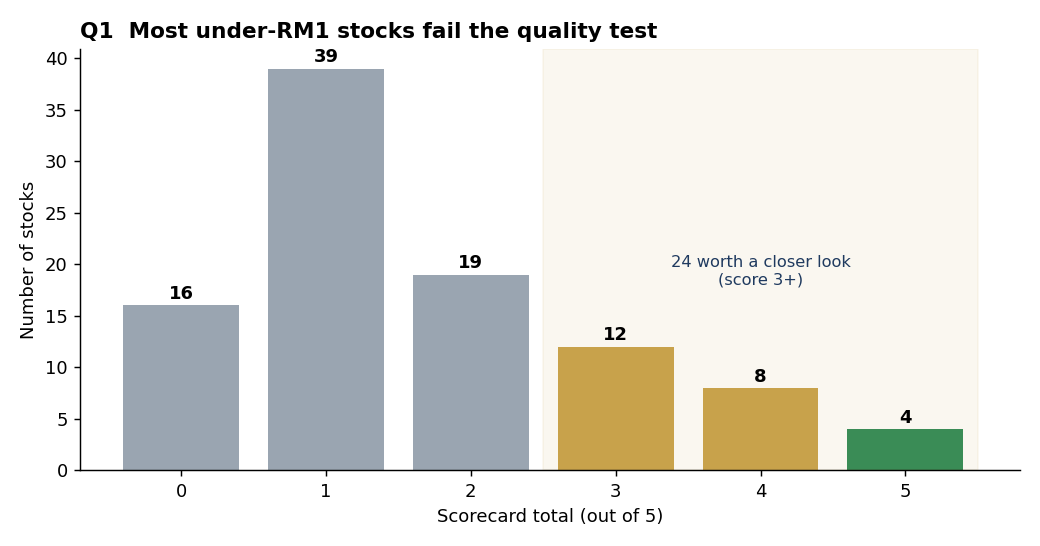
1. Out of all the under-RM1 stocks, how many are actually worth a closer look?
Most of them are not. Out of 98 cheap stocks, only 24 score 3 or better on the five-point scorecard, just 12 score 4 or more, and only 4 are perfect. The other 74 fail on the basics: they lose money, carry no asset backing, are priced too richly for what they earn, pay no safe dividend, or barely trade. Affordability is not the same as quality, and the chart below shows how steeply the universe thins out once you ask for real substance.
The business takeaway is that a cheap-stock list is mostly noise. Screening is not about finding reasons to buy; it is about clearing away the roughly three-quarters that should never reach your shortlist so your attention goes only to the handful that earn it.
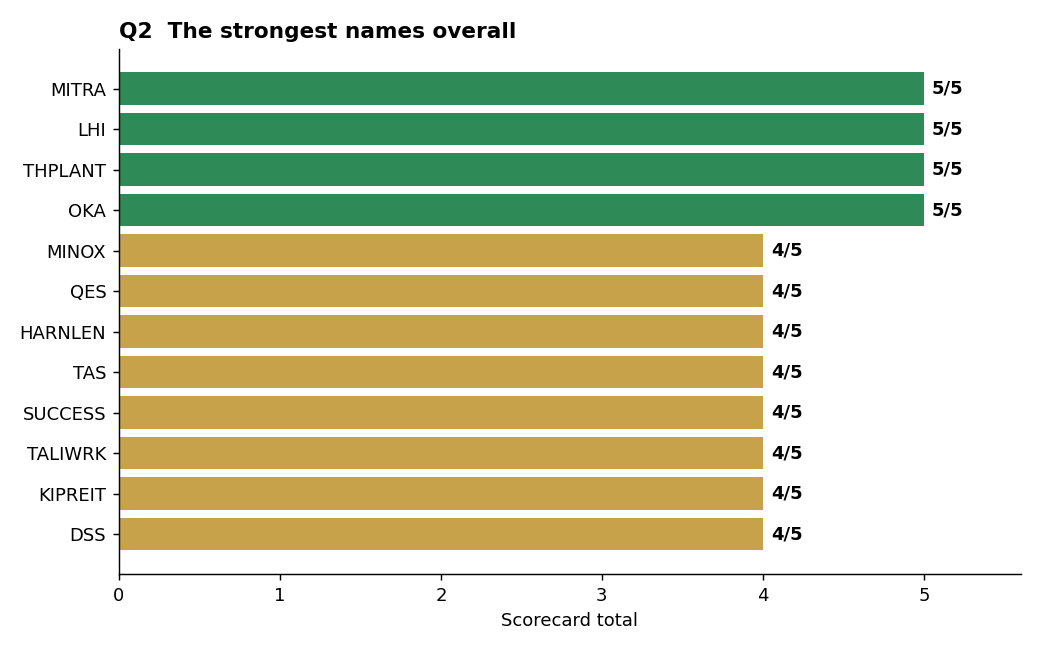
2. Among those, which ones are the strongest overall?
Four names clear every hurdle: MITRA, LHI, THPLANT and OKA each score a perfect 5 out of 5. They are profitable, asset-backed, fairly priced, liquid, and they pay a dividend that their cash actually covers. A second tier of six (MINOX, QES, TAS, SUCCESS, TALIWRK and KIPREIT) scores 4 out of 5, usually slipping on valuation, where the price has run a little ahead of earnings or book value.
For a time-poor investor, this is the whole point of the exercise: a 98-stock universe collapses to about ten names worth real research. The recommendation is to treat the perfect-scorers as the core of an income shortlist and the 4-out-of-5 names as the next layer, checking the one dimension each of them missed before committing.
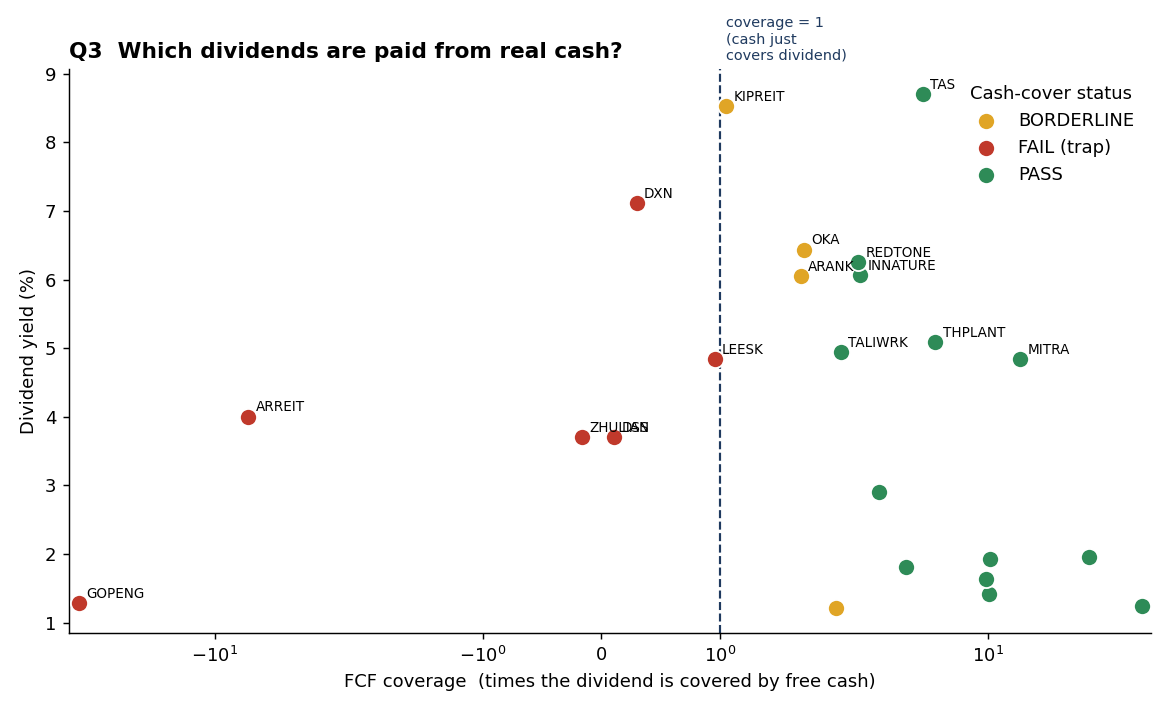
3. Which dividends are paid from real cash, and which might not last?
This is where the cheap-and-juicy trap shows itself. Of 23 stocks paying a dividend, 17 cover it comfortably from free cash flow, but 6 do not. The worst offenders advertise yields of 4% to 7% while their cash coverage sits well below 1, meaning the company is paying out more than it generates and funding the rest from elsewhere. DXN pays 7.1% on coverage of just 0.30; DSS pays 3.7% on coverage of 0.11; ARREIT and ZHULIAN are paying dividends while free cash flow is outright negative.
The implication for income investors is blunt: yield is a promise, coverage is the proof. A high yield with thin coverage is not a bargain; it is a dividend cut waiting to happen. Several of these traps even pass an ordinary price-and-earnings screen, which is exactly why the cash-cover test is the heart of this report rather than an afterthought. The rule to carry forward: never buy a dividend whose free-cash-flow coverage is below 1.
Value trap
Sector
Yield
FCF coverage
Payout ratio
DXN
Consumer Defensive
7.1%
0.30x
64%
LEESK
Consumer Cyclical
4.8%
0.95x
112%
ARREIT
Real Estate
4.0%
-6.95x
98%
ZHULIAN
Consumer Cyclical
3.7%
-0.16x
180%
DSS
Consumer Cyclical
3.7%
0.11x
47%
GOPENG
Consumer Defensive
1.3%
-43.19x
17%
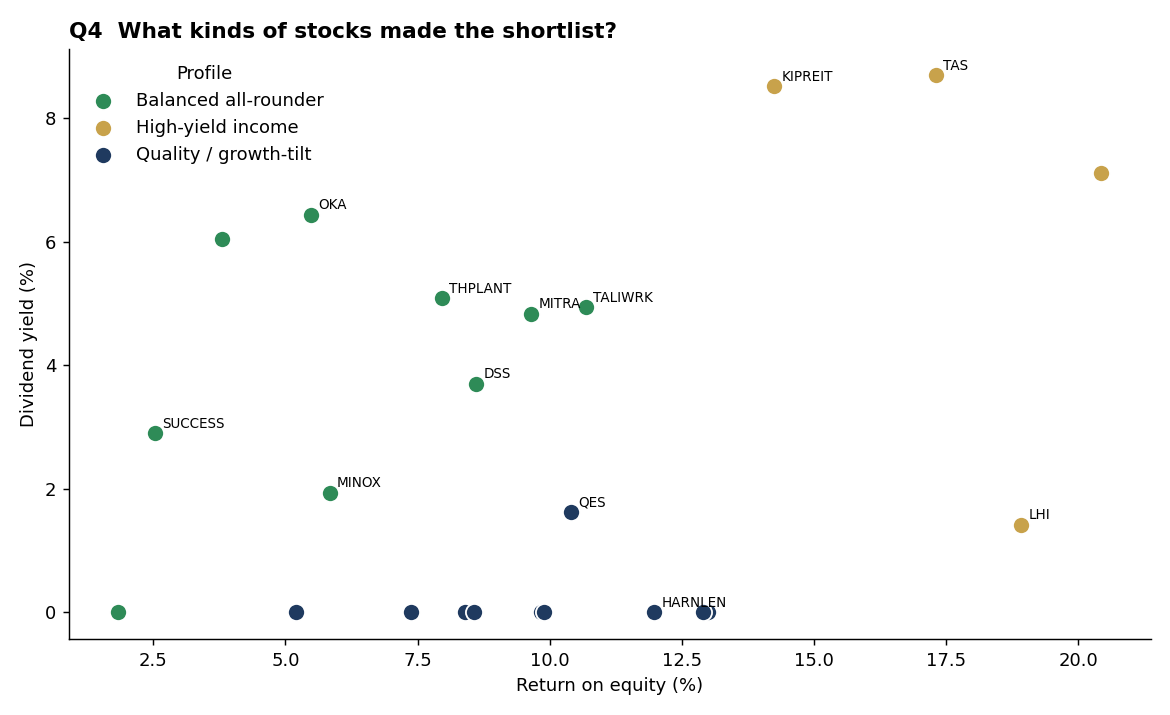
4. What kinds of stocks made the shortlist?
The shortlist is not one type of stock; it splits into three profiles. The first is the high-yield income group: strong payers yielding around 6% with healthy returns on equity, the natural core for someone who wants cash now. The second is the balanced all-rounder group: moderate yields near 4% but with very deep cash coverage, the safest sleep-at-night holdings. The third is a no-income, growth-or-recovery group: profitable enough to score well but paying little or no dividend, so they suit growth, not income.
This matters because it turns a flat ranking into a portfolio decision. An income investor should anchor on the first two profiles and treat the third as optional. The recommendation is to blend high-yield names for cash with deep-coverage names for safety, rather than chasing the single highest number on the page.
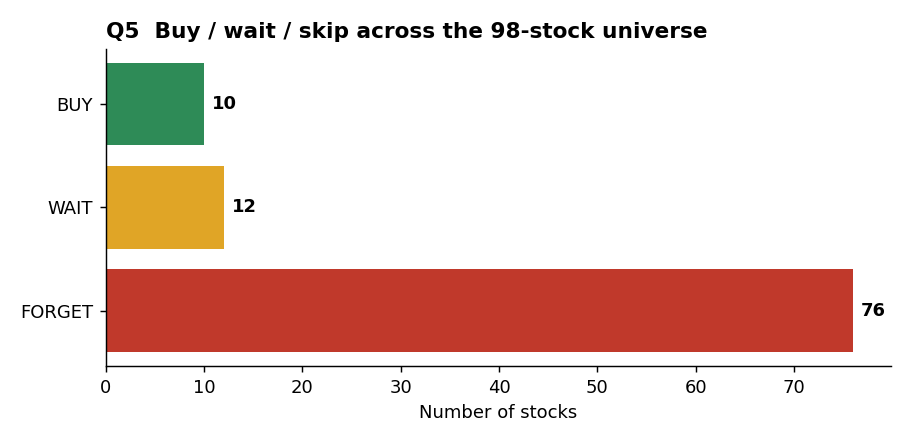
5. Which should you buy now, which to wait on, which to skip?
The verdict across the full universe is sobering and useful. Only 10 stocks rate BUY: they score 4 or 5 and pay a dividend their cash covers. Twelve rate WAIT: solid businesses that either pay no dividend yet or just miss the quality bar, worth watching for an entry. The remaining 76 rate FORGET, either too weak on the fundamentals or carrying a dividend the cash cannot support.
For the reader the message is liberating: you can ignore four out of five names on the list with a clear conscience. The recommendation is to act only on the 10 buys, keep the 12 waits on a watchlist for the next quarterly update, and never let a FORGET name back in just because its price fell further.
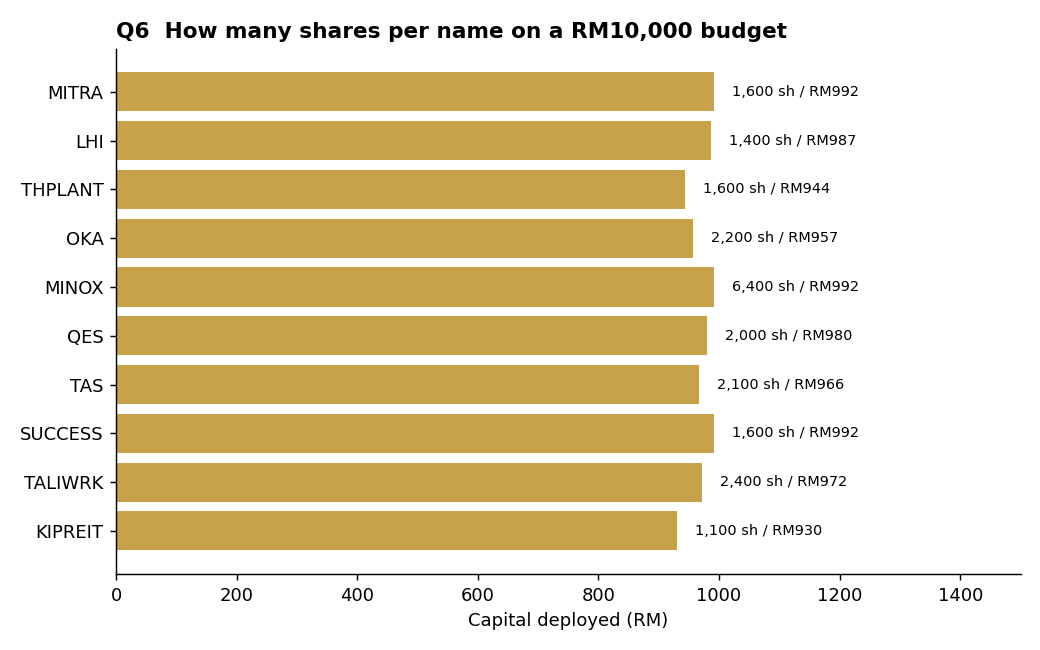
6. With your budget, how many shares of the top picks can you afford?
A modest budget goes a long way at these prices. Spreading RM10,000 evenly across the 10 buys (about RM1,000 each, rounded to Bursa's 100-share lots) deploys RM9,712 and builds a diversified income basket in a single pass. Because every name trades below RM1, the same budget that buys a few hundred shares of a blue chip here buys thousands of shares across ten dividend payers.
The practical recommendation is equal-weighting for simplicity, then tilting toward the perfect-scorers (MITRA, LHI, THPLANT, OKA) if you prefer concentration over spread. The table gives the exact lot sizes; adjust the RM10,000 figure to your own budget and the proportions hold.
#
Buy
Price
Score
Yield
Coverage
Shares
Cost
1
MITRA
RM0.620
5/5
4.8%
14.1x
1,600
RM992
2
LHI
RM0.705
5/5
1.4%
10.1x
1,400
RM987
3
THPLANT
RM0.590
5/5
5.1%
5.7x
1,600
RM944
4
OKA
RM0.435
5/5
6.4%
1.7x
2,200
RM957
5
MINOX
RM0.155
4/5
1.9%
10.2x
6,400
RM992
6
QES
RM0.490
4/5
1.6%
9.8x
2,000
RM980
7
TAS
RM0.460
4/5
8.7%
5.0x
2,100
RM966
8
SUCCESS
RM0.620
4/5
2.9%
3.1x
1,600
RM992
9
TALIWRK
RM0.405
4/5
4.9%
2.0x
2,400
RM972
10
KIPREIT
RM0.845
4/5
8.5%
1.1x
1,100
RM930
Method & data
We screened all Bursa Malaysia stocks priced below RM1, a snapshot of 100 listings. Two non-stock rows (an unlisted fund and a malformed record) were quarantined, leaving 98 clean names. Each stock was scored on five dimensions, one point each: profitability (earnings per share at least 0.01 and return on equity at least 5%); financial backing (net tangible assets at least RM0.20 per share and positive free cash flow); valuation (price-to-earnings between 4 and 15, price-to-book below 1.5, price-to-sales below 2); cash flow and dividend safety (dividend yield at least 1%, free-cash-flow coverage at least 1, payout ratio at most 100%); and liquidity and size (trading volume at least 50,000 shares and market value at least RM50 million).
The deciding test is free-cash-flow coverage, the free cash flow divided by the dividend paid. A reading of 1 means cash exactly covers the dividend; below 1 means the payout is not funded by the business's own cash, which marks a value trap. The verdict logic follows from the score and this test: BUY is a score of 4 or 5 with a covered dividend, WAIT is a score of 3 or more but no covered dividend yet, and FORGET is a value trap or a score of 2 or less. Two yardstick dimensions, business moat and management quality, cannot be judged from a screener snapshot and are left out of the score; they are the recommended next step for any name on the buy list. Figures are a point-in-time snapshot and are not investment advice; always confirm against the latest filings before buying.
Conclusion
Strip away the affordability and the headline yields, and the under-RM1 universe comes down to ten genuine buys. The four to lead with are MITRA, LHI, THPLANT and OKA: perfect five-out-of-five scorers that are profitable, asset-backed, sensibly priced, liquid, and paying dividends their free cash flow comfortably covers. Behind them sit six more solid buys (MINOX, QES, TAS, SUCCESS, TALIWRK, KIPREIT), each a notch lower only because the price has edged ahead of earnings or book value. On a RM10,000 budget, equal-weighting all ten builds a diversified, cash-covered income basket for under RM9,800.
The wait list holds twelve names worth watching for a better entry or a first dividend, and the remaining seventy-six are a skip. The discipline that produced this list is the one to keep: a cheap price and a big yield mean nothing on their own, and the deciding test every time is whether free cash flow covers the dividend. Six payers here fail that test despite tempting yields, and avoiding them matters more to a real return than picking the single highest yielder. Buy the ten, watch the twelve, and forget the rest.