
Know Your Reseller
Ranking Them by the Returns They Deliver
Overview
A Malaysian biscuit and cookie manufacturer sells through 635 independent resellers across 10 sales territories. Without a clear view of which partners are generating real returns, commercial resources — discounts, account support, and management time — get directed at the wrong relationships. This analysis uses 26 months of transaction data to identify which resellers are worth investing in, which need follow-up, and which should be wound down, based on gross margin contribution, purchasing behaviour, and activity trend.
Data Sources and Methodology
We analysed a transaction-level sales dataset from a Malaysian biscuit and cookie manufacturer, covering 60,855 reseller orders across 635 independent distribution partners and 10 sales territories between July 2017 and September 2019. Our analysis focused on gross margin contribution, order frequency and recency, and discount allocation per reseller. We applied descriptive aggregation to profile individual reseller performance, K-Means clustering to identify natural reseller segments, and monthly trend analysis to track gross margin movement over time. Our goal was to give the manufacturer a data-driven basis for deciding which reseller relationships to invest in, follow up on, or gradually exit.
Who Actually Contributes to the Manufacturer's Margin?
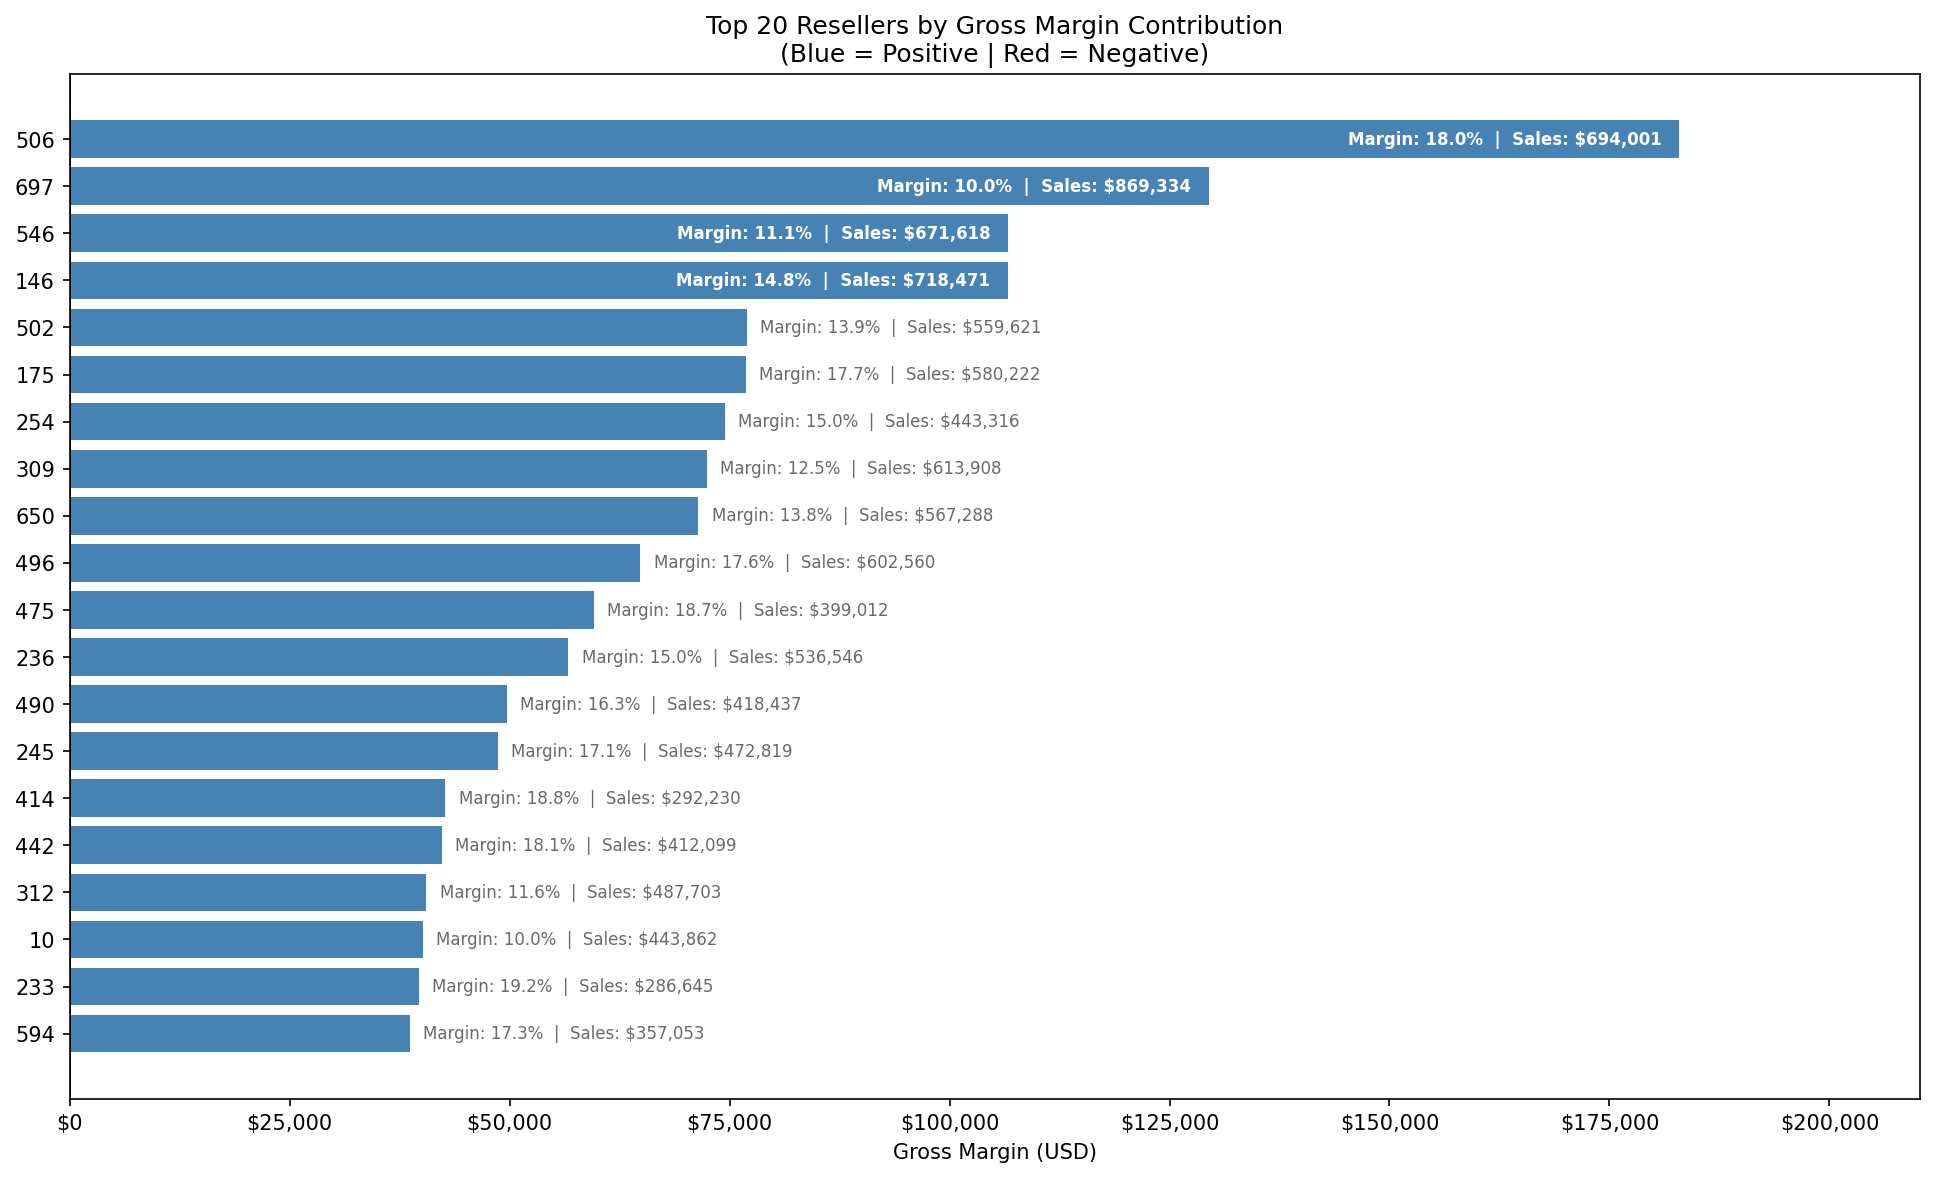
When resellers are ranked by gross margin rather than sales volume, the top performers look very different from the highest-revenue names on the list. Reseller 506 leads the network with $182,884 in gross margin at an 18% margin rate, followed by Reseller 697 at $129,468 — the only reseller among the top performers who also ranks highest in total revenue, making it the network's most well-rounded partner. Resellers 546 and 146 follow with approximately $107,000 each. High margin rates are also visible further down the list — Resellers 233 (19.2%) and 414 (18.8%) deliver excellent efficiency even at lower volumes.
The critical finding is that sales volume and margin do not move together. Many resellers generating hundreds of thousands in revenue are producing negative gross margins — meaning the manufacturer loses money on every transaction with them. These resellers do not appear in the margin ranking, and that is the point. The manufacturer should anchor all reseller decisions to margin performance, not revenue figures.
Are Discounts Going to the Right Resellers?
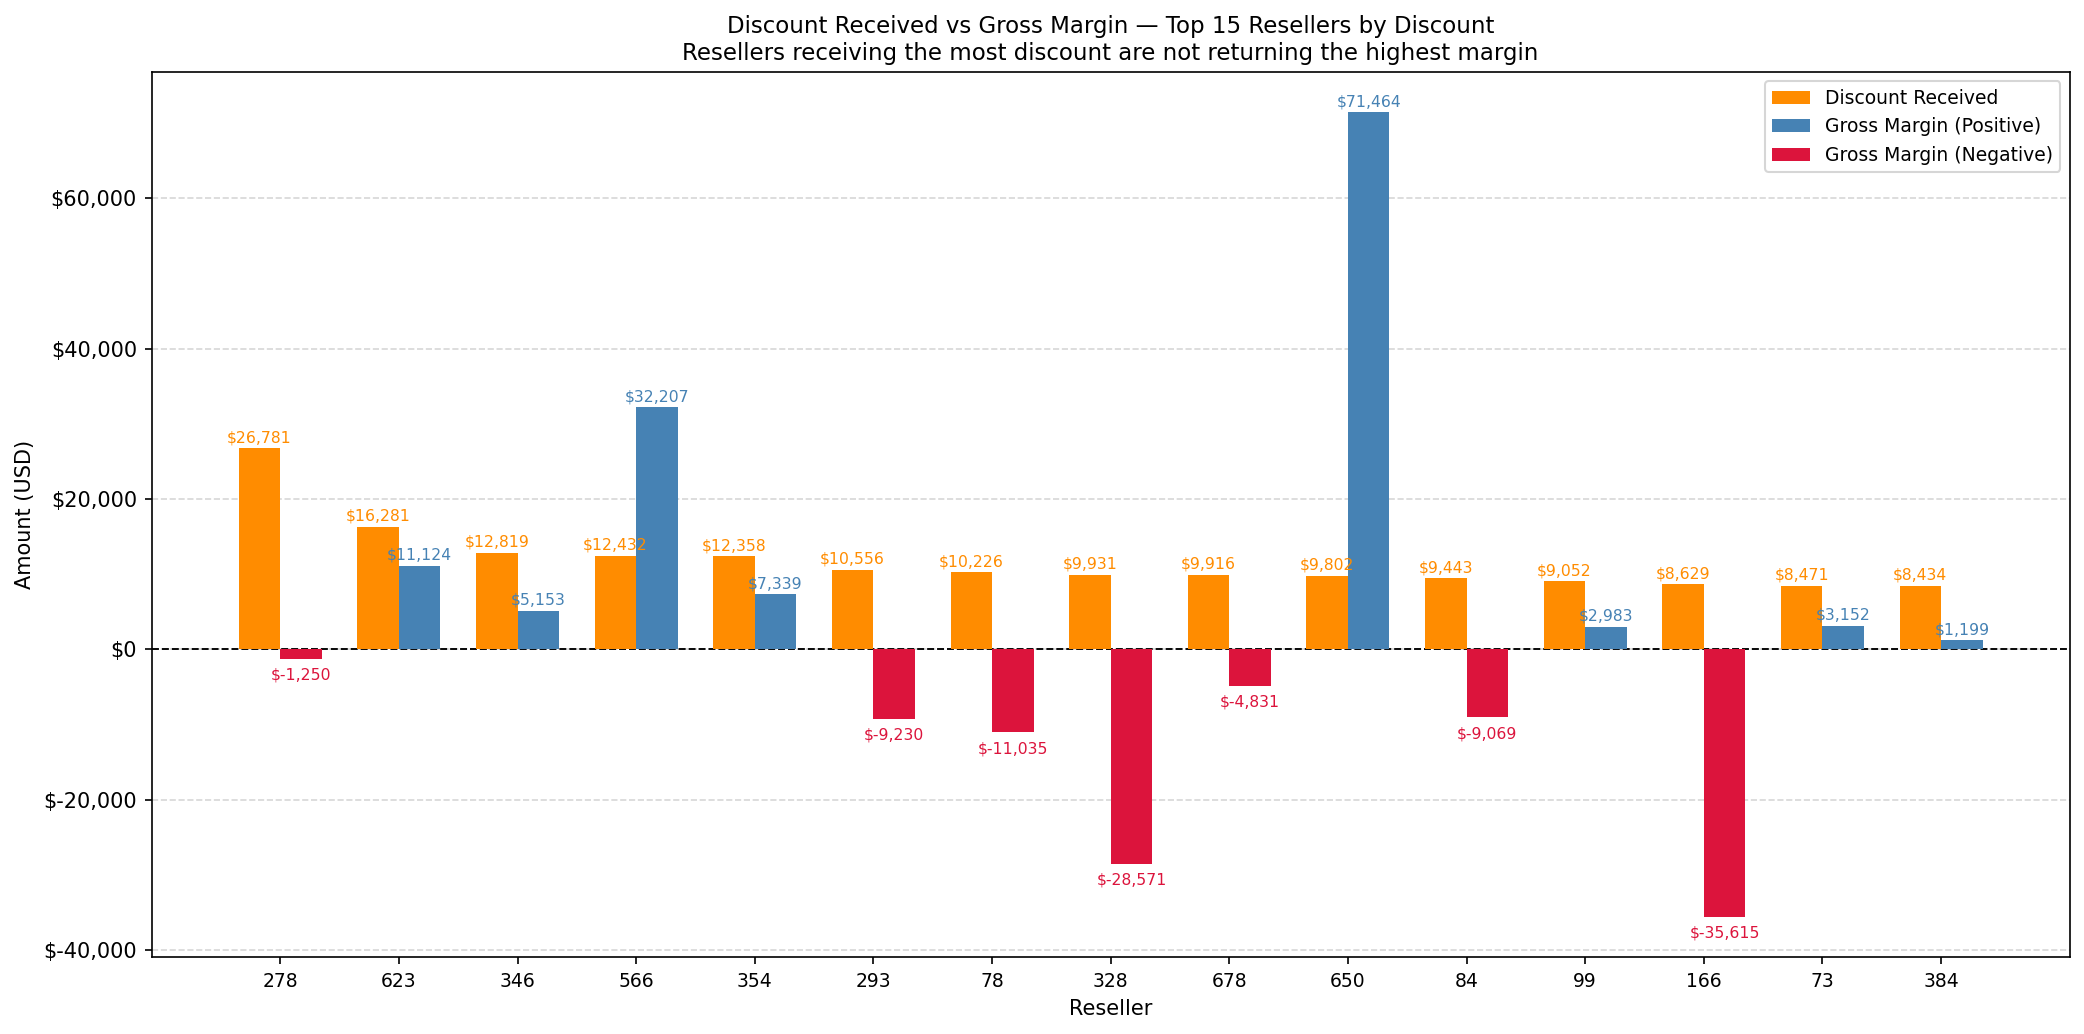
They are not. Reseller 278 received the highest discount in the network — $26,781 — and returned a gross margin of -$1,250. The manufacturer gave away the most and got back a loss. Across the top 15 discount recipients, more than half returned negative gross margins. Resellers 328 and 166 stand out as particularly costly: combined, they received approximately $18,500 in discount and returned over -$64,000 in gross margin.
The exception is Reseller 650 — it received $9,802 in discount and generated $71,464 in gross margin, the strongest return-on-discount in the group. Reseller 697, the network's most balanced partner, received a comparatively modest $7,773 in discount against $129,468 in margin. These two resellers show what efficient discount investment looks like. The manufacturer should redirect its discount budget toward this profile and away from high-discount, low-return partners immediately.
The manufacturer's discount budget is flowing in the wrong direction. The resellers receiving the most support are overwhelmingly generating negative returns, while high-margin partners receive comparatively modest discounts and continue to outperform. Reallocating even a portion of the discount currently given to loss-making resellers toward proven margin contributors would immediately improve profitability across the network.
How Does the Reseller Network Break Down by Behaviour and Return?
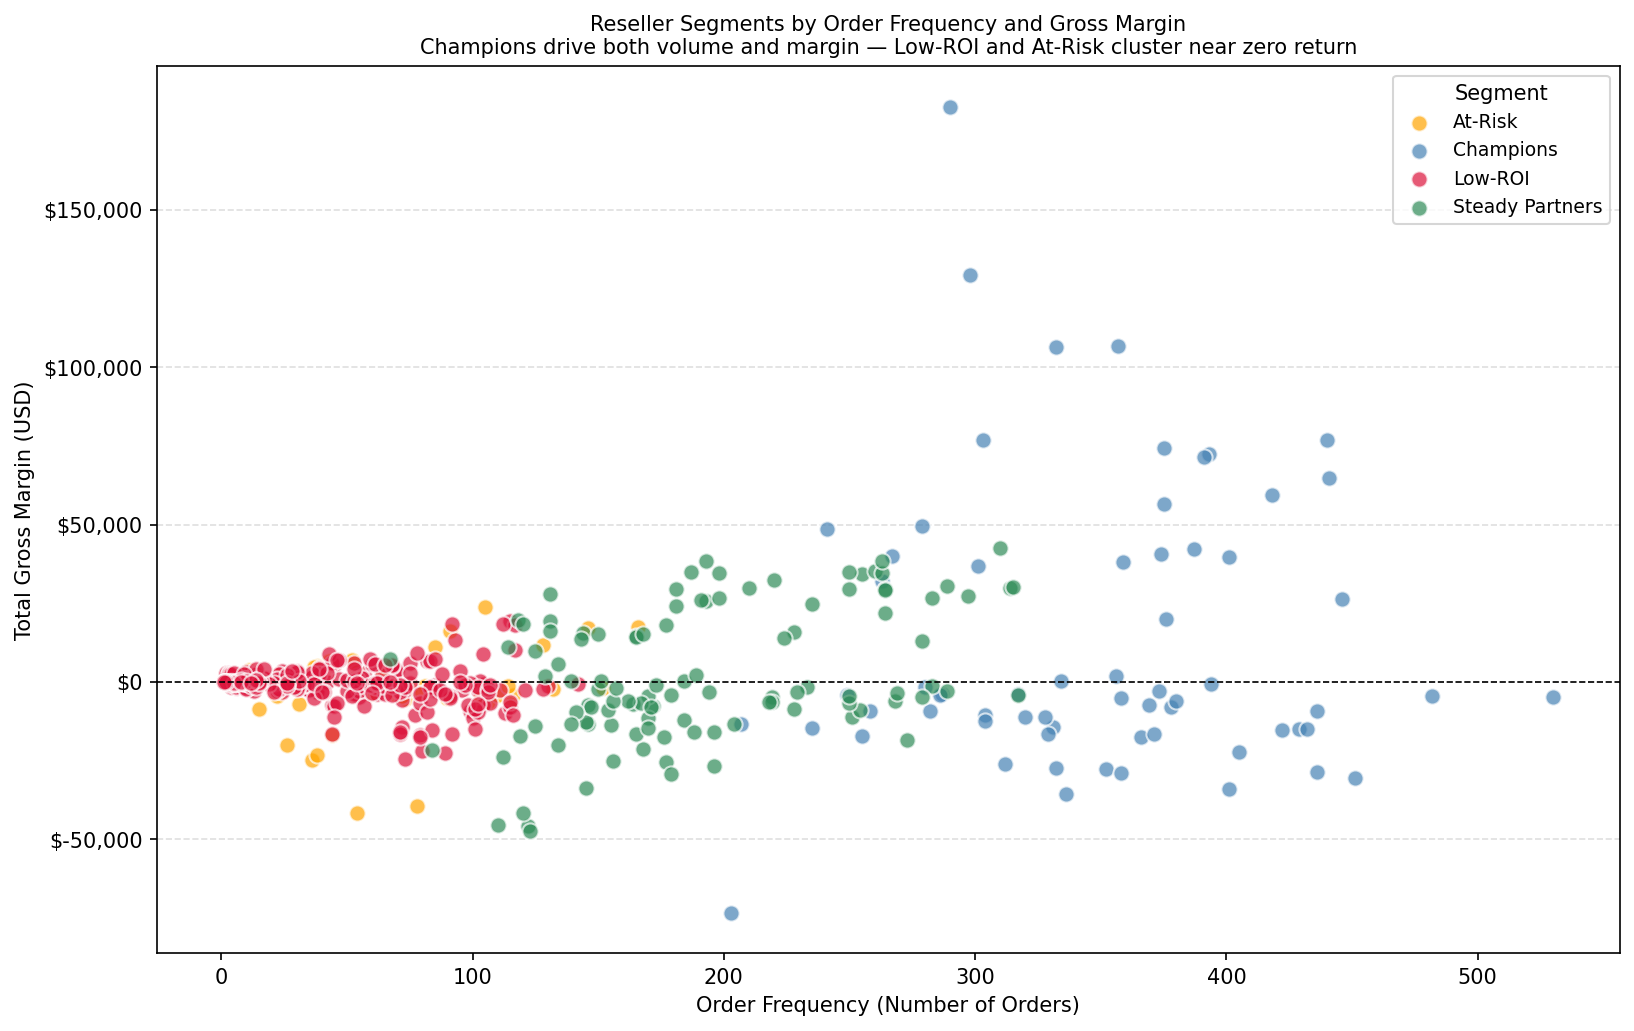
Four segments emerge from the data. Champions — 65 resellers, 10% of the network — generate the highest order volumes and the strongest positive gross margins. They are the manufacturer's most valuable distribution partners. However, some Champions also produce negative margins despite their volume, because the segmentation reflects purchasing behaviour rather than margin directly. Margin performance within this segment should be reviewed individually before any additional benefits are extended.
Steady Partners — 110 resellers, 17% — are consistent mid-tier contributors with mostly positive margins. They form the stable backbone of the network alongside Champions. At-Risk resellers (130 resellers, 20%) and Low-ROI resellers (330 resellers, 52%) both cluster near zero margin. At-Risk partners have not ordered in an average of 579 days and have effectively churned. Low-ROI partners still place occasional orders but at volumes too small to generate meaningful returns.
Together, the bottom two segments make up 72% of the reseller network while contributing almost nothing to the manufacturer's bottom line. The manufacturer is maintaining 460 reseller relationships at varying levels of cost and effort for returns that do not justify the investment.
Is the Margin Trend Improving or Declining Over Time?
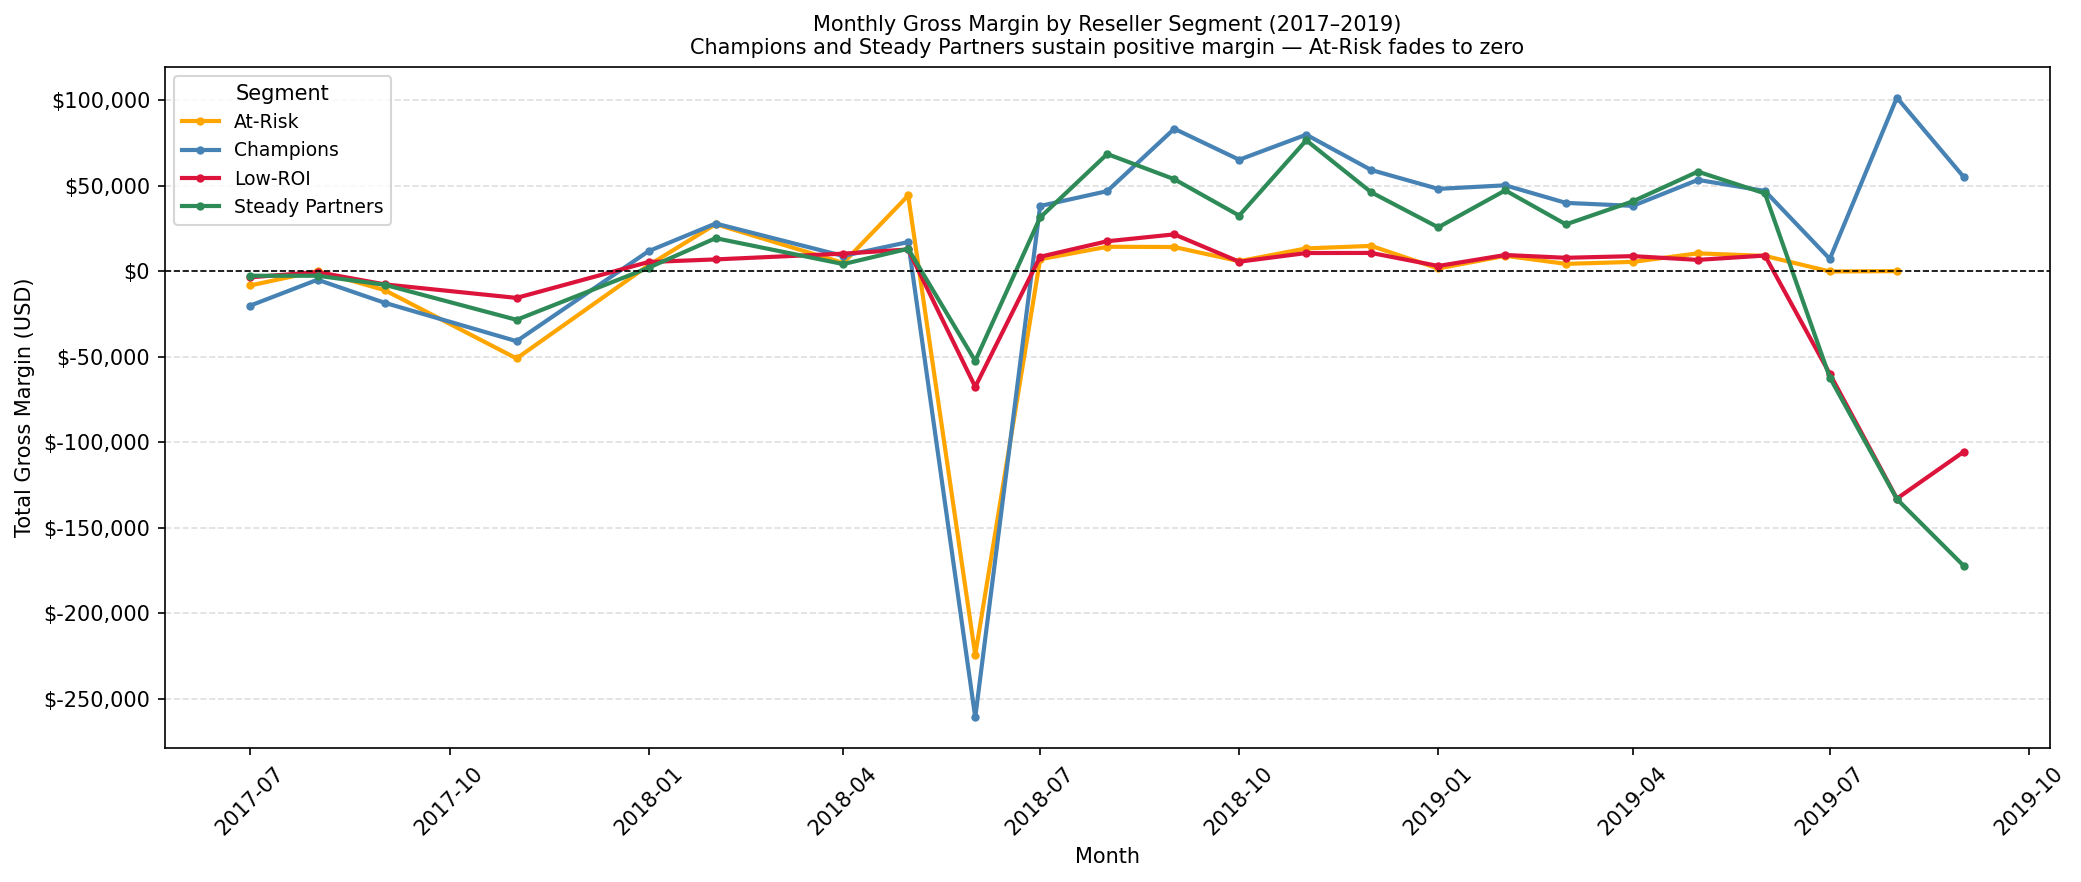
Champions and Steady Partners sustain positive monthly gross margins through most of the 26-month period, with Champions ranging between $30,000 and $100,000 per month. At-Risk resellers fade to zero by mid-2019, confirming their exit from the network in practice. Low-ROI resellers remain flat near zero throughout, never generating meaningful margin in either direction.
Two events in the trend require attention. In June 2018, all segments — including Champions — fell into deeply negative monthly gross margin, with Champions reaching approximately -$250,000 in a single month. This is the largest single-month margin loss in the dataset and likely reflects a batch of below-cost orders or bulk product returns. The manufacturer should identify the root cause, as it signals a structural vulnerability if conditions like this recur.
A second decline appears in August–September 2019, where Steady Partners move sharply into negative territory in the final reporting months. Whether this reflects seasonal patterns or an early signal of deterioration, it warrants close monitoring going into the next operating period.
Conclusion: Which Resellers to Invest In, Follow Up With, or Phase Out?
The analysis points to three clear actions. The manufacturer should concentrate its investment — better pricing terms, priority support, and structured loyalty incentives — on Champions and Steady Partners, the 175 resellers that consistently generate positive margins. Within Champions, individual margin performance should be reviewed to identify negative-margin outliers and address them before they are mistakenly rewarded. Discount allocation should be restructured immediately, redirecting support toward high-return partners like Resellers 650 and 697, and withdrawing it from the loss-making resellers currently absorbing the largest share.
For the 130 At-Risk resellers who have not ordered in nearly 20 months, the manufacturer should run a targeted re-engagement exercise. A small number may have paused for addressable reasons. For most, the relationship has already ended in practice and should be formally closed. The 330 Low-ROI resellers present a slower-moving but equally important challenge — still active, but not generating enough margin to justify the cost of maintaining each relationship. Setting a minimum performance threshold and applying it consistently over the next operating period will allow the manufacturer to concentrate its distribution network on the partners that actually drive the business forward.