Cover Image

Under the Kopi Lid

What the numbers reveal beneath the growth.

What We Found

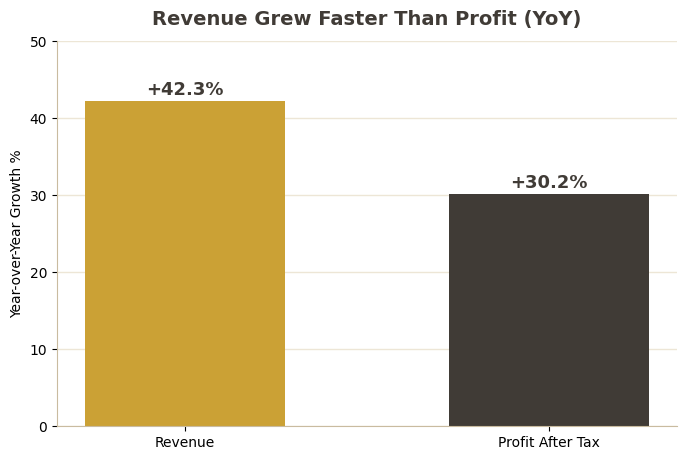
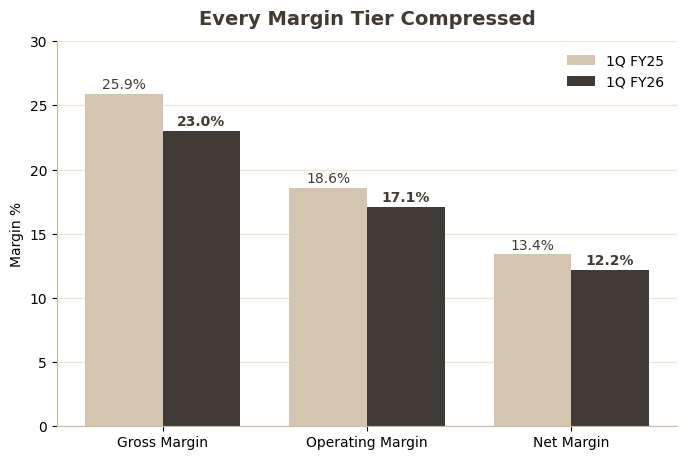
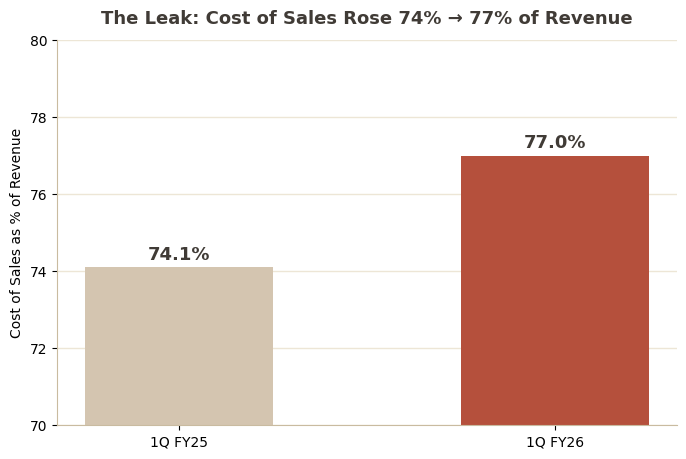
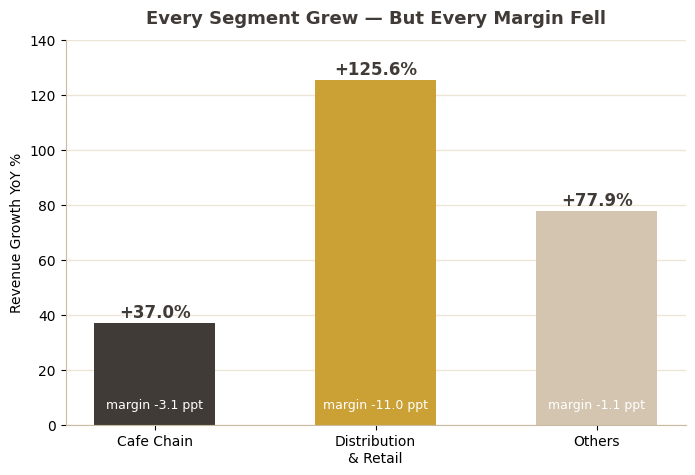
Oriental Kopi grew revenue 42% in 1Q FY2026. Lift the lid on the statement, though, and a second pattern sits beneath the headline: profit grew more slowly than revenue, and margins narrowed at every level. This case study walks through where, in the numbers, that happened, and leaves the why to those who know the business.

What's Behind the 42%?

Oriental Kopi Holdings Bhd is a Malaysian kopitiam café chain and packaged-food distributor listed on Bursa Malaysia. Its 1Q FY2026 report leads with a 42% jump in revenue. That number is the headline; this analysis is about what sits underneath it.

Reading the quarterly P&L three ways, each line as a share of revenue, each line against a year ago, and the picture by business segment, surfaces a pattern the headline alone doesn't show. The aim here isn't to grade the quarter, only to make what's under the lid visible.

1. The Result: growth, at two speeds

Chart 1 - Revenue Growth vs Profit Growth

Revenue rose 42.3% (RM97.8M to RM139.2M). Profit after tax rose too, but by less, up 30.2% (RM13.1M to RM17.0M). Both moved up; they didn't move together. The 12-point gap between the two growth rates is the first thread to pull.

2. The Margins: a shift at every level

Chart 2 - Margins FY25 vs FY26

Follow that thread to the margins and the same gap appears at every level of the statement. Gross margin moved from 25.9% to 23.0%, operating margin from 18.6% to 17.1%, and net margin from 13.4% to 12.2%.

The narrowing isn't isolated to one line near the bottom; it begins at the gross line and carries all the way down, which points to where in the statement the change starts.

3. Where the Margin Moved

Chart 3 - Cost of Sales as % of Revenue

Vertical analysis shows where it begins. Cost of sales took 74.1% of every revenue ringgit a year ago; this quarter it took 77.0%. It grew 47.8% while revenue grew 42.3%. That single shift accounts for almost the entire move in gross margin.

Operating expenses, by contrast, held roughly steady as a share of revenue. So the change sits in cost of goods, not in overhead.

4. The Segments: where growth came from

Chart 4 - Segment Growth vs Margin Change

Split by business line, growth came from everywhere, and so did the margin shift. The Cafe Chain, still about 90% of revenue, grew 37.0% with margin easing from 24.3% to 21.2%. Distribution & Retail (Packaged) more than doubled, up 125.6%, with margin moving from 53.3% to 42.3%. Others grew 77.9%, margin from 16.1% to 15.0%.

The mix is tilting toward distribution, and every segment converted a little less of its revenue into profit than the year before.

What the Numbers Reveal

Put together, the statement tells one clear factual story: this was a quarter of fast revenue growth in which margins narrowed across the board, with the change concentrated in cost of sales.

What the numbers don't tell us is why. A three-point rise in cost of sales could be a deliberate move: pricing to win share, absorbing input costs, or scaling a lower-margin distribution line on purpose. It could equally be cost pressure the business is already working to recover. The P&L shows the what and the where with precision; the why belongs to the people running the company. This analysis stops at the lid lifted; the interpretation is the reader's.

Questions the Numbers Raise

For a reader looking under the hood, a few questions follow naturally from the figures, not as conclusions but as the threads the data leaves dangling:

  • Is the rise in cost of sales a deliberate trade, buying revenue and market share, or unplanned cost pressure?
  • Distribution & Retail is the fastest-growing line at the lowest and falling margin; is that mix shift meant to continue?
  • The three-quarter view shows margins dipped mid-year and partly recovered; is the latest quarter a step back toward the prior level, or a new baseline?

Data Sources and Methodology

Built from Oriental Kopi's published 1Q FY2026 quarterly report. Three tables drive an interactive dashboard (built in both Power BI and a live web version): the full P&L statement (12 line items, two periods), a three-quarter headline trend, and a segment breakdown. From these the analysis computes vertical analysis, horizontal analysis, margins, and segment growth. Figures in RM'000. The headline trend covers three non-consecutive quarters (Dec'24, Sep'25, Dec'25), so the emphasis is year-on-year and structural comparison rather than a continuous time series.