An online store's orders surge through the year-end shopping peak.Illustration · Data Stories Lab
Demand forecast · E-commerce
Riding the Growth Curve
Fast growth, with a clear year-end festive lift
Data Stories LabAnalyst report36 months · 2022–2024
This case study reads three years of monthly revenue for an online store to answer one practical question for the owner: how much will the business take next year, and what should that change about buying, cash and marketing?
Two things are happening at once: the store is growing quickly, and it has a repeating year-end peak. The findings below show how fast it is growing, how big the festive lift is, what next year should bring month by month, and how far the forecast can be trusted.
The numbers
2.9×
revenue, first year to last
+4.9%
average growth each month
+56%
forecast growth next year
December
biggest month (festive peak)
“The risk in a fast-growing store is not weak demand, it is running out of stock or cash before it arrives.”
What the data shows
1. Is the business growing, and how fast?
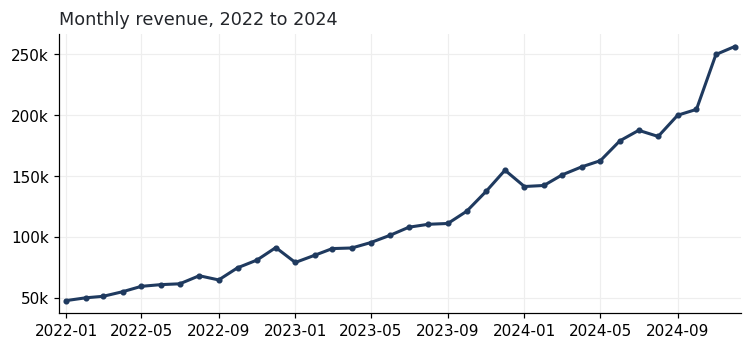
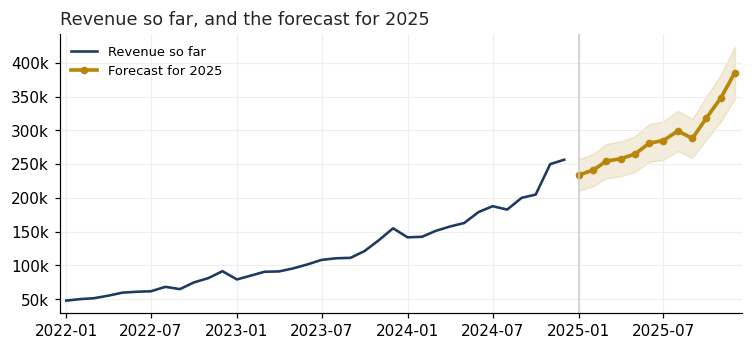
Revenue has climbed almost without a break, from about RM 48,000 a month at the start of 2022 to RM 257,000 by the end of 2024, growing close to 4.9% every month, which compounds to nearly tripling the business in three years.
This steady climb is the defining fact about the store. Any plan that assumes next year looks like this year would badly under-buy and under-staff, so stock, cash and capacity should be set for a bigger business each month.
2. How much bigger is each year than the last?
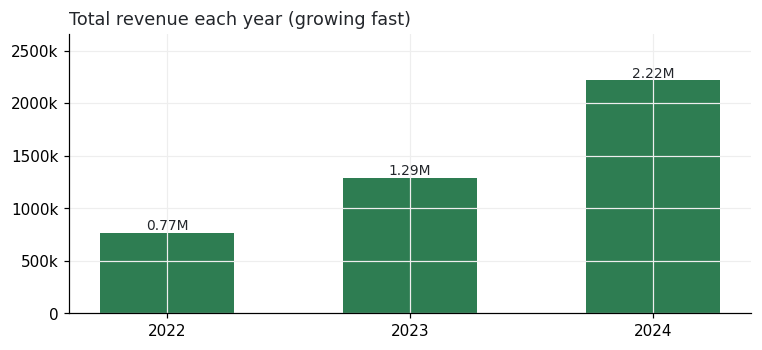
Yearly revenue rose from about RM 0.77 million in 2022 to RM 1.29 million in 2023 and RM 2.22 million in 2024, close to three times larger across the three years, with each year roughly 70% bigger than the one before.
Growth at this pace strains everything behind the sales: supplier orders, storage, packing and the cash tied up in stock. Next year's budget and supplier commitments should start from a base well above this year, not a small step up.
3. Is there a seasonal pattern on top of the growth?
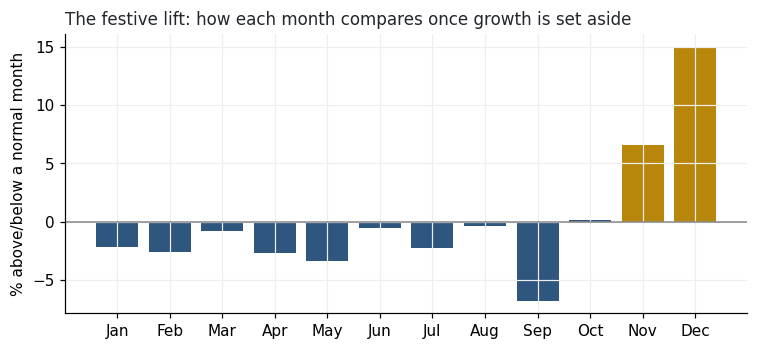
Underneath the climb is a clear yearly rhythm: November and December run well above a normal month as the year-end shopping peak lands, while January and February dip below as spending cools.
Two forces stack, a strong upward trend and a festive lift every year-end, with December the single biggest month and the new year the leanest stretch. Stock and advertising should be built up ahead of November and December, then eased back in January and February.
4. What will the next twelve months bring?
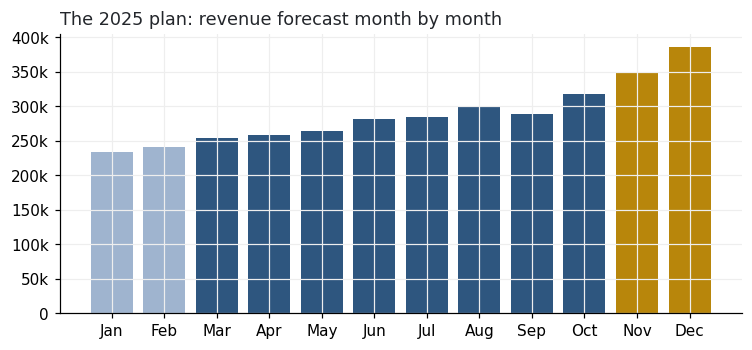
Carrying both the growth and the festive lift forward, revenue for 2025 is forecast at about RM 3.46 million, up roughly 56% on the last twelve months, with December 2025 the biggest month yet, near RM 386,000.
That is a large step up the business has to be ready to supply. In a fast-growing store the risk is rarely weak demand, it is running out of stock or cash before the demand arrives, so purchasing and cash should be planned a full season ahead.
5. Can the forecast be trusted, and why does the growth matter?
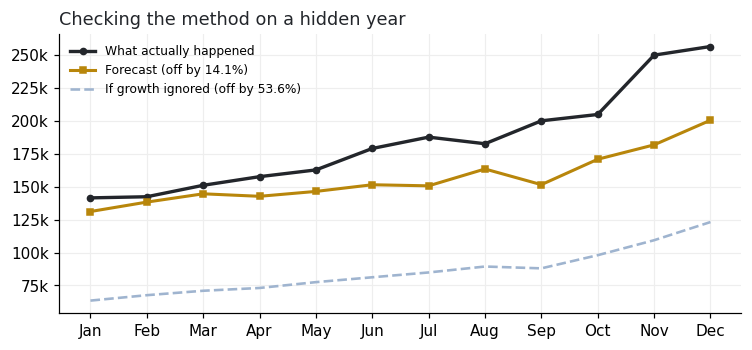
Tested by hiding the most recent year and predicting it from the earlier data, the forecast came within about 14% of what actually happened, while a simpler method that ignored the growth was off by 54%, more than three times worse.
That gap is the point: on a fast-growing business a forecast that does not account for the climb is badly wrong, while one that follows both the growth and the festive lift stays close. Treat the forecast as a solid planning base and refresh it each quarter as new sales confirm the pace.
6. Where do the peaks and dips fall, and what should change month to month?
Across 2025 the busiest months are November and December around the year-end peak, and the leanest are January and February straight after, with every month expected to run above the same month a year earlier.
The operating calendar follows that shape: the second half builds toward the festive peak, then resets in the new year. Concentrate buying and marketing into the run-up to the peak, and use the quiet new-year months to clear stock and reset.
Method & data
This report is based on 36 months of revenue for an online store, January 2022 to December 2024. To forecast 2025, the analysis followed two things at once: the steady month-on-month growth and the year-end festive lift. The forecast was checked by hiding the most recent year and predicting it from the earlier data, it came within about 14% of what actually happened, while a simpler method that ignored the growth was off by 54%, confirming the growth has to be built in. The figures are well-grounded estimates, not exact promises.
Conclusion
The store's defining feature is fast, steady growth with a year-end festive peak on top. Each year has run close to 70% larger than the last, and the pattern shows no sign of flattening. The danger is planning as if next year resembles this year: buying, cash and capacity set to today's size fall short within months, most painfully at the December peak.
The recommended direction is to plan forward, not backward: budget for a bigger business each month and set buying and cash from a base well above this year; build stock and advertising ahead of November and December; use the quiet January and February to clear stock and reset; keep cash ahead of the growth, since the binding limit on a fast-growing store is usually funding, not demand; and refresh the forecast each quarter as new sales confirm the pace.