Case Studies /Regression Analysis /What a Ringgit Returns
Ad spend turning into store sales.
Ad spend turning into store sales.Illustration · Data Stories Lab
Marketing ROI

What a Ringgit Returns

Every RM1 of ad spend returns about RM3.21

Data Stories LabAnalyst report120 campaigns · Meta, Google, TikTok

This report reads 120 ad campaigns to answer one practical question for the marketing manager: how much sales does the ad budget actually buy, and can that be used to plan future budgets? Each campaign records what was spent on ads, the sales it produced, and the channel it ran on.

The findings below show how strong the link between spend and sales is, what each ringgit returns, what sales to expect at different budgets, whether the pattern holds across channels, and how far it can be trusted.

The numbers
RM3.21
sales per RM1 of ad spend
95%
of sales differences explained by spend
14.3%
how close the predictions were
3
channels, all the same pattern

“Ad spend is the main lever on sales, and it behaves predictably enough to plan around.”

What the data shows

1. Does spending more on ads bring more sales?
chart

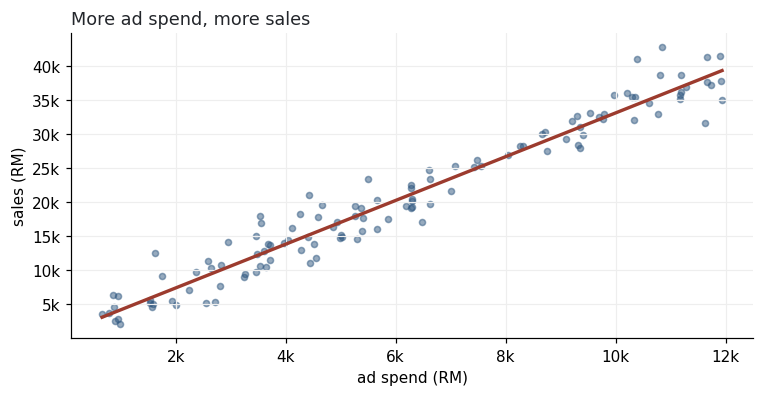
Yes, very clearly. Across 120 campaigns, the more spent on ads, the higher the sales, and the link is unusually tight: differences in ad spend explain 95% of the difference in sales. Almost nothing else is needed to explain how a campaign performs.

For a marketing team this is a reassuring result. Ad spend is not one of many murky factors here, it is the main lever, and it behaves predictably enough to plan around.

Treat the ad budget as the primary dial for sales, and set it deliberately rather than by habit or leftover budget.
2. How much does each ringgit of ad spend bring back?

chart

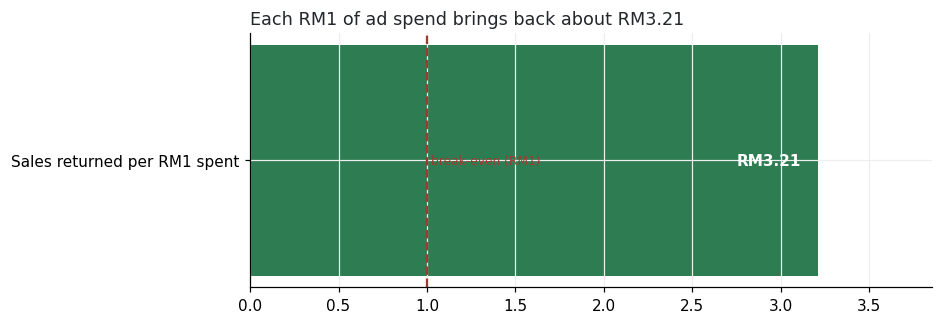
Every RM 1 put into ads brings back about RM 3.21 in sales. So a campaign is not just breaking even on its ad cost, each ringgit is returning roughly three times over in sales.

This is the number that justifies the budget. As long as the product margin is more than about a third of the sale price, spending more on ads at this rate adds profit, not just revenue.

Check the return against the product margin, and if the margin clears that bar, there is a strong case to keep funding ads.

3. What sales can be expected at different budgets?

chart

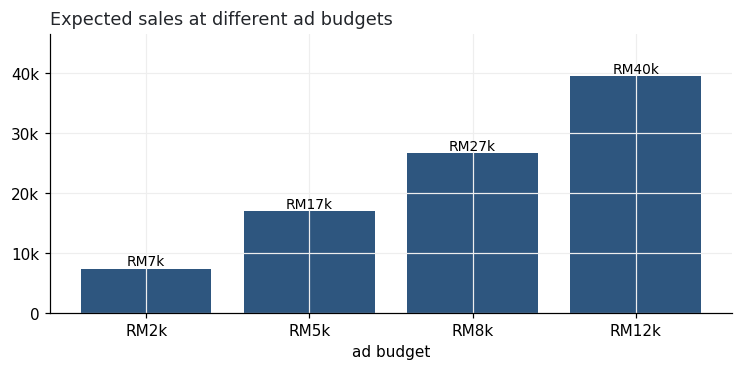
The relationship turns any planned budget into an expected sales figure. A RM 2,000 campaign should bring about RM 7,400, RM 5,000 about RM 17,037, RM 8,000 about RM 26,674, and RM 12,000 about RM 39,524.

This lets the team set budgets to a sales target rather than guess. If the month needs a certain sales figure, the budget that delivers it can be read straight off.

Use the budget table in the appendix to plan each campaign to its sales target.

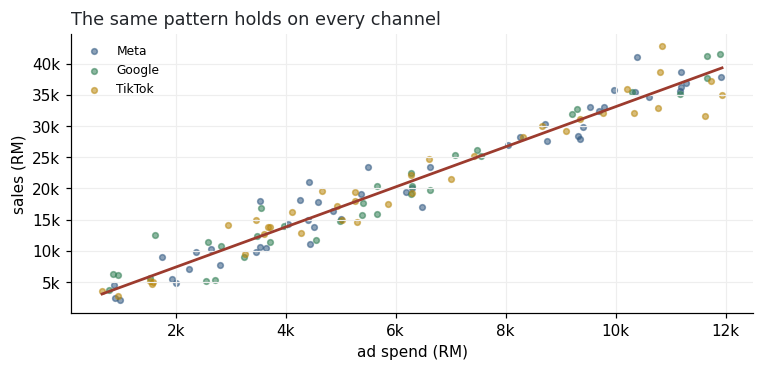
4. Does the pattern hold across channels?

chart

It does. Campaigns on Meta, Google and TikTok all sit along the same line: at a given spend they return about the same sales, with no channel standing clearly apart in this data.

The practical message is that, here, how much is spent matters more than which platform it is spent on. There is no single channel quietly out-earning the others to chase.

Split budget across channels for reach and risk, and focus the real decision on the total spend level rather than the platform mix.

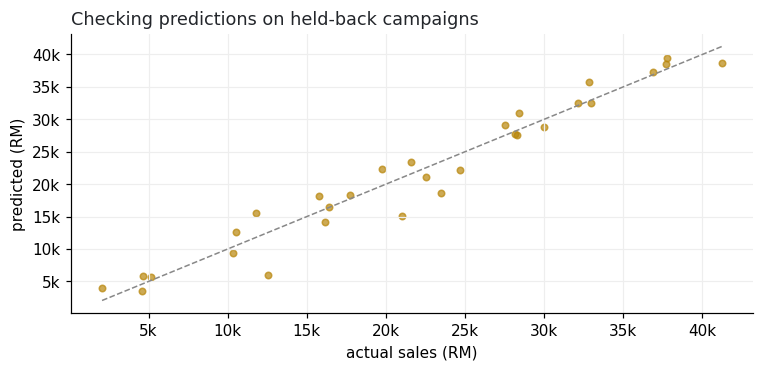
5. Can these predictions be trusted?

chart

Tested on campaigns held back from the analysis, the predictions came within about 14.3% of actual sales, and they were not consistently too high or too low. The straight-line pattern fit cleanly, with no hidden curve.

That is accurate enough to set budgets and sales targets with confidence, rather than treating the forecast as a rough guess.

Plan campaign budgets against these expected-sales figures, and revisit the numbers as new campaigns add to the record.

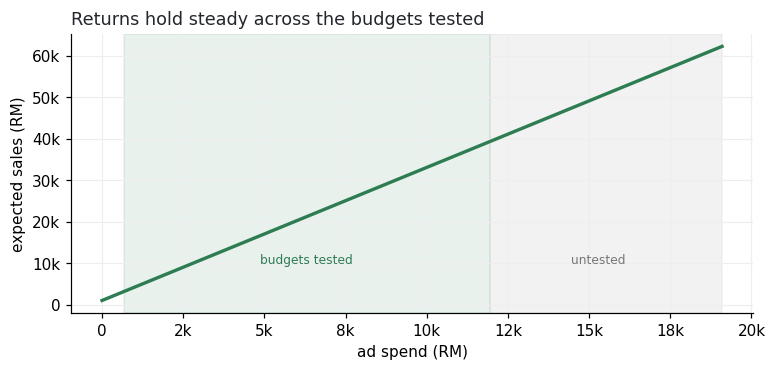
6. Do the returns hold as the budget grows, or do they fade?

chart

Within the budgets seen in the data, from about RM 662 to RM 11,934, each extra ringgit returned about the same RM 3.21, with no sign of the returns fading as spend rose. Bigger campaigns simply made proportionally more.

This means scaling up is safe within that range. Beyond RM {smax:,}, however, the pattern is untested, and very large budgets can start to hit limits the data has not seen.

Scale budgets confidently up to the tested range, and when going well beyond it, step up gradually and watch whether the return holds.

Method & data

This report is based on 120 ad campaigns, each recording ad spend, the sales produced, and the channel. We measured how sales move with ad spend and how much of the difference in sales that explains. Spend explained 95% of the variation in sales, every RM 1 returned about RM 3.21, and on campaigns held back from the analysis the predictions were within about 14.3% of actual sales, with no consistent over or under-estimate and no hidden curve in the pattern. The numbers should be read as well-grounded estimates, not exact promises, and the relationship is reliable only across the range of budgets seen in the data.

Conclusion

For this business, ad spend is the main thing that drives sales, and it does so in a remarkably steady way: each ringgit returns about RM 3.21, the same across channels and across the range of budgets tested. There is little mystery left to explain.

That makes budgeting a decision rather than a gamble. The team can pick a sales target, read off the budget that delivers it, and trust the result to within about 14.3%, as long as the product margin clears the return.

The clear direction is to set ad budgets to sales targets, fund campaigns wherever the margin beats the return, and scale spend confidently within the tested range while testing carefully beyond it.