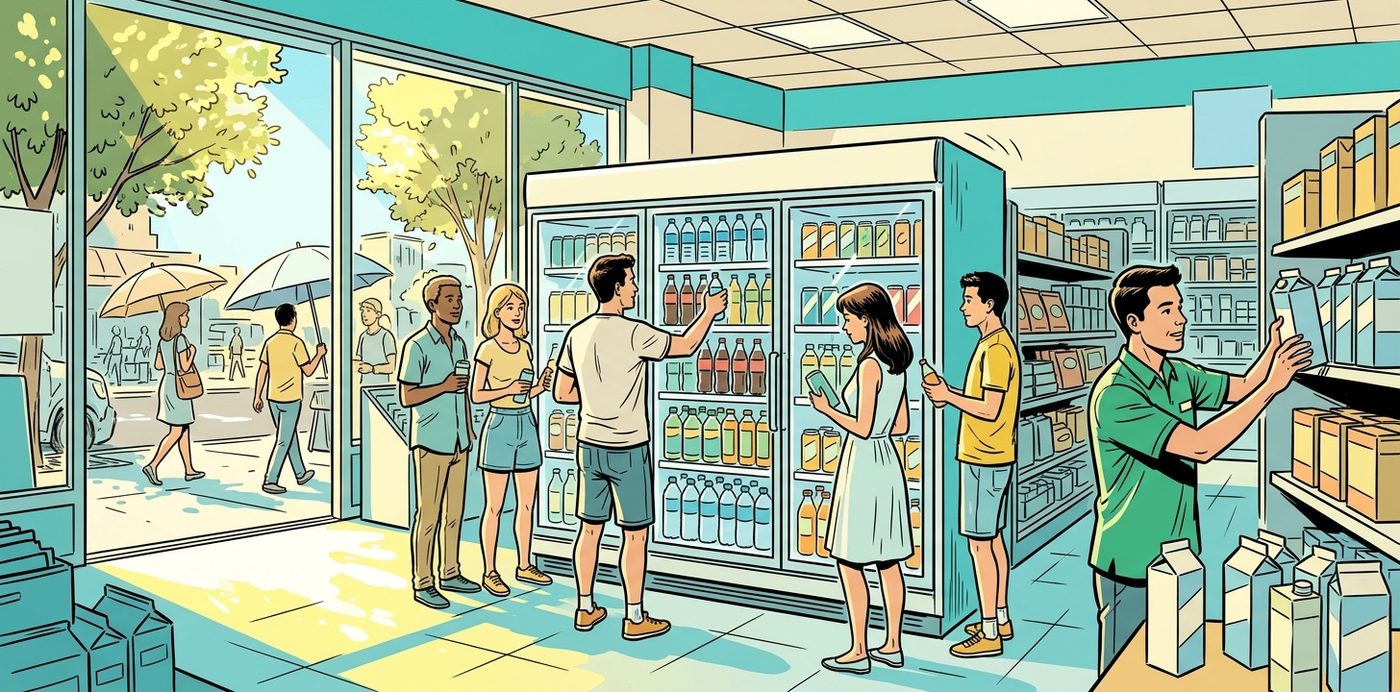
A convenience-store cooler stocked for a hot afternoon.Illustration · Data Stories Lab
Demand Forecast · Retail
What Moves the Cooler
Heat, price and promotions drive daily drink sales
Data Stories LabAnalyst report540 days · 2023–2024
This report reads 540 days of cold-drink sales for a convenience store to answer one practical question for the owner: what makes daily sales go up and down, and how can that be used to order stock and plan promotions? It covers daily sales from Jan 2023 to Jun 2024, alongside the day's temperature, shelf price, and whether it was a promotion day, public holiday or weekend.
The findings below show how much sales swing, what drives them, how reliably a day can be predicted, and what the main levers, price and promotions, are actually worth.
The numbers
+7
drinks per degree hotter
+34
drinks on a promotion day
93%
of daily ups and downs explained
7%
how close the daily forecast was
“Daily drink sales look random, but a few visible things explain most of the swing.”
What the data shows
1. How much do daily sales swing, and is it just random?
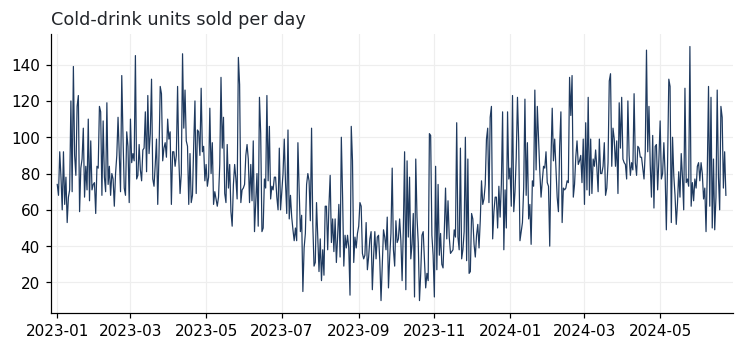
Daily drink sales jump around a lot, from quiet days near 40 units to busy ones above 100, around an average of about 75 a day. At first glance the day-to-day pattern looks unpredictable.
But the swings are not random. They line up closely with a handful of things the shop can see in advance: how hot the day is, the price on the shelf, whether there is a promotion, and whether it is a weekend or public holiday.
Because the causes are known, the busy and slow days can largely be predicted and prepared for, instead of guessed at.
2. Does the weather drive sales?
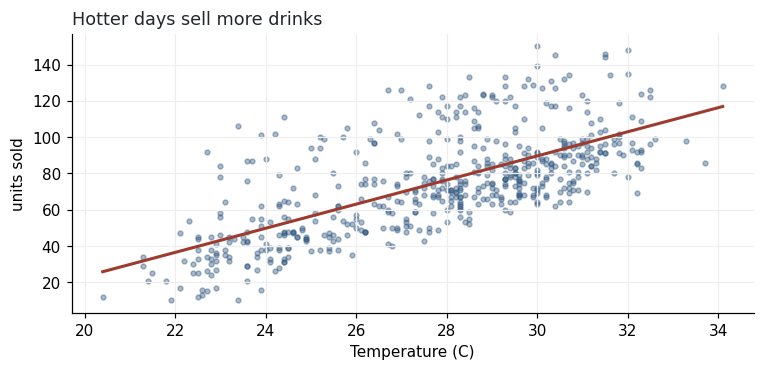
Temperature is the single biggest driver. Each degree hotter adds about 7 more drinks sold in a day, so a hot spell a few degrees above normal lifts sales noticeably.
This makes daily sales partly a weather story. A run of hot days clears the cooler faster than usual, while a cool spell leaves stock sitting.
Following the local forecast pays off: add cooler stock and ice ahead of hot days, and ease off before cool ones.
3. How much does the price change sales?
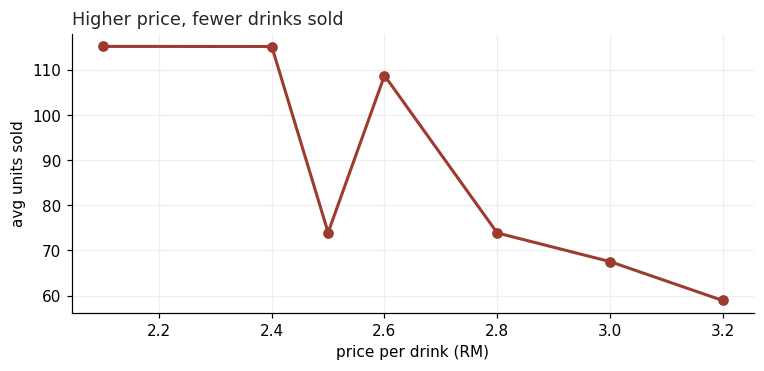
Price pulls the other way. Raising the price by RM 1 lowers sales by about 21 drinks a day, and even the smaller move from RM 2.80 to RM 3.20 costs roughly 9 units a day.
So price is a real lever on how many drinks sell, not only on the margin per drink. A higher price earns more on each sale but moves fewer units, and that trade-off is sizable here.
Set the price as a margin-versus-volume choice, and avoid raising it on already-slow days, when the lost units hurt most.
4. What do promotions, holidays and weekends add?
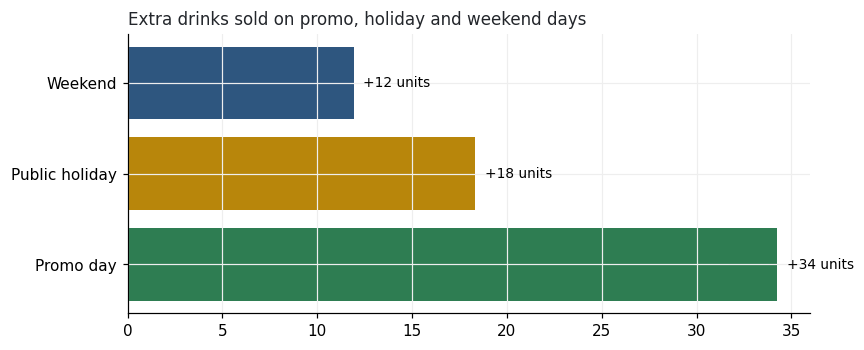
Promotions give the biggest controllable lift: about 34 extra drinks on a promotion day, more than half again on top of a typical day. Public holidays add about 18, and weekends about 12, on top of whatever the weather and price are doing.
These are predictable, plannable bumps rather than surprises. They stack with the weather, so a hot promotion weekend is a very different day from a cool weekday.
Time promotions for slower days to lift them rather than busy days that sell well anyway, and carry extra stock into weekends and the day before a public holiday.
5. Can a day's sales be predicted, and how well?
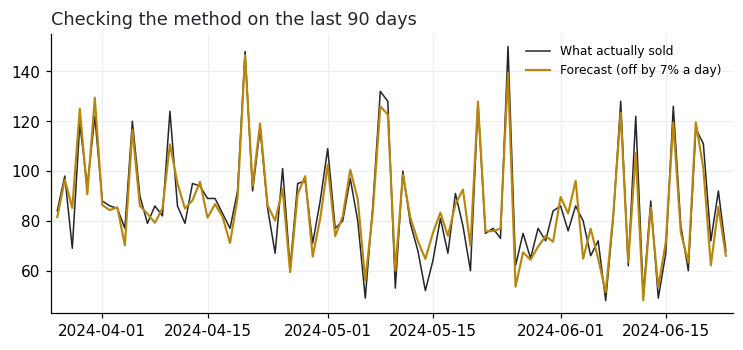
Put together, these factors predict daily sales closely. Tested on the most recent three months, the forecast was off by only about 7% a day. A simple guess that ignored the drivers and used the average day was off by 20%, three times worse.
That accuracy is enough to order stock and plan staff a few days out with confidence, rather than carrying a heavy buffer to cover uncertainty.
Use the day-ahead forecast to set the next delivery and the cooler fill, tightening stock without risking sell-outs.
6. What happens if the shop changes something?
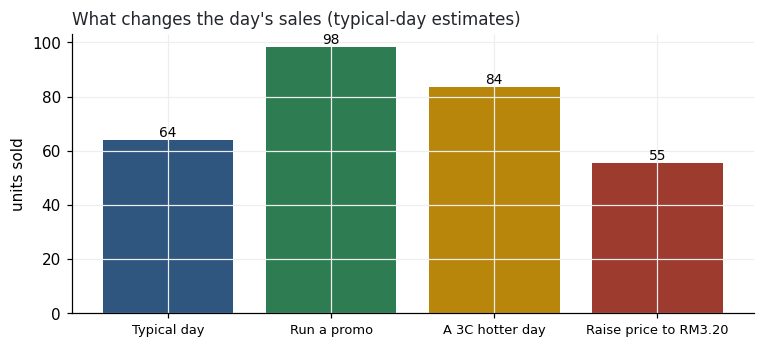
Because each driver's effect is measured, the result of a change can be estimated before acting. From a typical 64-unit day, running a promotion lifts it to about 98, a three-degree-hotter day to about 84, and raising the price to RM 3.20 pulls it down to about 55.
This turns guesswork into a simple set of dials. The shop can see, roughly, what a promotion or a price change is worth before committing to it.
Pair promotions with hot spells for the biggest days, and test price changes knowing the likely cost in units.
Method & data
This report is based on 540 days of cold-drink sales for a convenience store, Jan 2023 to Jun 2024. For each day we recorded the units sold, the temperature, the shelf price, and whether it was a promotion day, public holiday or weekend. We measured how much each of these moves sales, then combined them into a day-by-day forecast. Tested on the most recent 90 days, the forecast was off about 7% a day, while ignoring these factors and using the average day was off 20%; together the factors explain 93% of the day-to-day difference. The numbers should be read as well-grounded estimates, not exact promises.
Conclusion
Daily drink sales look random but are mostly explained by a few visible things: how hot it is, the price, and whether the day carries a promotion, a holiday or a weekend. Together they account for 93% of the day-to-day difference.
That changes how the shop can run. Instead of carrying heavy stock to cover uncertainty, or running promotions on instinct, the store can predict a day within about 7% and see what each lever is worth before pulling it.
The clear direction is to plan daily stock to the weather and the calendar, time promotions to lift slow days, and treat price as a volume decision, all guided by the day-ahead forecast.