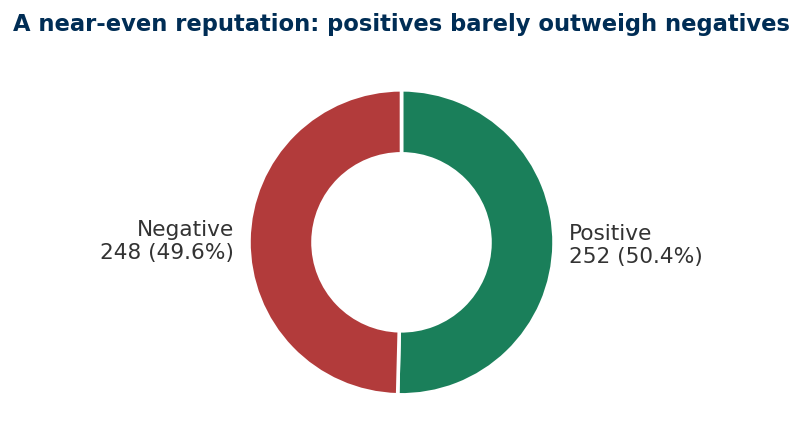
This review reads 500 customer reviews of a coffee shop across Google, Facebook, Instagram and Twitter to show how the shop is seen: where it wins, where it leaks, and what to do next. Overall the shop sits almost even, 252 happy reviews against 248 unhappy, a net score of just +0.8%. Net sentiment here simply means the share of happy reviews minus the share of unhappy ones, so zero is an even split.
That flat average hides the real story. The shop looks strong on Google but weak on Facebook, the same business with two very different reputations, and most of the unhappiness traces back to a short list of items and two recurring issues, price and service. The good news is that the problems are concentrated, so a few focused changes move the score more than a broad overhaul.
The numbers
+0.8%
overall net sentiment
20 pts
gap, best vs worst platform
-33%
worst item (banana bread)
+8.3%
March, turning up
“The same shop reads as a leader on Google and a laggard on Facebook, 20 points apart.”
Items to fix first
The damage is concentrated, not spread evenly across the menu. Ranked by how often they are reviewed and how poorly they score, ten items carry most of the negative reviews. This is the short list to fix first, ahead of any broad menu change.
Rank
Item
Menu group
Net sentiment
Reviews
Priority
1
Banana Bread
Pastries
-33%
24
Critical
2
Matcha Latte
Non-Coffee
-20%
15
High
3
Breakfast Sandwich
Light Meals
-23%
13
High
4
Muffin
Pastries
-40%
10
Critical
5
Veggie Wrap
Light Meals
-40%
10
Critical
6
Flat White
Hot Coffee
-40%
10
Critical
7
Iced Mocha
Cold Coffee
-20%
10
High
8
Mocha
Hot Coffee
-33%
9
High
9
Coffee Milkshake
Cold Coffee
-43%
7
High
10
Herbal Tea
Non-Coffee
-33%
6
High
What this means
The shop does not have one reputation; it has four, one per platform, and the flat overall score hides that. A customer checking Google sees a well-liked shop, while a customer checking Facebook sees a poorly rated one.
The unhappiness is about price and service, not taste or quality. So the gains come from practical fixes to pricing and service on a short list of items, not from changing recipes.
The strengths are just as clear. A handful of well-loved items and an all-positive read on taste and quality are ready to carry the marketing.
What the reviews show
How is the shop doing?
The shop is balanced, not winning or losing. Out of 500 reviews, 252 are happy and 248 are unhappy, a net score of +0.8%. That is close to a coin flip, so there is no cushion of goodwill to absorb a bad week.
This single number is also misleading on its own. A near-even average hides wide swings by platform and by item, which is where the real opportunities and risks sit.
How do the four platforms compare?
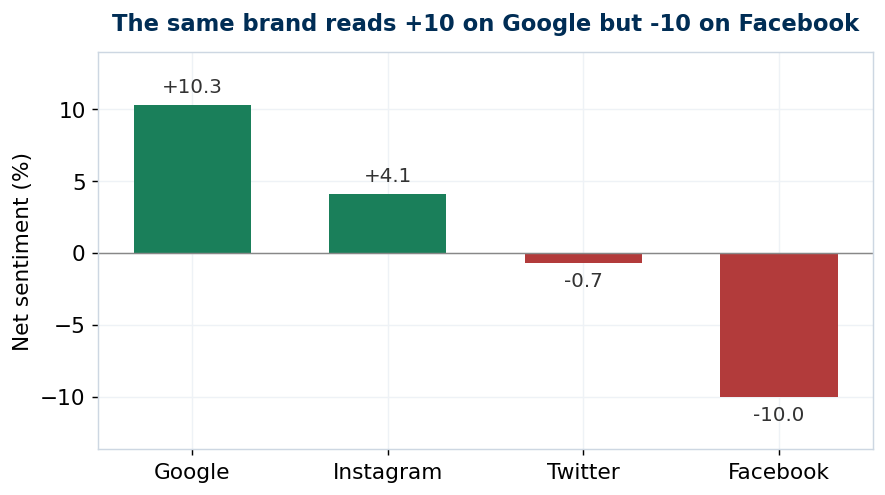
The same shop reads very differently depending on where people look. Google is strongly positive at +10.3 and Instagram mildly positive at +4.1, while Twitter is flat at -0.7 and Facebook clearly negative at -10.0. The distance between the best and worst platform is 20 points.
This is why one overall score misleads. The gap shows where reputation is leaking (Facebook) and where it is already strong enough to build on (Google and Instagram), which is exactly where marketing should focus.
What are customers unhappy about?
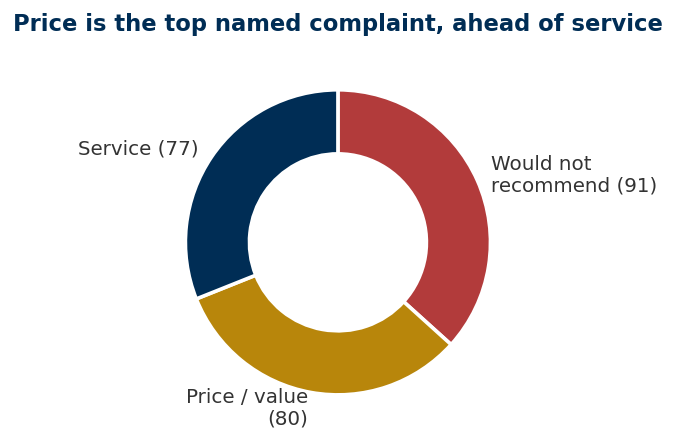
The complaints are about money and service, not the food and drink. Among the 248 unhappy reviews, the issues split into general "would not recommend" (91), price and value (80), and service (77). Taste and quality draw zero complaints.
That reframes the problem as operational rather than culinary. The fixes are practical: review portion-for-price on the worst items, and tighten service where speed and consistency draw complaints.
Which menu groups do best?
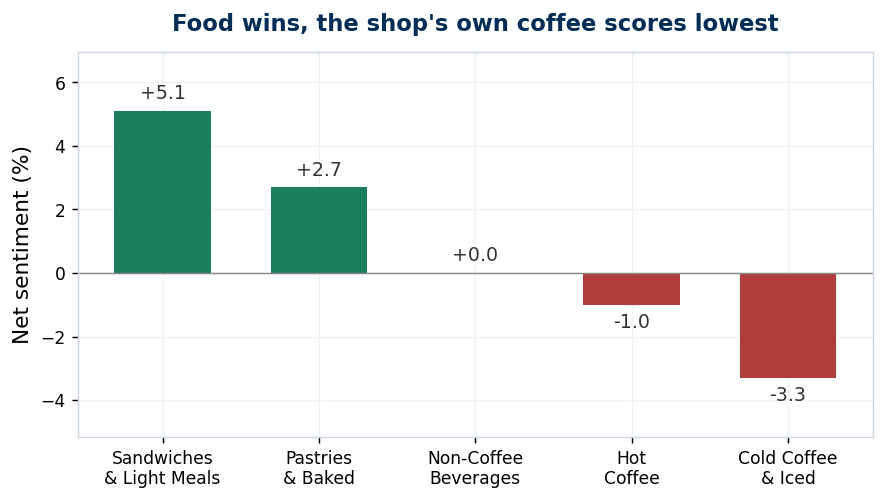
Food does better than drinks. Sandwiches and light meals lead at +5.1 and pastries at +2.7, while the coffee lines trail (hot coffee -1.0, cold coffee and iced drinks -3.3, the lowest of five groups).
For a coffee shop, a coffee line that scores below the food is worth a closer look. The issue is not taste, it is price and consistency on the drinks, so the lever is operational rather than a new menu.
Which items to fix or promote?
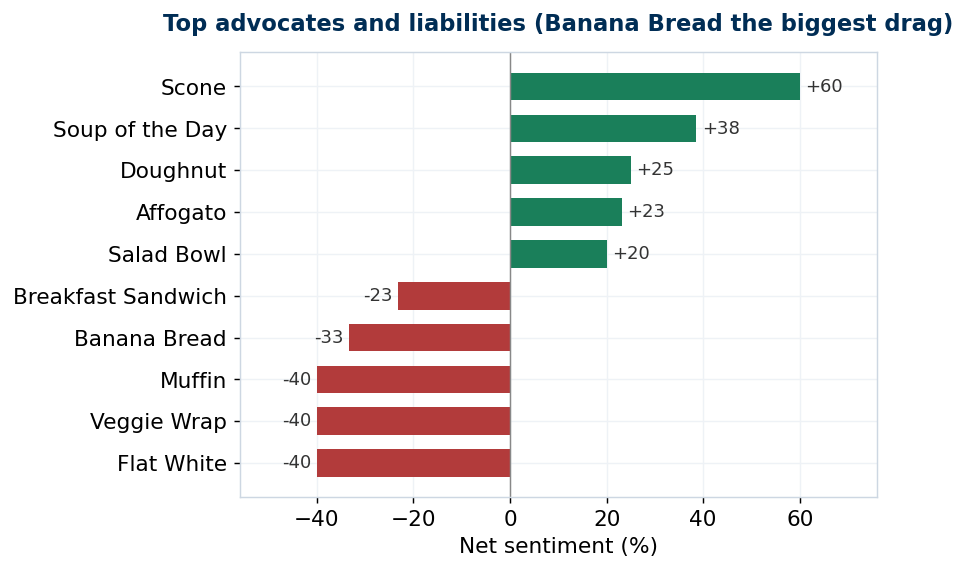
The list cuts both ways. Banana bread is the loudest problem, the single most-reviewed item (24 reviews) and strongly negative at -33%, alongside muffin, veggie wrap and flat white at -40% each. Fixing this short list lifts the score more than any broad change.
The winners are just as clear and often under-featured: chai latte at +71%, scone and pain au chocolat at +60%, fresh juice at +50% and soup of the day at +38% on a healthy 13 reviews. These are proven favourites, ready to promote.
Is the reputation improving?
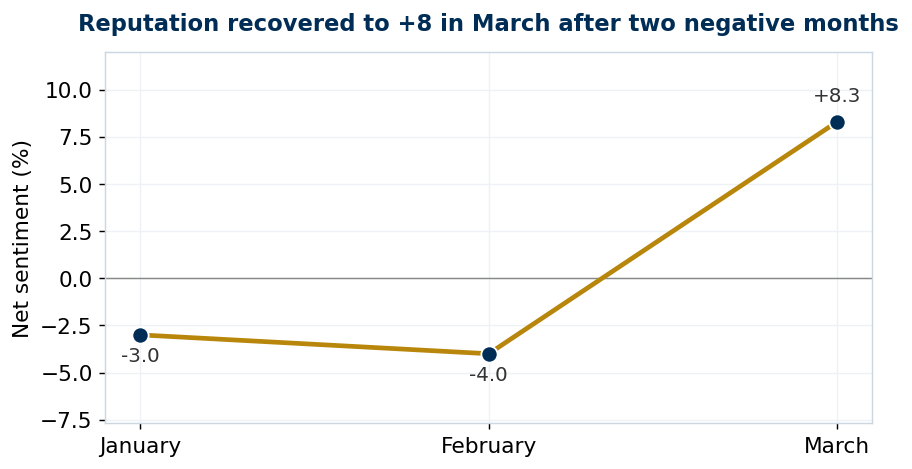
The trend is positive. Net sentiment moved from -3.0 in January and -4.0 in February to +8.3 in March, the best month of the quarter.
The signal is new, so it is worth watching. One strong month is not yet a habit, but it is the right moment to launch marketing while sentiment is rising rather than fighting a slump.
Marketing takeaways
Lead on Google and Instagram. These are the platforms where customers already speak positively, so review-request nudges and paid promotion work with the grain. Repair Facebook before spending there.
Feature the favourites. Build posts and offers around the proven winners, chai latte, scone, fresh juice and soup of the day, rather than the items still being fixed.
Use real taste and quality quotes. Every taste and quality review is positive, so genuine customer lines make ready-made, believable campaign copy.
Time it to the upswing. March already turned positive, so launching now rides the momentum.
Conclusion
The shop leads on Google by almost the same margin it trails on Facebook, its coffee line slightly underperforms its food, and a short list of items carries most of the negative reviews. The cause is consistent: price and service, not taste or quality.
This is a workable position, not a crisis. Fixing the worst items, closing the Facebook gap, and marketing the favourites on the platforms that already work would turn the March upswing into a steady climb. Tracked month by month, that recovery becomes a trend rather than a one-off.
Appendix: action list by item
Every reviewed item sorted into fix-first and promote, with its score, review count and main issue, so the findings convert straight into a worklist. The highest-priority items are shown below; the complete 50-item list ships as a companion CSV.
Item
Menu group
Reviews
Net sentiment
Main issue
Action
Banana Bread
Pastries
24
-33%
Price / value
Fix now
Matcha Latte
Non-Coffee
15
-20%
Would not recommend
Fix now
Breakfast Sandwich
Light Meals
13
-23%
Would not recommend
Fix now
Muffin
Pastries
10
-40%
Price / value
Fix now
Veggie Wrap
Light Meals
10
-40%
Service
Fix now
Flat White
Hot Coffee
10
-40%
Service
Fix now
Iced Mocha
Cold Coffee
10
-20%
Would not recommend
Fix now
Mocha
Hot Coffee
9
-33%
Would not recommend
Fix now
Biscotti
Pastries
5
-60%
Price / value
Watch
Soup of the Day
Light Meals
13
+38%
-
Promote
Doughnut
Pastries
16
+25%
-
Promote
Scone
Pastries
10
+60%
-
Promote
Chai Latte
Non-Coffee
7
+71%
-
Promote
Method & data
This review covers 500 customer reviews of a coffee shop, collected across Google, Facebook, Instagram and Twitter between 1 January and 31 March 2024. Each review carries the item, menu group, platform, date and a short comment, sorted into happy or unhappy and into a theme (taste, quality, price, service, or general recommendation). Net sentiment is the share of happy reviews minus the share of unhappy ones, measured overall and by platform, menu group, item and month. This is a demonstration build on realistic sample data; the review wording follows a small set of standard phrases, and the same measures apply directly to live review feeds.