Which live sellers earn their slots, on equal airtime.Illustration · Data Stories Lab
Influencer & performance
Who Really Drives Sales?
Find which live sellers actually drive sales
Data Stories LabAnalyst reportTikTok live · 10 influencers
The retailer's question is simple and high-stakes: with a fixed roster and fixed airtime, who deserves more slots, who stays as is, and who should go? Getting this wrong is expensive in two directions. Keep a weak seller and you pour 120 hours a month into below-average returns. Cut the wrong person, say a high-audience influencer who actually sells well, and you lose revenue while feeling data-driven.
This report is written for the manager making that call. It works from the bottom up: first it proves everyone had an equal shot, then it ranks what each influencer actually sold, then it strips out luck (slot, crowd, product price) to isolate genuine selling ability, and finally it converts that into a defensible promote, keep, or dismiss verdict for each of the 10.
The numbers
10
influencers
$59,837
top seller
0.94
units-revenue link
Audience
does not sell
“The single most important finding is that this roster's results are earned, not inherited.”
What the data shows
Executive Summary
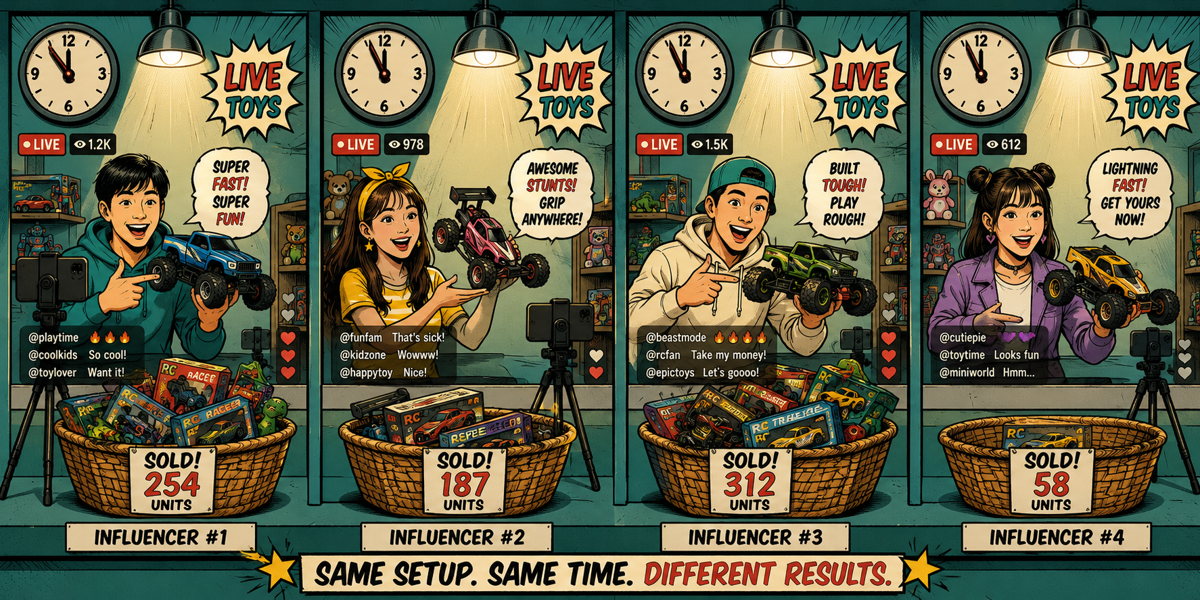
A toy retailer ran a month of TikTok live selling in June 2024 with 10 influencers, each given the exact same airtime: 120 one-hour sessions. They earned $515,317 between them, but not evenly. The top seller brought in $59,837 and the bottom seller just $38,433, a $21,404 gap for identical effort, identical time slots, and similar-sized audiences.
The analysis shows this gap is the person, not their circumstances. Audience size and conversion rate do not predict who sells, and the only input that tracks revenue is engagement, which the influencer controls. We recommend promoting the four proven top sellers, keeping the four steady performers, and releasing the two clear laggards, then reallocating their 240 monthly hours to the people who convert them best.
1. Is anyone outperforming just by streaming more?
No. All 10 influencers ran exactly 120 one-hour sessions in June, identical airtime with no exceptions. Every dollar of the $515,317 total was earned on a level playing field of effort. That means any revenue gap is real performance, not extra stage time, so the roster can be compared like-for-like. This is the foundation that makes the whole verdict defensible: same hours for everyone, so the results are about how well each person used the time, nothing else.
2. Who sold the most, and who sold the least?
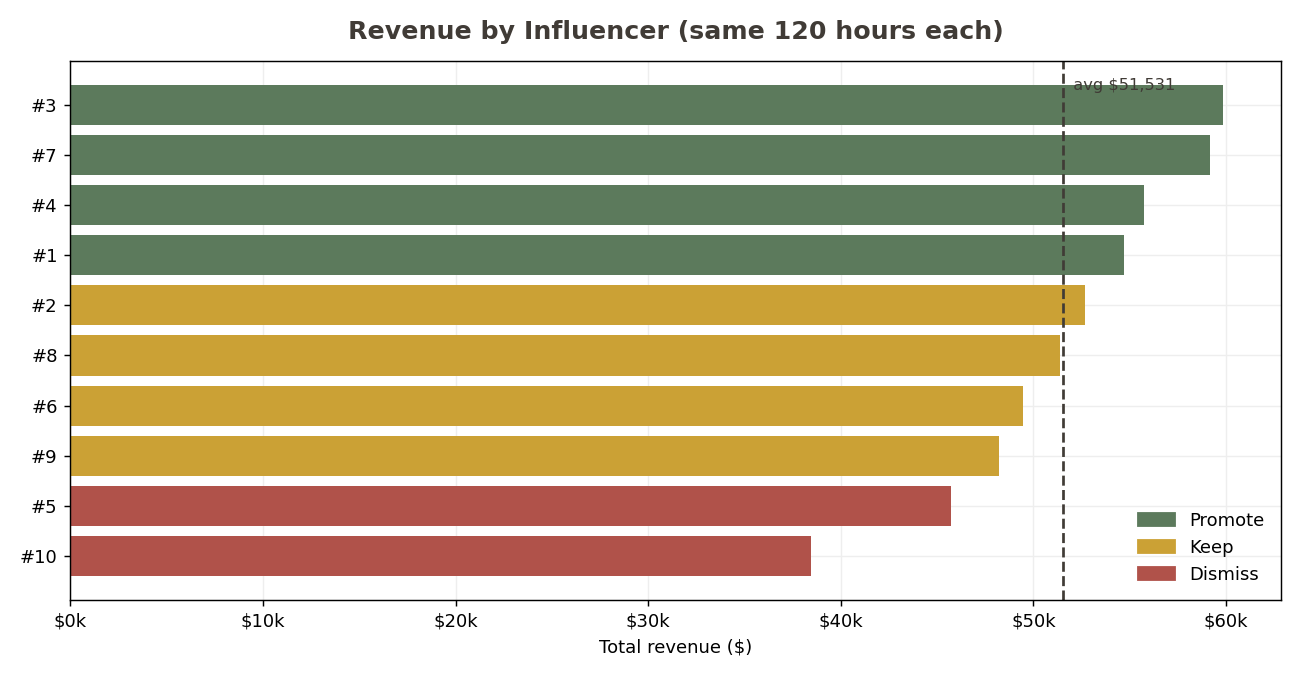
Influencer #3 led with $59,837, followed closely by #7 at $59,143, #4 at $55,730, and #1 at $54,725. At the bottom, #10 trailed badly at $38,433 and #5 at $45,699. The gap between best and worst is $21,404, meaning the top seller earned 1.56 times what the bottom one did for the same 120 hours. In revenue per hour, that is $499 against $320. This spread is wide enough to act on; it is not noise around an average, it is a clear separation between who works the slots well and who does not.
3. Who sold the most units, and is that the same person who made the most money?
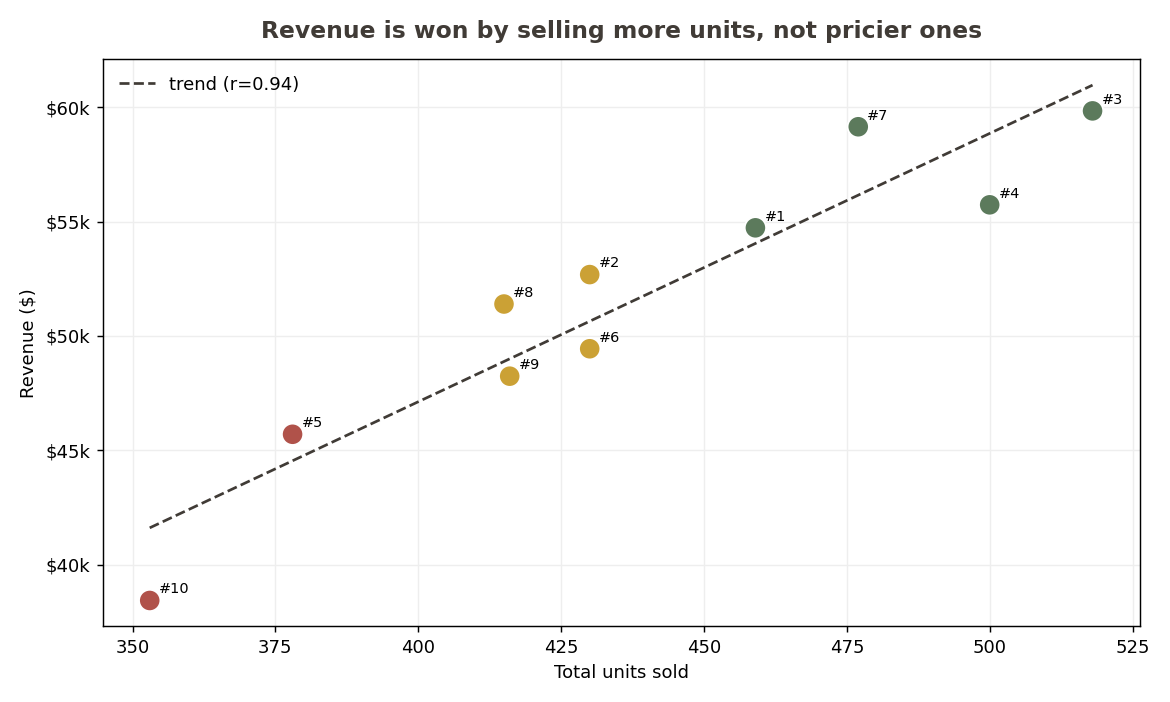
Mostly the same people, with one telling exception. Influencer #3 leads on both units (518) and revenue, so the top performer is genuinely top on both counts. But #4 sold more units than #7 (500 against 477), yet #7 earned more money ($59,143 against $55,730), because #7 sold slightly pricier toys. So the leaderboard is driven mainly by volume, with a smaller assist from product mix. For ranking purposes, revenue and units tell almost the same story, which is reassuring: the top sellers are not a mirage created by one expensive item.
4. Did the top sellers win on higher prices or more units?
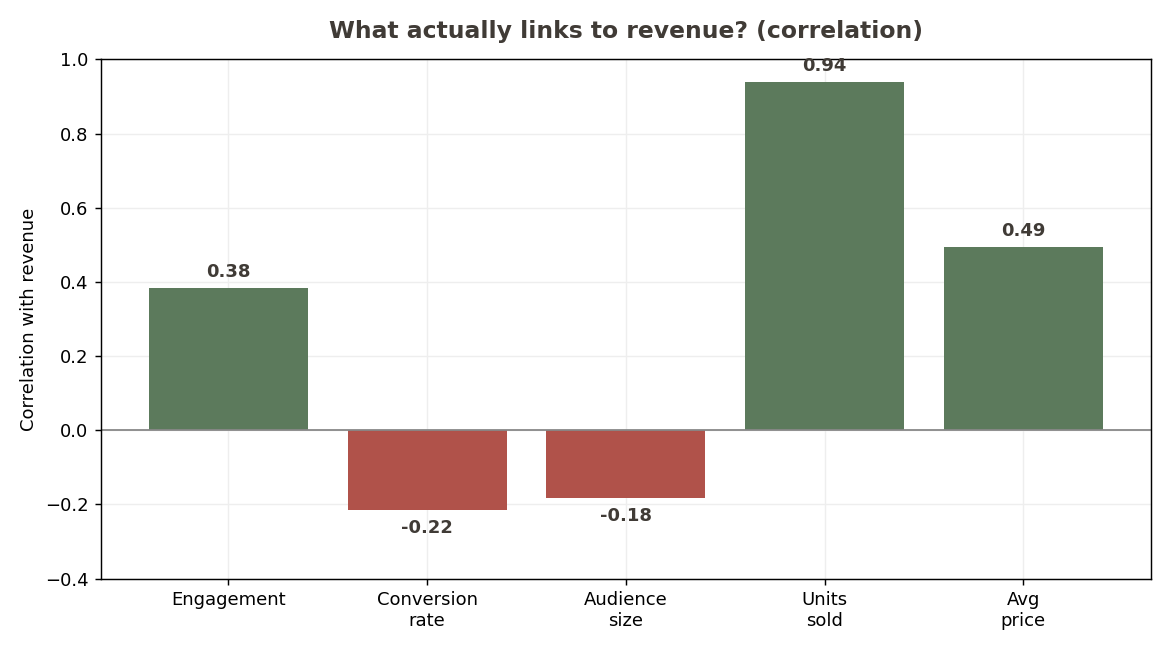
On units, clearly. Revenue tracks total units sold very tightly (correlation 0.94) and average price only moderately (0.49). In plain terms, the influencers who made the most money did it by moving more toys, not by being handed expensive ones. That matters for fairness: selling more units is a selling-skill signal, while a lucky high-price product mix would be circumstance. The data says the leaders earned their lead mostly through volume. Price helps at the margin, which is why a few rank positions shuffle, but it never overturns the volume story.
5. Did the top sellers just get bigger audiences?
No, and this is the most important myth to retire. Bigger audiences do not lead to more sales: revenue and audience size actually move in opposite directions slightly (correlation negative 0.18), and audience per influencer is tightly clustered (474 to 565) because it is driven by the slot, not the person. So a manager who promotes on viewer counts would be rewarding the wrong thing. The top sellers did not win because more people showed up; they won because they sold better to whoever was there. Stop reading audience size as a performance metric.
6. Does higher engagement lead to more sales?
Weakly yes, and it is the only input metric that points the right way. Revenue rises with engagement (correlation 0.38), so the influencers who hold attention tend to sell more. But the link is loose: engagement explains only about 15% of the revenue gap, and there are exceptions. Influencer #8 has the highest engagement (46.4) yet only mid-table sales, while #2 has the lowest engagement (40.8) and still sells solidly. So engagement is a useful supporting signal, the best of the input metrics, but not a substitute for looking at what each person actually sold. Coach for engagement, but judge on revenue.
7. Does a higher conversion rate lead to more revenue?
No. Conversion rate, the share of viewers who buy in a session, does not track revenue at all (correlation negative 0.22). Conversion rates are nearly flat across the roster (4.4% to 5.1%), so they do not separate the strong sellers from the weak ones. This is counterintuitive, because conversion rate feels like the purest sales metric, but here it is a distraction: two influencers can convert at the same rate and earn very different amounts depending on basket size and volume. Do not rank or reward on conversion rate.
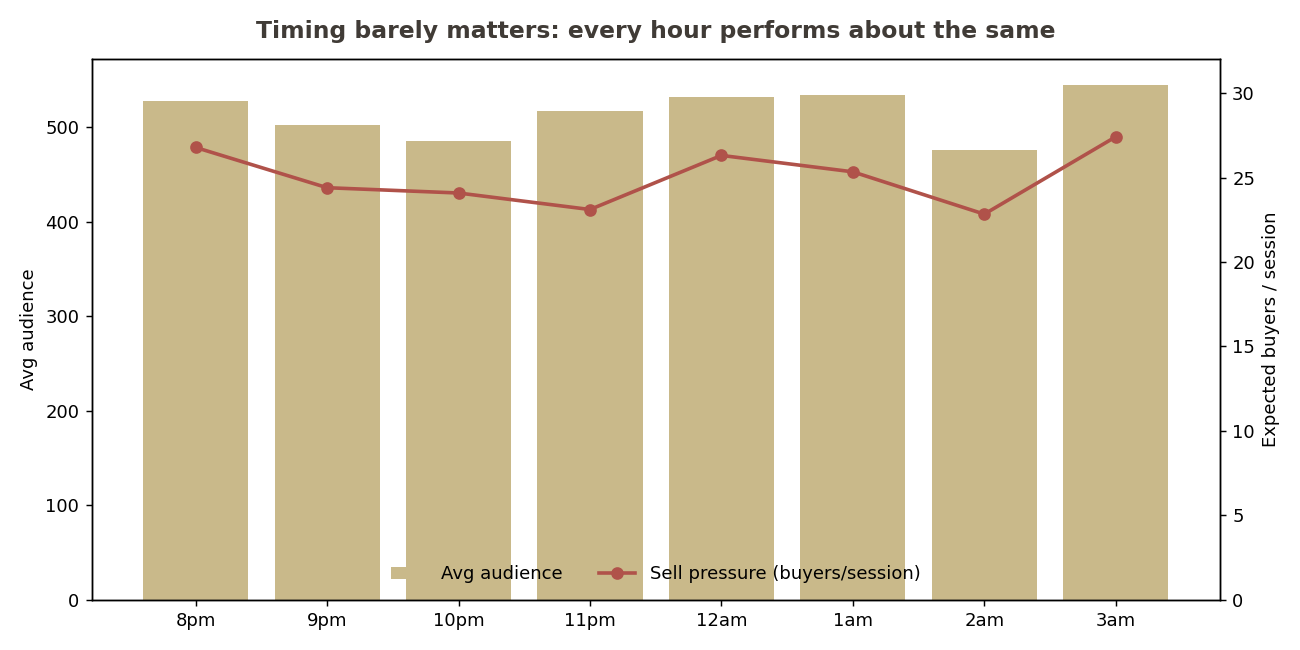
8. Which hour draws the biggest audience, and is it also the most productive?
The 3am slot draws the largest average audience (545 viewers) and also shows the highest selling pressure (audience times conversion, at 27.4 expected buyers per session), so the biggest-crowd hour is also the most productive one. But the headline is how little timing matters: across all eight hours, selling pressure ranges only from 22.8 to 27.4, a narrow band. No influencer is meaningfully helped or hurt by their slot. This reinforces the fairness case: a weak seller cannot blame a bad hour, because there is no bad hour.
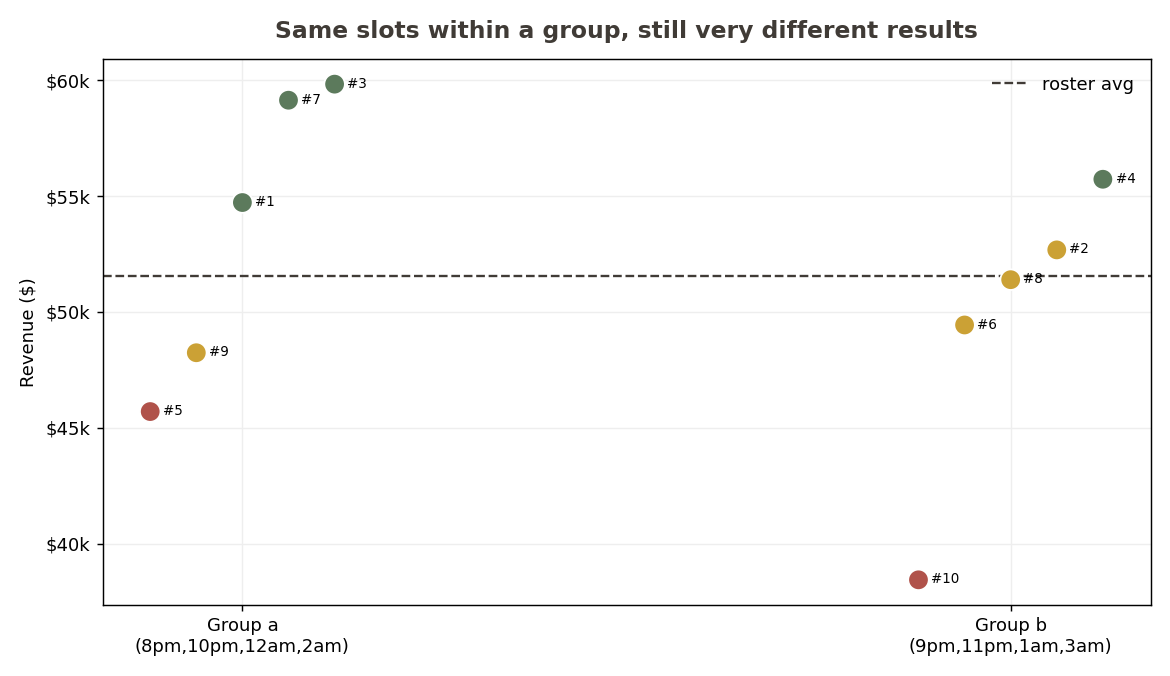
9. With the time slot held constant, do influencers still differ, the person or the slot?
The person, decisively. Because all five influencers in a group work the identical four hours, any difference among them cannot be the slot. Yet within Group a, revenue still ranges 1.31 times (from $45,699 to $59,837), and within Group b it ranges 1.45 times (from $38,433 to $55,730). By contrast, the gap between the two groups' averages is small ($53,528 against $49,535, about 8%). So the differences within a shift dwarf the differences between shifts: the rota barely matters, the individual is what counts. This is the proof that promoting or releasing on revenue is fair, because the results follow the people, not their schedule.
Recommendation: Promote, Keep, Dismiss
Each influencer is measured against the roster average of $51,532. At or above 1.05 times ($54,108) is Promote; at or below 0.90 times ($46,379) is Dismiss; in between is Keep. The rule is fair because effort, slots, and audiences are held constant, so revenue reflects the person.
Rank
Influencer
Group
Revenue
Rev / hr
Units
vs Benchmark
Verdict
1
#3
a
$59,837
$499
518
+16%
Promote
2
#7
a
$59,143
$493
477
+15%
Promote
3
#4
b
$55,730
$464
500
+8%
Promote
4
#1
a
$54,725
$456
459
+6%
Promote
5
#2
b
$52,680
$439
430
+2%
Keep
6
#8
b
$51,393
$428
415
0%
Keep
7
#6
b
$49,438
$412
430
-4%
Keep
8
#9
a
$48,239
$402
416
-6%
Keep
9
#5
a
$45,699
$381
378
-11%
Dismiss
10
#10
b
$38,433
$320
353
-25%
Dismiss
Promote #3, #7, #4, #1. They each clear the benchmark by 6% to 16% for the same effort, and the two strongest (#3 and #7) also lead the roster on engagement. Give them the released slots first; they already earn up to $499 per hour against the roster's $429 average, so shifting hours toward this tier is the single highest-return move available.
Keep #2, #8, #6, #9. They sit within 7% of the benchmark, steady and reliable with no case for change. Hold their slots and coach the upside: #8 in particular engages the best on the whole roster but converts it to only mid-table sales, so a small lift in closing could move them up a tier.
Dismiss #5 and #10. They sell 11% and 25% below the benchmark despite identical hours, identical slots, and comparable audiences, so there is no circumstantial excuse. Release them and reallocate their 240 monthly hours to the Promote tier, recovering roughly $18,900 a month of below-average output.
Change what you measure in reviews. Stop ranking influencers on audience size and conversion rate; neither predicts sales here (correlations negative 0.18 and negative 0.22). Rank on revenue and units sold, and use engagement (0.38) as the one supporting coaching signal, so every future promote, keep, or dismiss call stays grounded in what actually drives the business.
Method & data
We analysed two June 2024 datasets from the retailer's TikTok live program: 1,200 hourly streaming sessions (audience size, engagement rate, conversion rate, and the toy featured per session) and 1,446 individual sales (units, price, and value). Both are complete, with no missing values. The 10 influencers split into two fixed rotas: Group a worked the 8pm, 10pm, 12am, and 2am slots, Group b the 9pm, 11pm, 1am, and 3am slots, both covering the same overnight window with the same 120 hours each. We focused on revenue per influencer as the outcome, with units, price, engagement, conversion, audience, and time slot as the explanatory factors. One note: individual sales carry a date but no clock time, so hour-level questions use session metrics (audience and conversion by slot) rather than dollar sales by hour.
Conclusion
The single most important finding is that this roster's results are earned, not inherited. Effort is equal, time slots are equal, audiences are similar, and timing barely moves sales, so the $21,404 spread between the best and worst seller is about how well each person sells, full stop. The metrics managers usually lean on, audience size and conversion rate, are noise here; the only honest scoreboard is revenue, supported loosely by engagement.
That makes the cost of inaction concrete. The two weakest influencers sell 11% and 25% below the roster average despite identical conditions, leaving roughly $18,900 a month of below-benchmark output sitting in 240 hours of prime airtime. Those hours are the asset. Redirected to proven top sellers, they convert to materially more revenue with no extra cost and no extra staff. Set the benchmark, promote the proven sellers, release the laggards, and the same airtime will earn more within a single month.