See It Working
Try the Interactive Demo
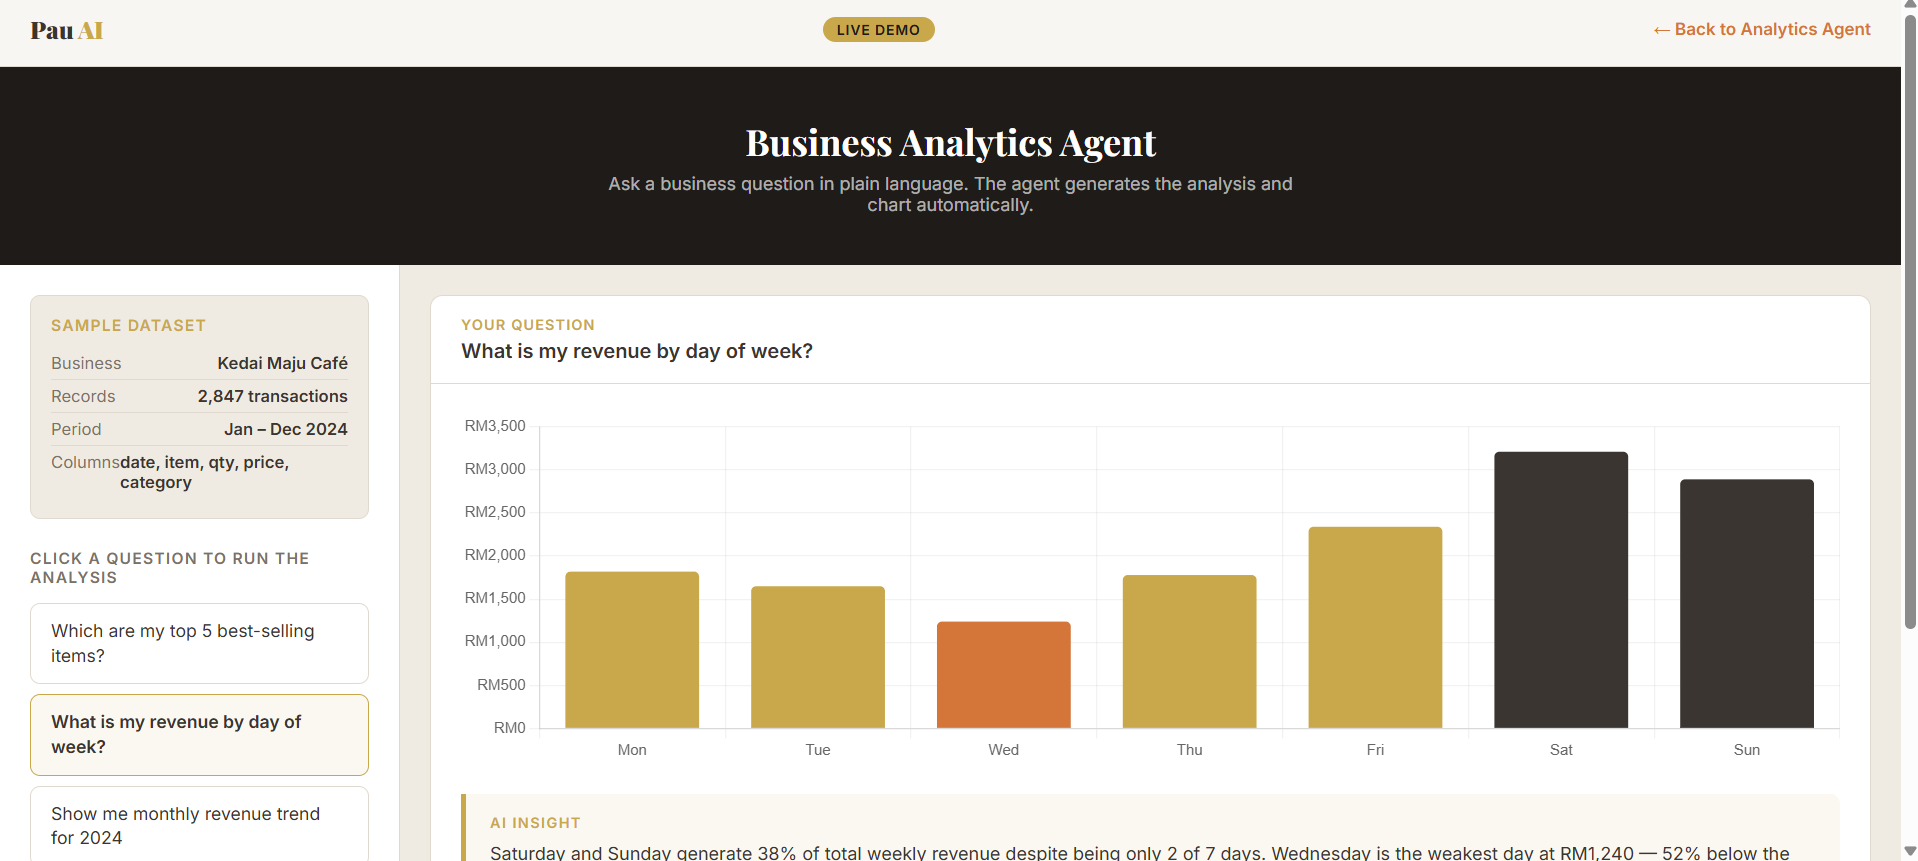
Explore preset business questions — revenue trends, top items, busy hours — with live charts and AI insights. Hardcoded sample data from a Malaysian café.
Launch Live Demo →Ask your data a question. Get a chart, not a spreadsheet.
An AI agent that turns your raw business data into answers. You type a question in plain language — "Which product had the highest return rate last month?" or "Show me revenue by day of week" — and the agent generates the Python code, runs it safely, and returns a chart and insight.
No spreadsheet skills required. No waiting for a report. Just ask and get the answer.
Which dishes sell best on weekends? Which hours are slowest? Get answers from your sales log.
Which product categories drive the most profit? Which items to reorder? Ask your inventory data.
Which campaigns drove the most conversions? What's the return rate by product category?
Compare outlet performance, identify underperforming branches, track weekly trends.
Analyse headcount trends, leave patterns, department cost breakdown.
Track SKU performance, identify slow-moving inventory, monitor delivery patterns.
A CSV file from your POS, spreadsheet, or export from any system. No special format required.
In plain language, in English or Bahasa Malaysia. The agent interprets and generates the analysis.
A visual chart plus a plain-language explanation of what the data is telling you.
Explore preset business questions — revenue trends, top items, busy hours — with live charts and AI insights. Hardcoded sample data from a Malaysian café.
Launch Live Demo →Standard configuration for your data type. Handover with setup guide and walkthrough.
Multiple data sources, scheduled reports, embedded dashboard. Contact us for a scope.
API fees, hosting, and domain not included. See full pricing →